Welcome to this beautiful sunlit brick colonial. This residence has an open floor plan. Upon entry, you're greeted by a spacious, bright foyer, open living room, dinning room and family room with a gas fireplaces, beautiful kitchen with an eating area equipped with the top of the line appliances. The sliding doors to backyard allow for an extended area for you to host your family and friends. Second floor features Primary bedroom with primary bath, 3 bedrooms and a full bath. The finished basement offers a laundry room, half bath, storage and huge space for any usage. Central A/C and heat, Central vacuum, wood floors throughout. Short distance to Great Neck park Parkwood sport complex, the
Introducing a commuter's dream! Nestled in the heart of Great Neck, this generously sized cape-style home boasts 3 bedrooms, 1.5 baths, and a host of inviting features. Step into a spacious living room and formal dining room, perfect for gatherings and everyday living. A cozy den and a well-appointed eat-in kitchen await, ensuring ample space for relaxation and culinary delights. The large primary bedroom includes an attached office, offering a private retreat within the home. A finished basement adds versatility, while the sizable driveway accommodates up to 3 cars with ease. Enjoy year-round comfort with central AC/heat throughout the house. Benefit from ungrieved taxes and a sizable lot
Very large expanded ranch with potential for 4-5 bedrooms/or home offices and 5 bath ideally located midblock near schools, transportation and houses of worship. House has open floor plan with eat in kitchen adjacent to sun filled family room with fireplace overlooking fenced in yard. Primary suite on main floor with en suite bath. Second primary suite on main floor also with en suite. Mother in law suite potential or home office also on first floor with separate entrance. Unique house over 2800 sq ft with all park district privileges of Great Neck! No Saturday Showings
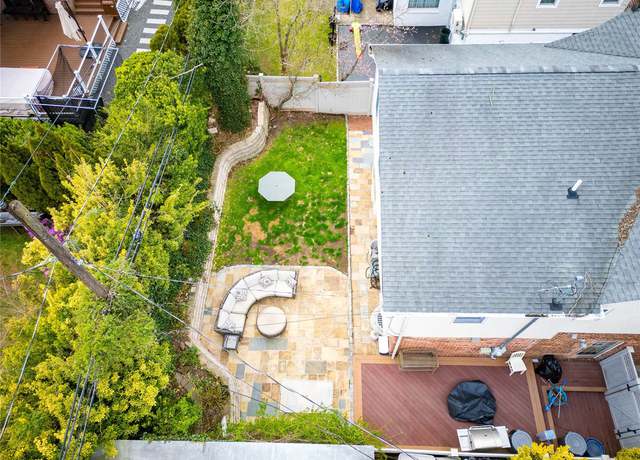
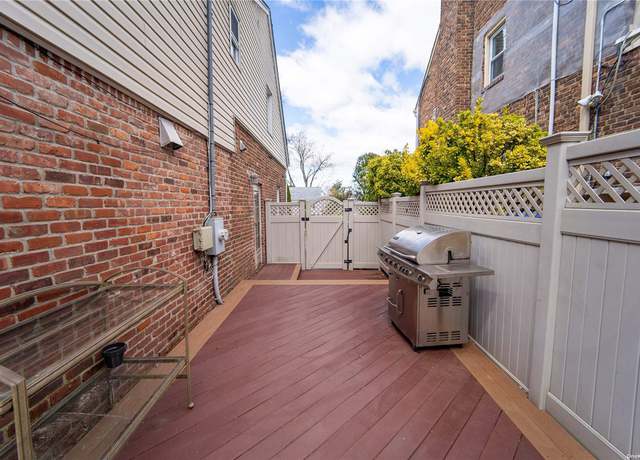
Location, Location, Location! Enjoy all the benefits of Great Neck Park District with a waterfront park, boating marina, ice skating rink, swimming pool, and more. This home offers the epitome of convenience. .. Just a stone's throw away from the renowned Allenwood Park which offers trails, a baseball field, a soccer field, two playgrounds, a splash pad, a pond, a gazebo, and an area to sit, dine and take in the ambiance. Some highlights include a large kitchen with center island leading through glass doors to a private deck, main floor laundry, and a study/bedroom on the main floor. This home presents endless possibilities - come and explore the untapped potential waiting within these wal
First Show, Spacious, Bright beautiful Ranch. Located in the desirable Village of Great neck, this home features 3 bedrooms, 2 Full Baths, Eat-in-kitchen leading to the big terrace, Finished ground level basement with playroom/office lots of closets, 2 car garage. Near transportation . Enjoy the great Neck Park District with Amenities waterfront park, pool, ice skating and Sport Center.
Welcome to this elegant colonial-style home, meticulously crafted in 1999 and nestled in a picturesque neighborhood. As you approach the property, you're greeted by a natural-looking lawn and a classic facade adorned with timeless architectural details. Upon entering through the grand double doors, you step into a spacious foyer with double-level high ceilings and a skylight. Gleaming hardwood marble floors extend throughout the main level, exuding luxury and warmth. The formal living room beckons with its refined ambiance, featuring intricate crown molding, a fireplace framed by a marble hearth, and large windows that fill the space with natural light. Adjacent to the living room is a cozy
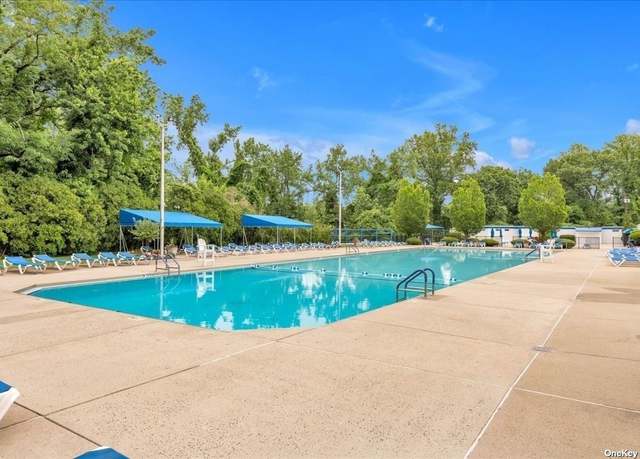
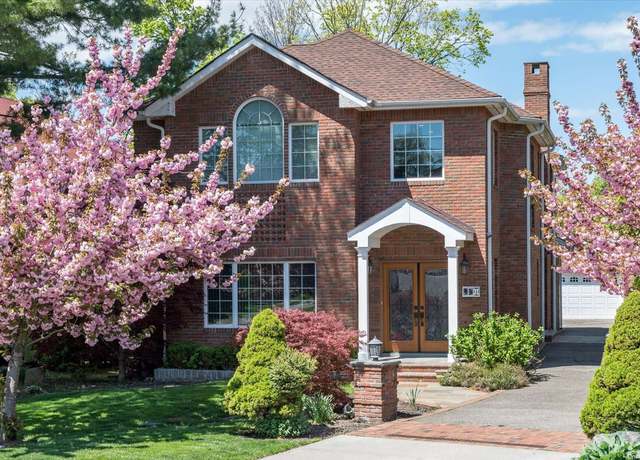
SUNNY 5 YEAR YOUNG Construction Near Kings Point. Brick Colonial on Quiet Cul De Sac Location. Approx 4000sq. ft. Elegant Two Story Entry Foyer. Open Floor Plan with High Ceilings and Hardwood Floors. Eat-in Kitchen with Top of the Line Appliances, Custom Cabinets and Radiant Heat Floors. Large Sunny Breakfast Area, 4 Bedroom 3.5 Elegant Baths. Radiant Heat Floors. Large Part Finished Basement with Bath; Over-sized Driveway Fits Many Cars. Residents Enjoy Use of the Great Neck Park District Including Parkwood Sports Complex with Olympic Pools, Lazy River, Sports Courts, Ice Skating and Waterfront Steppingstone Park. JFK Elementary/ Great Neck North Middle and High Schools.
Stunning grand colonial home, nestled in the center of Great Neck. Built in 1991 and renovated in 2017, this house seamlessly blends modern sophistication with classic charm. Upon entrance, the property boasts a 23-foot-high grand foyer, setting the stage for its elegant interior. The main level exudes both grace and functionality, featuring a formal living room and dining room. The heart of the home lies in its expansive open-concept kitchen, complete with modern finishes with direct access to a private deck overlooking its serene backyard. The laundry room is seamlessly merged with the mudroom behind the kitchen. Another highlight of the main level is the second primary bedroom, offering
Welcome to this charming brick Colonial nestled in the heart of the Village of Great Neck. This timeless residence exudes character and elegance. Step inside to discover a spacious living room adorned with hardwood floors, a fireplace, the adjacent dining room provides the perfect setting for formal gatherings and intimate dinners. The sunroom is a delightful retreat. The Chef's kitchen boasting stainless steel appliances, granite countertops, and custom cabinetry, making meal preparation a joyous experience. Upstairs, the home offers five bedrooms, The primary suite and a beautifully appointed en-suite bathroom. The finished basement adds valuable living space, providing a versatile area t
A prime location! This stunning Ranch with Full Basement is situated on a peaceful cul-de-sac. A modern home featuring updated Kitchen, Baths, Bedroom, and Den. The Kitchen boasts high-end Brizo fixtures, pot filler, custom cabinets, under cabinet lighting and outlets along with antique brown Breakfast Bar with seating for 5, two separate sinks, and more. The property measures 80'X100', totaling 8000 sq ft (4000 sq ft buildable). The Primary Bedroom includes a full-size bathroom. Spacious bedrooms with plenty of natural light. In-ground sprinkler system, central AC, smart home features, and a double driveway that can accommodate 6 cars. Just a short walk to places of worship, Middle and Hig
Elevate your lifestyle. Sleek 1st floor home, accessible via a ramp, features a spacious bathroom with both a separate TUB & SHOWER. A modern, open kitchen has marble flooring extending into the entry & dining area. Enjoy the ambiance of newer recessed lighting & the elegance of hardwood floors. Your own GARAGE is conveniently behind the building. In prime one-way circle, this property offers a stunning Olympic/kiddie pool complex, a serene arboretum, picnic spaces, newer playground, basketball & sand volleyball courts, complemented by roving security & fully equipped community room available for rental. Proximity to the LI Railroad (Zone 3), bus service to Que
Welcome to this spacious, sun filled one bedroom apartment in the heart of Great Neck. Warm and cozy kitchen with granite countertops. Large living room and elegant dining room area. Grand sized bedroom with ample space for furniture. Amazing sunshine fills every room. Lots of windows and closets. Very desirable building with elevator, Super on premises and renovated lobby. A bonus private single garage with storage space at no extra fee, will transfer at closing with unit. Great location!
Great Neck Village Great Opportunity to Renovate to Taste or Build Your Own Custom New Home. Spacious Interiors. Quite Block. 5 Bedrooms - 3 Full Baths. Walj-Out Basement.
Welcome to this beautiful sunlit colonial with its prime location on the most desirable location in Great Neck. This residence has an open floor plan. Upon entry, you're greeted by a spacious, bright, and open living area, family room with a gas fireplaces, formal dining room, kitchen with an eating area equipped with the top of the line appliances, and gas generator. The sliding doors to backyard allow for an extended area for you to host your family and friends. Second floor features Primary bedroom with primary bath, 3 bedrooms and 2 full baths. The finished basement offers a family room, office, a fitness area, and laundry room. Central A/C and heat, Central vacuum, wood floors througho
Nestled in the heart of the Village of Great Neck, this stunning colonial corner house is a perfect blend of elegance and convenience. The home welcomes you with a formal living room that seamlessly flows into a dining room designed for memorable gatherings. The eat-in kitchen, equipped with modern appliances, overlooks the beautifully landscaped surroundings. This property boasts four spacious bedrooms and 4.5 bathrooms, ensuring ample space for family and guests alike. Recent upgrades include new windows and siding, adding to the home's charm and curb appeal. The finished basement offers additional living space, ideal for a home office, gym, or entertainment area. Outdoor living is equall
Cozy 3-bedroom 3-bath ranch house located in the most desirable tree-lined University Gardens Great Neck. Large and open Living room with cathedral ceiling, updated kitchen, a dan on the first floor can also be used as office or the 4th bedroom. Full and finished basement. New water tank, Beautiful community, Great Neck South middle and high school, Lakeville elementary. Short distance to bus stop and LIRR Great Neck station. HOA fee around $600/year
Welcome to this half-acre park-like property with unobstructed breathtaking water views of Millpond property. This residence is a 5-bedroom, 4-bath split that offers comfort and a tranquil living experience. As you step inside, you are greeted by high cathedral ceilings, skylights, a fireplace, and an open concept with natural light. The kitchen is equipped with modern appliances and granite counters. Enjoy the paramount landscape from your private balcony and the second den with fireplace. This great neck gem is not just a house but a home that offers a lifestyle of comfort, privacy, and natural beauty. Recreational areas like the highly rated Andrew Stergiopoulos Ice Rink and Park wood In
Welcome to this beautifully renovated split-level home nestled in the prestigious Village of Saddle Rock. Boasting 4 bedrooms and 3 baths, this residence offers a spacious and contemporary style. Step inside to discover a bright & sunny home adorned with large windows that illuminate the interior with natural light. The open-concept layout seamlessly connects the living room, dining area, and renovated eat-in kitchen w/ State-of-the-art appliances, creating a perfect flow for entertaining and daily living. Enjoy an oversized den w/ working fireplace & floor to ceiling windows and doors opening up to private patio & flat backyard. The private primary suite with its own en-s
This charming single family home located at 103 Old Mill Rd in Great Neck, NY was built in 1937 and offers a total of 3 bathrooms and 1 half bathroom. With a spacious finished area of 2,428 sq. ft. spread across 2 stories, this home sits on a generous lot size of 15,002 sq. ft. The property combines historic charm with modern updates, providing a comfortable and inviting living space for its residents. Brick Center Hall Classic Colonial In The Heart Of Great Neck. Architectural Details Showcased With Beautiful Moldings, Wood Floors And Spacious Sun Drenched Rooms. Perfect For Elegant Entertaining And Comfortable Living. Great Neck school district. Close To Transportation, Shopping the new b
This stunning single-family home in the heart of Great Neck offers 3 bedrooms, 2.5 baths, a spacious living room, formal dining room, and an eat-in kitchen. The finished basement, two-car garage, and extra-large driveway accommodating 3 cars add to its appeal. With a new water boiler and dual heating zones, it ensures comfort. The lot size is 60x105 in a convenient location. Located in the prestigious South Great Neck School District, it's a short walk from shops, restaurants, and supermarkets, providing a lifestyle of convenience. Easy access to LIRR & Q36 and Q12 buses enhances connectivity. Viewing is a must to truly appreciate this home
SADDLE ROCK 1ST SHOW SUNNY YOUNG CONTEMP SPLIT - Vaulted Formal Living Room - Formal Dining Room - Large EIK with Door to Deck - 4 Bedrooms on 2nd Level with 3 Full Updated Bathrooms - Few Steps Up to Expanded Master Bedroom with Full Bath, Large Walk-in Closet & Ceiling Fan - Fabulous Lower Level with Doors to Backyard, Wet Bar, Fireplace, Guest Room, Full Bath & Mud Room with Large Closet Leading to 2 Car Garage. Wonderful Backyard. Conveniently Located. Enjoy Access to Top Notch Amenities, including Waterfront Pool, Tennis Courts & Outdoor Gym Equipment. Saddle Rock Elementary; Great Neck North Middle & High Schools.
Presenting an exceptional, unique, and private 5-bedroom, 3-bathroom contemporary home in the Village of Kensington. This distinctive residence spans 2663 square feet and sits on a generous lot of almost half an acre. The home features an open floorplan with hardwood floors, skylights, and floor-to-ceiling windows creating an inviting and relaxing ambiance, while the private back yard and stone patio offers a peaceful outdoor oasis.
keeping the classic look this Grand Colonial is a completely updated top to bottom situated in the heart of Great Neck. Old world charm with modern conveniences. This magnificent, spacious home has 6 large bedrooms, with an office and gym that could be used as two additional bedrooms. Entertainer's paradise, inside and out. Multi-tiered, park-like yard with private garden and deck. A must see. A rare opportunity to own this one of a kind home in the area you desire.
Enjoy a luxury lifestyle with this exceptional single-family home nestled in the Great Neck neighborhood. A true masterpiece with it's stone, wood, and stucco architectural designs. Upon entering, you're welcomed by a stunning limestone foyer entryway, following an impressive living room with soaring 18' ceilings, a Chesney fireplace, and awe-inspiring Brancusi-inspired columns. The first floor is a harmonious balance of comfort and style, offering a spacious living room, an inviting formal dining room, a cozy den, and a well-appointed eat-in kitchen with a generously sized breakfast area. The Ralph Lauren-style library/Home Office, complete with a library ladder, provides an elegant space
Great Neck, NY - Magnificent 7-bedroom Tudor estate, set on 1.0285 landscaped acres, completed in 1930 and exquisitely updated and dressed to perfection. Nestled within the University Gardens neighborhood (fees/dues). Expansive bluestone patio with built-in summer kitchen. Striking foyer with a grand bifurcated staircase and a soaring coffered ceiling. Principal rooms filled with natural light. Impressive formal living room, library/office, sophisticated dining room, kitchen with furniture-like custom wood cabinetry. There are 2 sumptuous primary suites with 5 additional luxurious bedrooms, spa-like baths with radiant heat and custom closets with fittings. Lower level features a spacious en
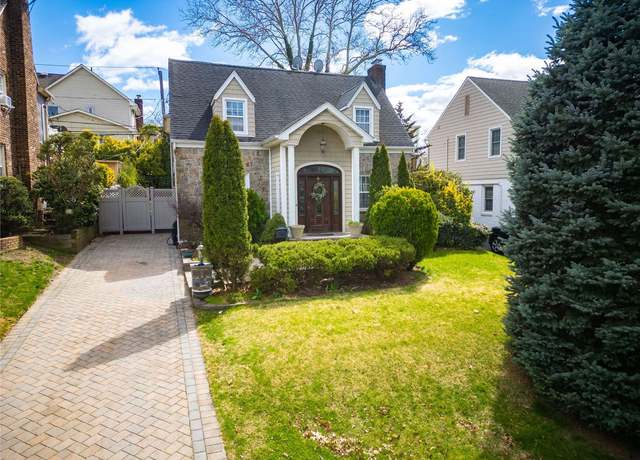
Charming Cape with a warm and inviting atmosphere. Four generous bedrooms offer ample space for rest and relaxation. Enjoy the convenience of a well-appointed kitchen and delightful dining area. Step outside and revel in the serene surroundings from the comfort of your own backyard. Conveniently located in the heart of the Village of Great Neck, minutes away from restaurants, shopping, Houses of Worship and LIRR. Residents Enjoy Great Neck Park District With Olympic Pools, Lazy River, Ice Skating Rink, Tennis Courts and Waterfront Steppingstone Park! A perfect blend of comfort and character, this Cape is a wonderful place to call home!
Nestled within a picturesque expanse, this exquisite property basks in abundant sunlight, its orientation facing the serene South. The grandeur unfolds through a central entrance, ushering you into a spacious living room with soaring high ceilings, complemented by an open second floor that graciously overlooks the main level. The first floor is a symphony of refined spaces, encompassing a Living Room, Dining Room, Den, Eat-In Kitchen, and a bedroom with a full bath, complete with convenient amenities like a laundry area and a two-car attached garage. A seamless transition from the main floor leads to an expansive deck that affords captivating views of the backyard. Ascending to the second l
GARAGE PARKING INCLUDED!! Charming 1 Bedroom In a beautiful Italian Style Co-Op Development "Tuscany Court" PET FRIENDLY BLDG. Large living room, NEWLY RENOVATED kitchen, 1 bedroom, and private outside entrance. Garage Parking included. Common Laundry room On Premises. Close Proximity To LIRR, Shopping, Dining, And Much More. Heat & Water Included. Board approval required.
$299,000
1 bed1 bath— sq ft
215 Middle Neck Rd Unit 15-1C, Great Neck, NY 11023
To all Investors. Opportunity to Renovate or Build New Construction on a Large Lot 43,560 sq ft. (1 acre). Desirable Kings Point with a beautiful water view of Manhasset Bay. See the Aerial Video tour: Copy and paste into you browser, https://tour. vht.com/434356249/idx
Stately 10-room Tudor with Breathtaking Panoramic Water Views. Sitting on 1.7 acres of Partially Wooded Land in the Desirable Village of Kings Point overlooking Manhasset Bay, Buyer has the Option to Work with the Present Owners to Complete Property Renovation to their Preference. See Aerial Tour or Copy and Paste into Browser: https://tour. vht.com/434356251/375-e-shore-rd-great-neck-ny-11023/aerialvideo/idx
Welcome to this charming home in the award-winning Great Neck School District, located in the desirable Allenwood area of Great Neck! This well maintained residence offers a perfect blend of comfort, convenience, and style. With 3 bedrooms, including a primary suite with a walk-in closet and full bath, this home provides ample space. The abundance of natural light that floods the interior creates an inviting and cheerful atmosphere. The living room features a wood-burning fireplace, perfect for cozy evenings spent with loved ones. The hardwood floors add a touch of elegance and easy maintenance. The kitchen is totally renovated, thoughtfully designed and offers plenty of storage and counte
Welcome to the perfect blend of comfort and convenience at this remarkable side-by-side legal 2-family house in Great Neck. Offering two separate units, each 3 bedrooms 1 Bath with its own private entry, meters, boilers, and garages, this property caters to both self-living and investment needs. Unit A welcomes you with a spacious living area featuring a fireplace, a granite kitchen, and a dedicated basement. Step outside to your private patio and side yard, creating a perfect oasis for relaxation and entertaining. Unit B offers access to a spacious attic area, ideal for customization to your needs. this property is situated within a community offering numerous amenities, including a swimmi
Welcome to this beautiful young home in the Allenwood section of Great Neck. Situated on a quiet street, this sunny and very spacious home offers a serene and peaceful living environment. Conveniently located close to Allenwood Park, the LIRR, and bus stops, this home provides easy access to outdoor recreation and transportation options. Step inside this home and be greeted by hardwood floors that add warmth and elegance to the living spaces. The abundance of natural light throughout the home creates a bright and inviting atmosphere. The main level features a very spacious eat in kitchen with a center island and doors leading to a deck. The first floor continues with a large den, large brig
Recently Renovated and Updated 3 Bedrooms, 1 Full Bath Cozy Colonial zoned in Great Schools. Full Finished Basement: laundry room/ mechanic room / open space/storage. First floor: Patio/living room/ dining island/open kitchen/den/ full bath . Second Floor: 3 Decent size bedrooms. Attic: Finished WALK-UP attic as playroom, home office and storage. Close to Transportation N57/N58, schools, parks and stores. Move-in Condition. 2 Parking Spaces on the Property. Long Flat land. All Information Is Deemed Reliable But Is Not Guaranteed.
Welcome to The Rose, where sophistication, comfort, and convenience converge seamlessly. Nestled within a vibrant community, this new condominium building offers an exceptional opportunity to enjoy a lifestyle of elegance and ease. With a prime location that balances tranquility and accessibility, The Rose immerses you in quiet suburban living while maintaining a short and convenient commute to the bustling metropolis of Manhattan. Close to the Great Neck train station and surrounded by the charming allure of boutique shops and inviting restaurants, The Rose boasts 40 exclusive units spread across 3 stories. Choose from an array of thoughtfully laid out 1-, 2-, and 3-bedroom residences that
Based on information submitted to the MLS GRID as of Sat Apr 27 2024. All data is obtained from various sources and may not have been verified by broker or MLS GRID. Supplied Open House Information is subject to change without notice. All information should be independently reviewed and verified for accuracy. Properties may or may not be listed by the office/agent presenting the information.
School data is provided by GreatSchools, a nonprofit organization. Redfin recommends buyers and renters use GreatSchools information and ratings as a first step, and conduct their own investigation to determine their desired schools or school districts, including by contacting and visiting the schools themselves.Redfin does not endorse or guarantee this information. School service boundaries are intended to be used as a reference only; they may change and are not guaranteed to be accurate. To verify school enrollment eligibility, contact the school district directly.
Great Neck, New York, offers a variety of transportation options for its residents. The town is served by a robust public transportation system, including the Long Island Rail Road and several bus routes. For those who prefer to drive, traffic levels can be high during peak hours, especially on the Northern Boulevard. Additionally, Great Neck is conveniently located near major highways such as the Long Island Expressway and the Northern State Parkway, providing easy access for car travel.
What types of properties are available in Great Neck?
Great Neck, New York offers a variety of single-family home types, including ranch-style, colonial, and contemporary homes. These homes can be found throughout the different neighborhoods of Great Neck, such as Kings Point, Lake Success, and Saddle Rock. Most properties in Great Neck, New York feature 3 to 5 bedrooms and were built in various years. To explore different property types for sale in Great Neck, New York, use the 'Home type' filter located above the active listings. Customize your search by selecting options like single-family homes, condos, townhomes, and more.
What is life like in Great Neck?
Great Neck, New York offers a vibrant lifestyle with a variety of amenities and services. The region boasts a beautiful and diverse landscape, including lush parks, tranquil lakes, and scenic waterfront areas. The weather in Great Neck is characterized by mild summers and cool winters, providing a pleasant climate throughout the year. The community provides a range of job opportunities across various industries, ensuring a dynamic and thriving economy. Residents can enjoy a wide array of recreational activities, such as hiking, biking, boating, and exploring local cultural events and entertainment options.
What are the schools and amenities like in Great Neck?
Great Neck, New York offers a variety of public amenities to enhance the lifestyle of its residents. The region boasts a rich selection of dining options with numerous restaurants to cater to diverse culinary preferences. For those who enjoy outdoor leisure, the area is home to several well-maintained parks. Daily essentials are easily accessible with a range of grocery stores available within the town. Additional amenities in Great Neck include fitness centers, libraries, and shopping centers, ensuring a comfortable and convenient living environment.
In the past month, 9 homes have been sold in Great Neck. In addition to houses in Great Neck, there were also 14 condos, 0 townhouses, and 1 multi-family unit for sale in Great Neck last month. Find your dream home in Great Neck using the tools above. Use filters to narrow your search by price, square feet, beds, and baths to find homes that fit your criteria. Our top-rated real estate agents in Great Neck are local experts and are ready to answer your questions about properties, neighborhoods, schools, and the newest listings for sale in Great Neck. Our Great Neck real estate stats and trends will give you more information about home buying and selling trends in Great Neck. If you're looking to sell your home in the Great Neck area, our listing agents can help you get the best price. Redfin is redefining real estate and the home buying process in Great Neck with industry-leading technology, full-service agents, and lower fees that provide a better value for Redfin buyers and sellers.


 REDFIN IS COMMITTED TO AND ABIDES BY THE FAIR HOUSING ACT AND EQUAL OPPORTUNITY ACT. READ REDFIN'S FAIR HOUSING POLICY AND THE NEW YORK STATE FAIR HOUSING NOTICE.
 United States
 Canada