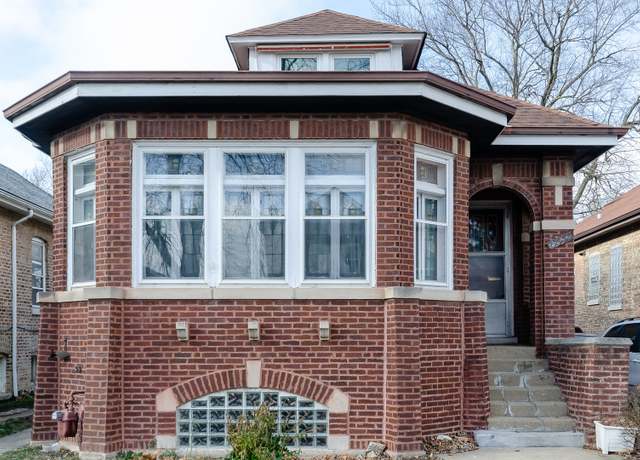
 8832 S Marshfield Ave, Chicago, IL 60620
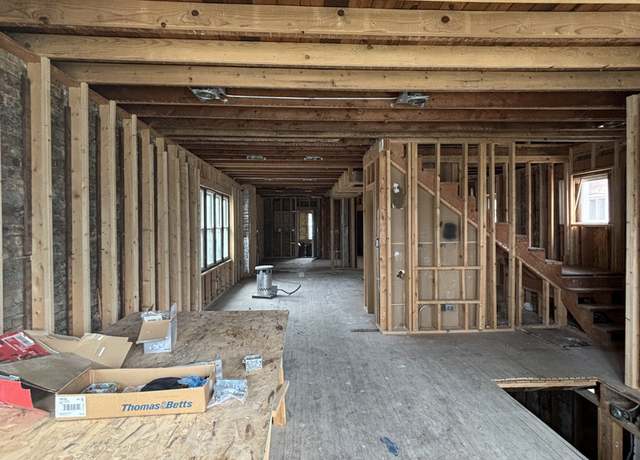 8832 S Marshfield Ave, Chicago, IL 60620
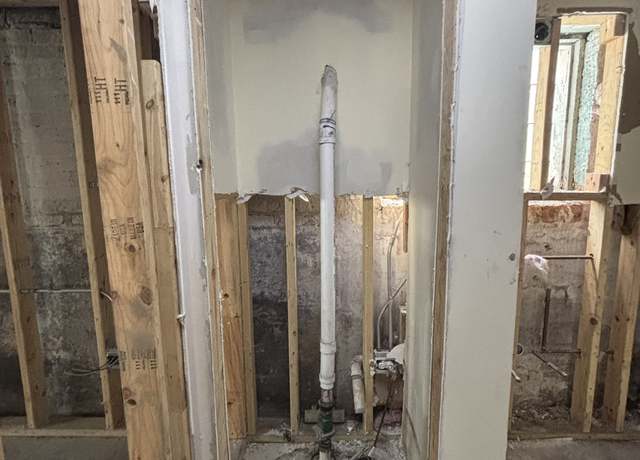 8832 S Marshfield Ave, Chicago, IL 60620
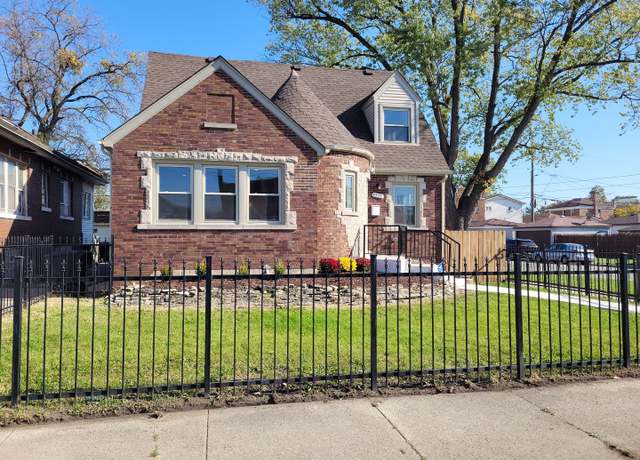 8357 S Hermitage Ave, Chicago, IL 60620
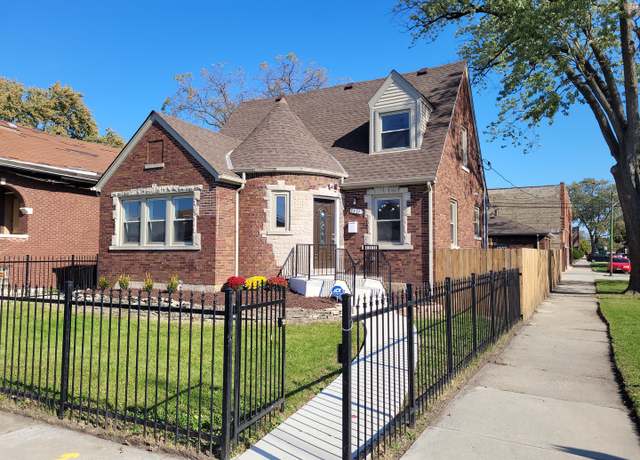 8357 S Hermitage Ave, Chicago, IL 60620
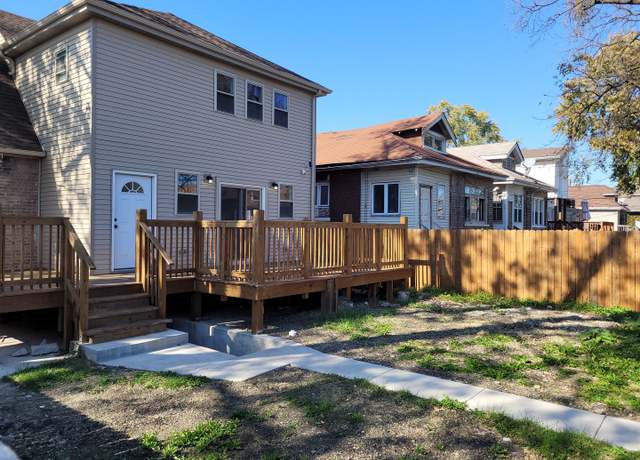 8357 S Hermitage Ave, Chicago, IL 60620
 1701 W 75th Pl, Chicago, IL 60620
 1701 W 75th Pl, Chicago, IL 60620
 1701 W 75th Pl, Chicago, IL 60620
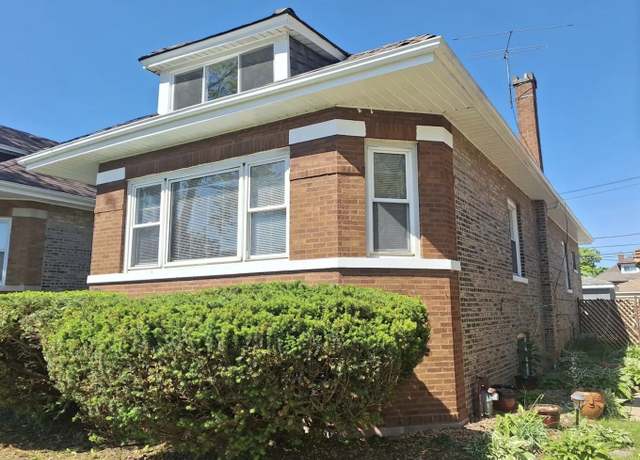 8732 S Laflin St, Chicago, IL 60620
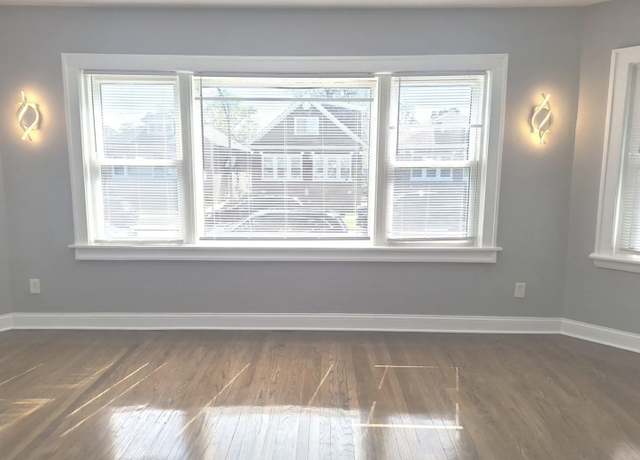 8732 S Laflin St, Chicago, IL 60620
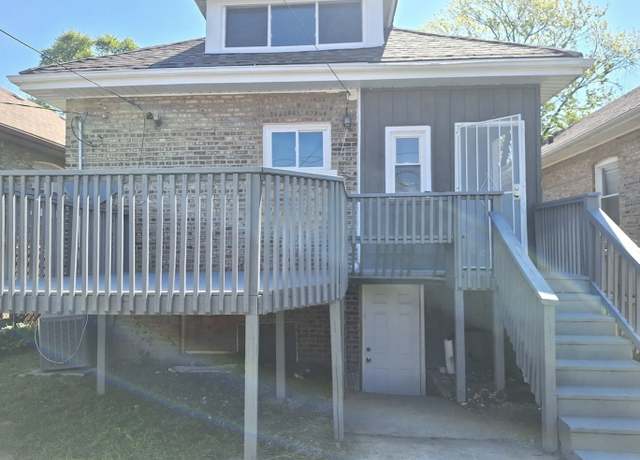 8732 S Laflin St, Chicago, IL 60620
 8241 S Aberdeen St, Chicago, IL 60620
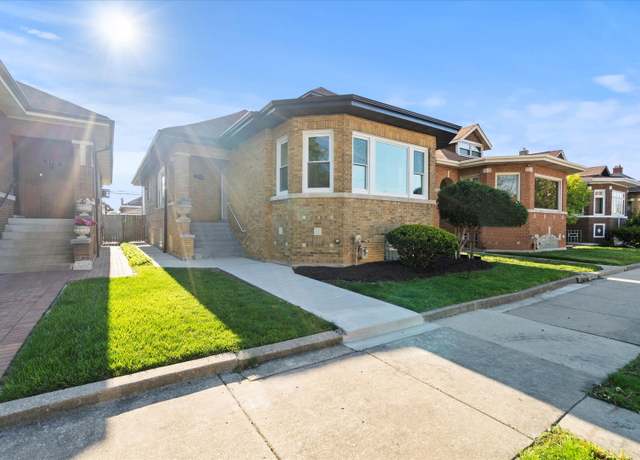 8241 S Aberdeen St, Chicago, IL 60620
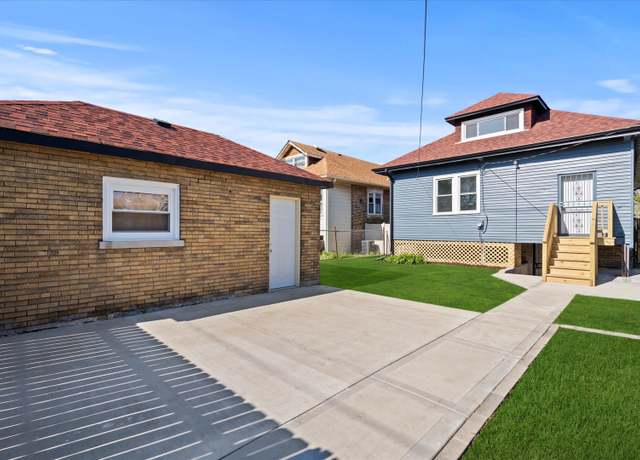 8241 S Aberdeen St, Chicago, IL 60620
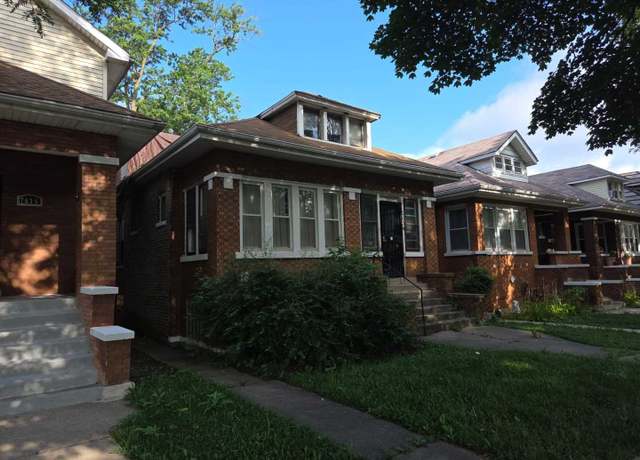 7634 S Loomis Blvd, Chicago, IL 60620
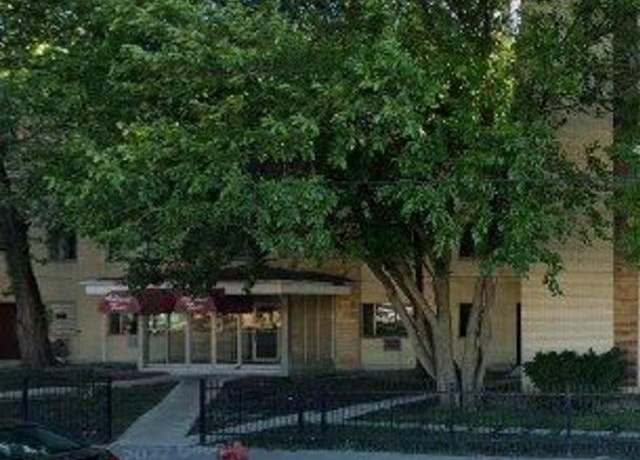 8720 S Ashland Ave Unit 2J, Chicago, IL 60620
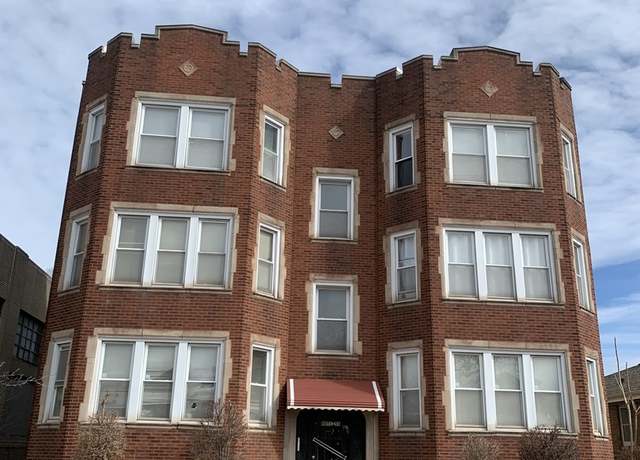 8051 S Honore St, Chicago, IL 60620
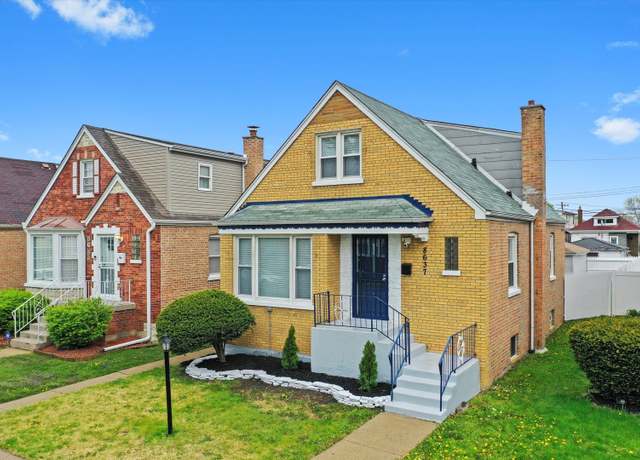 8637 S Honore St, Chicago, IL 60620
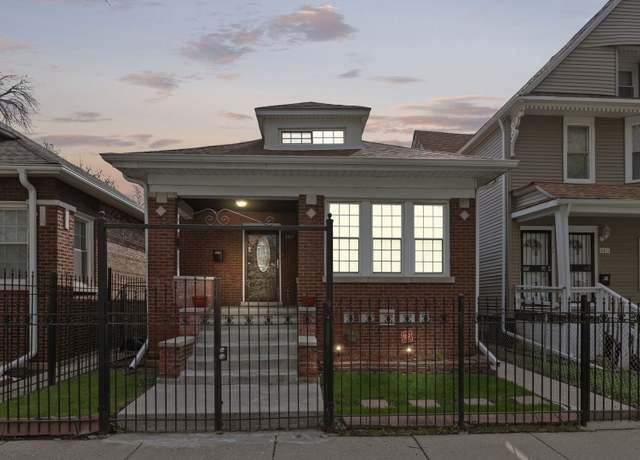 8805 S Carpenter St, Chicago, IL 60620
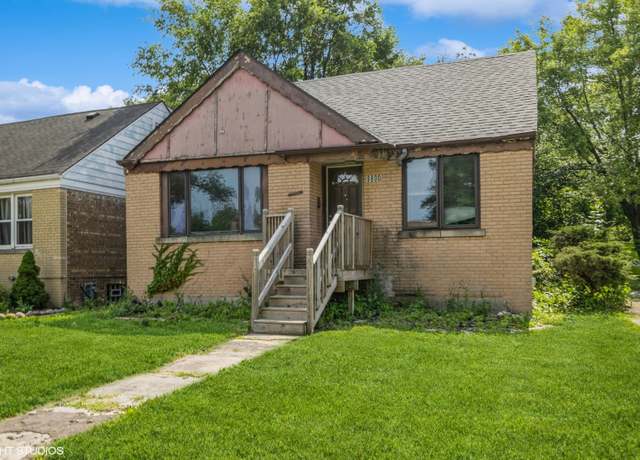 8800 S Winchester Ave, Chicago, IL 60620
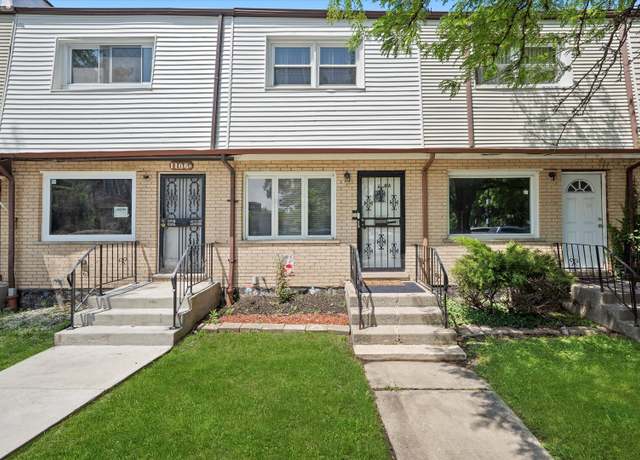 1106 W 87th St, Chicago, IL 60620
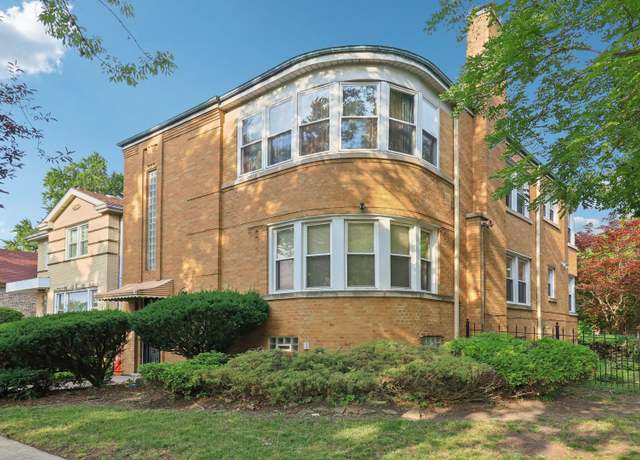 8400 S Honore St, Chicago, IL 60620
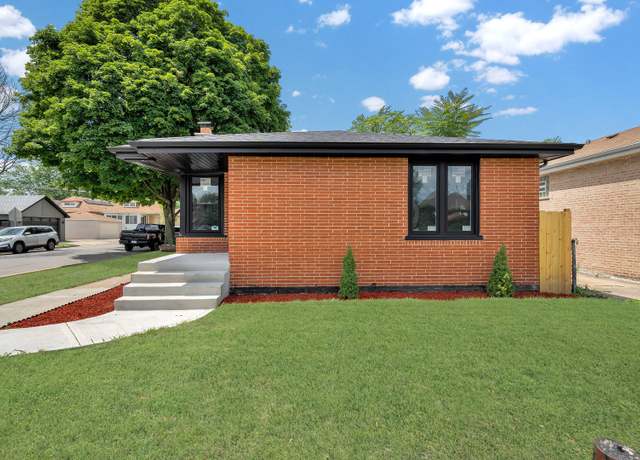 7558 S Damen Ave, Chicago, IL 60620
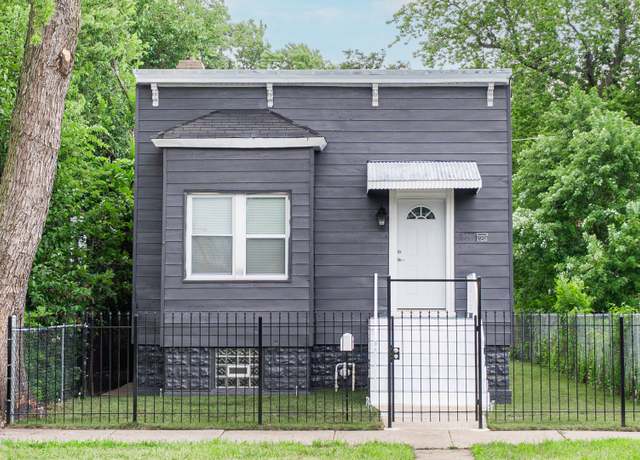 8545 S Vincennes Ave, Chicago, IL 60620
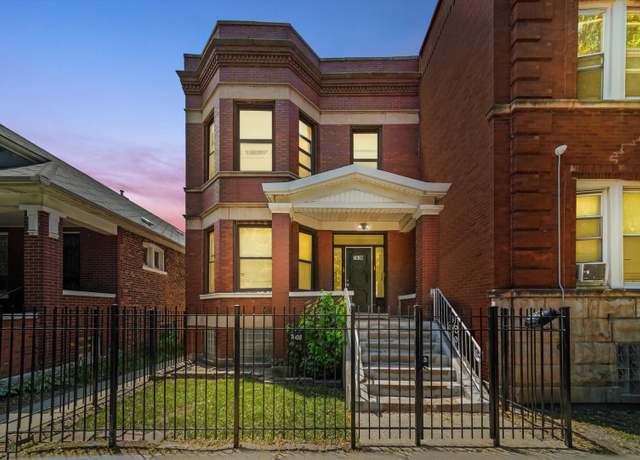 7608 S Peoria St, Chicago, IL 60620
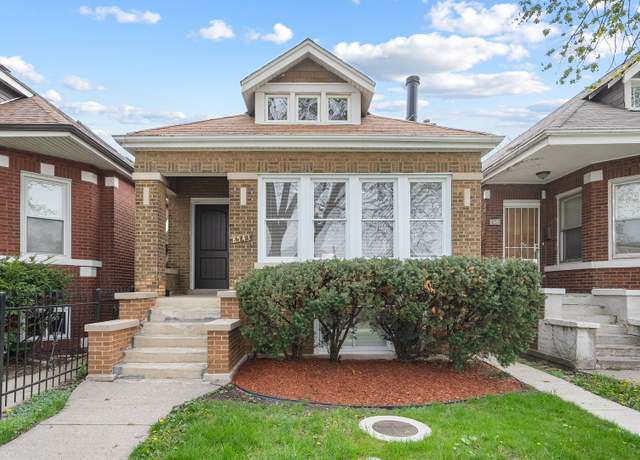 8543 S Laflin St, Chicago, IL 60620
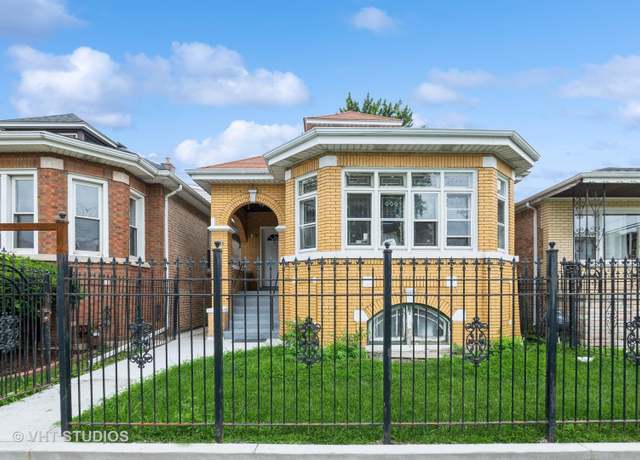 8718 S Marshfield Ave, Chicago, IL 60620
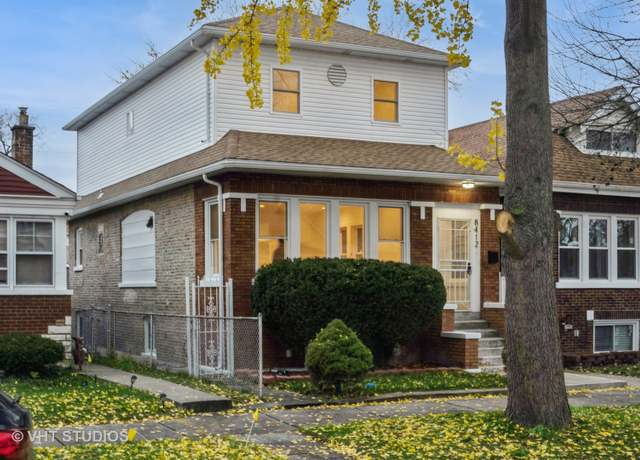 8412 S Carpenter St, Chicago, IL 60620
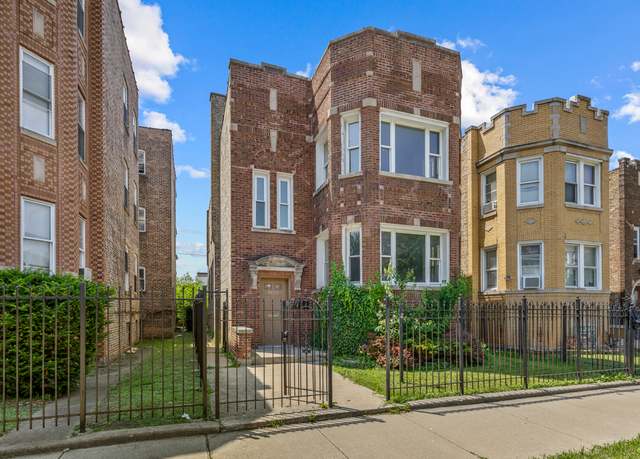 8132 S Marshfield Ave, Chicago, IL 60620
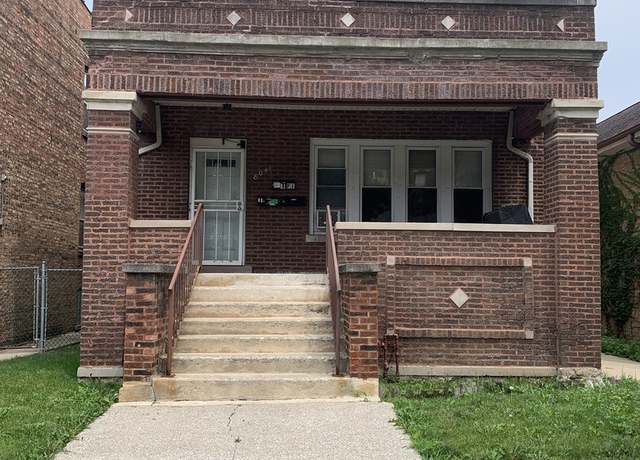 8041 S Laflin St, Chicago, IL 60620
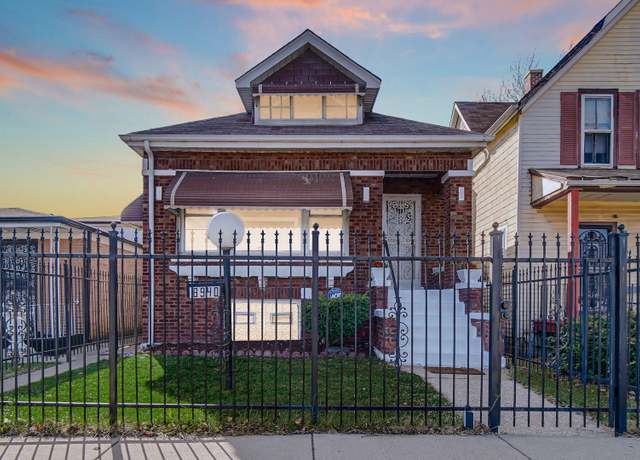 8940 S Emerald Ave, Chicago, IL 60620
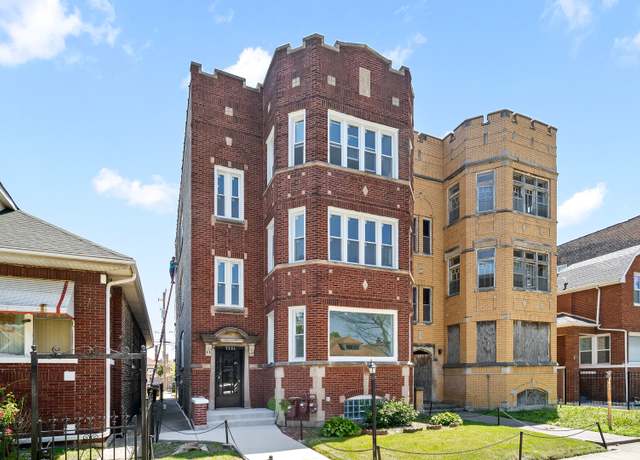 7721 S Hermitage Ave, Chicago, IL 60620
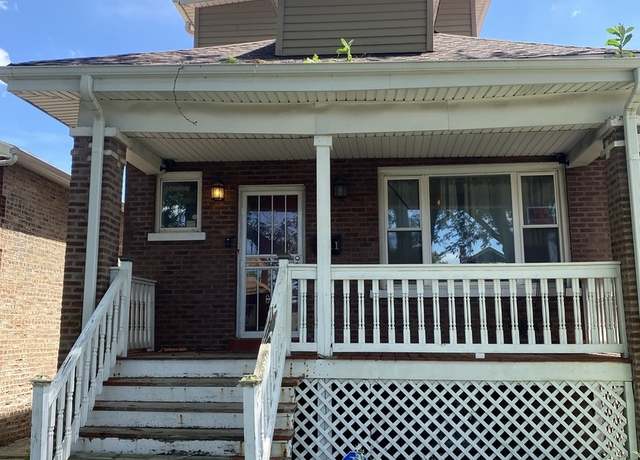 8611 S Aberdeen St, Chicago, IL 60620
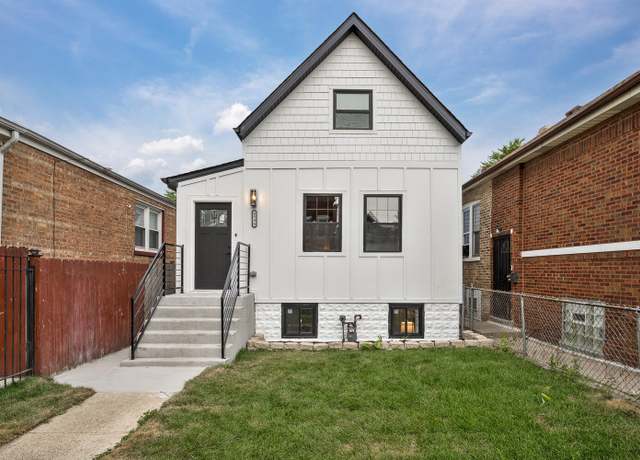 8536 S Morgan St, Chicago, IL 60620
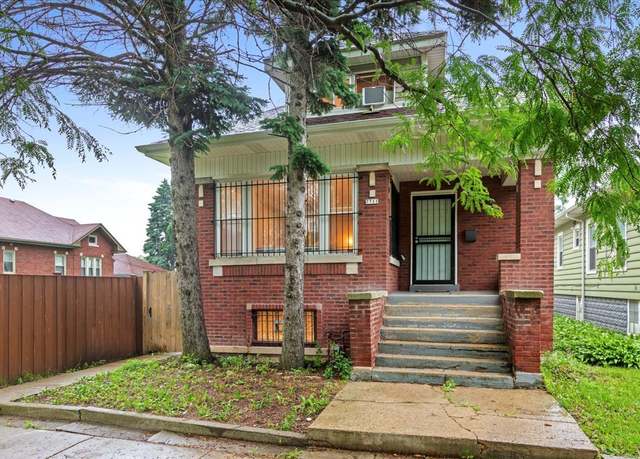 7711 S Throop St, Chicago, IL 60620
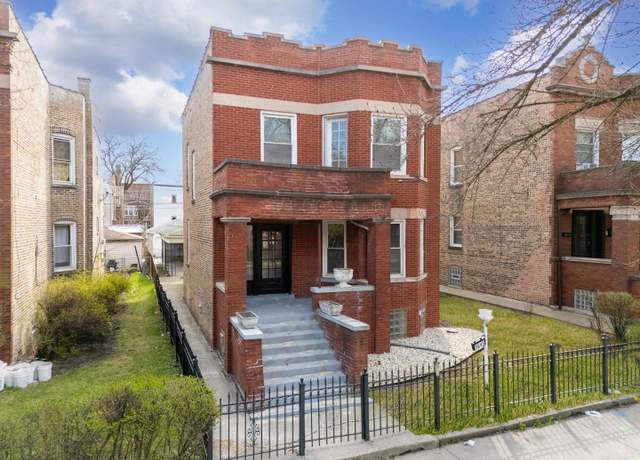 7645 S Morgan St, Chicago, IL 60620
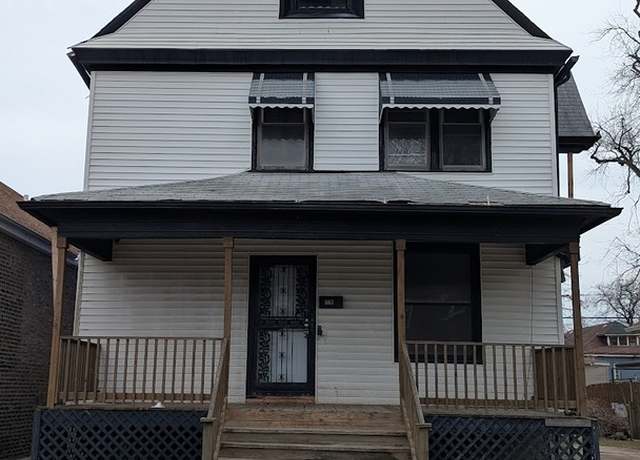 8817 S Elizabeth St, Chicago, IL 60620
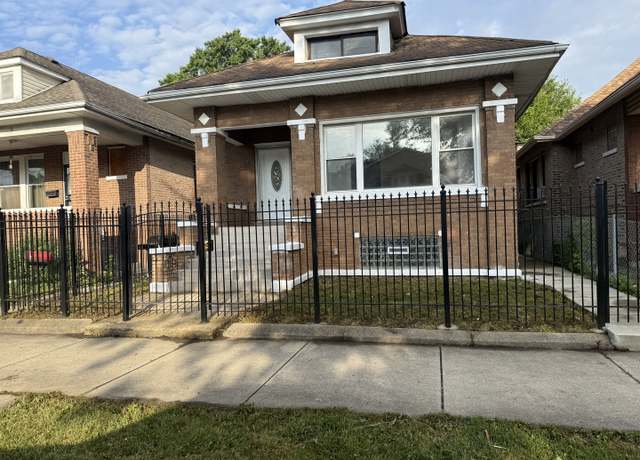 8014 S Bishop St, Chicago, IL 60620
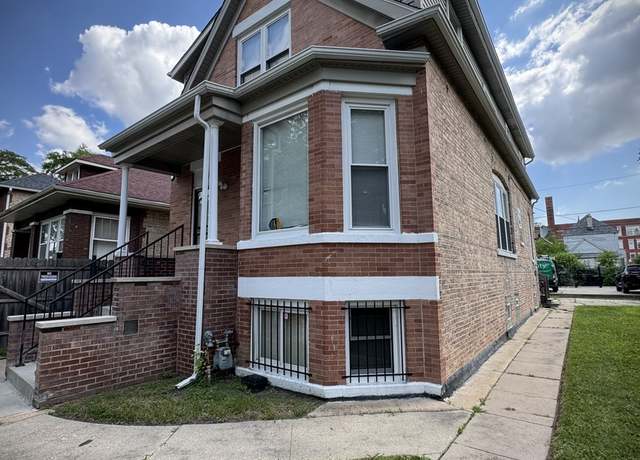 8513 S Sangamon St, Chicago, IL 60620
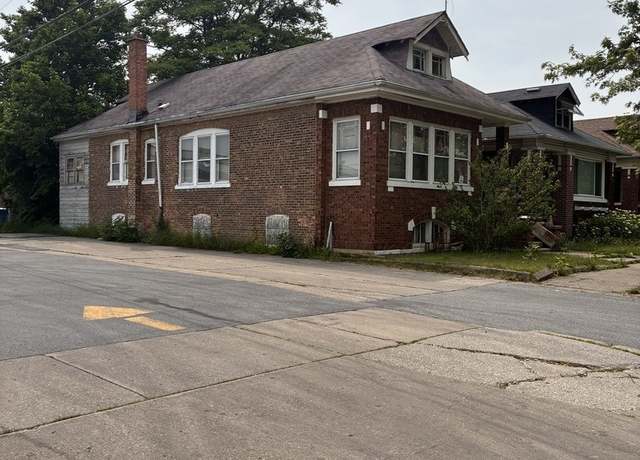 8717 S Bishop St, Chicago, IL 60620
 8551 S Ashland Ave, Chicago, IL 60620
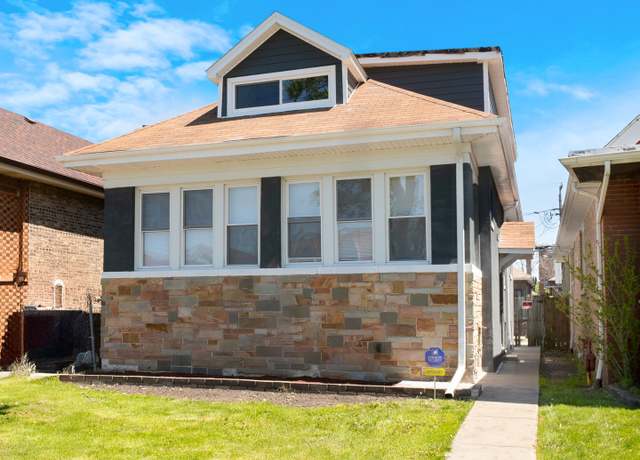 7755 S Wolcott Ave, Chicago, IL 60620
 8037 S Sangamon St, Chicago, IL 60620
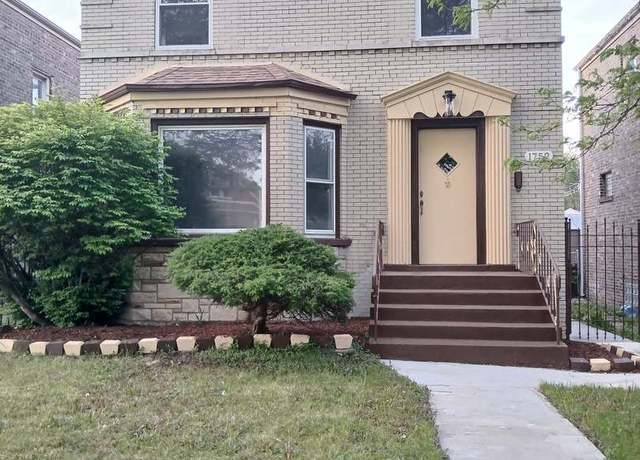 1752 W 83rd St, Chicago, IL 60620
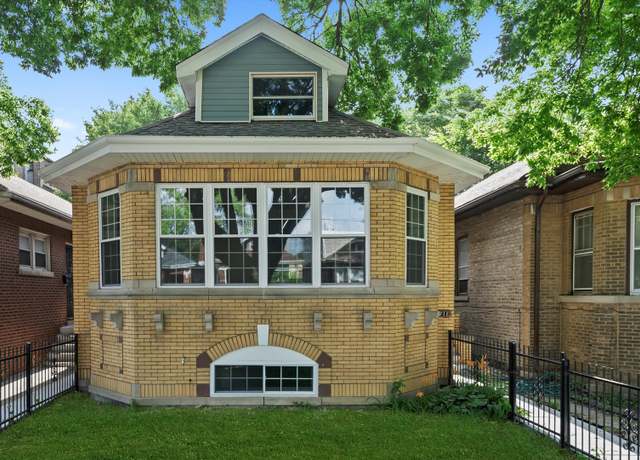 7711 S Honore St, Chicago, IL 60620
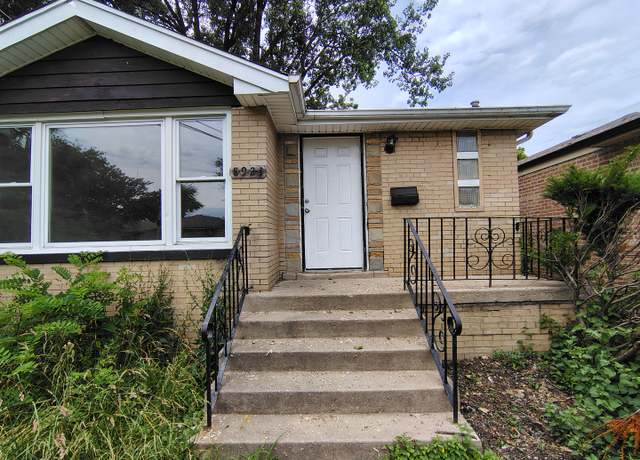 8924 S Paulina St, Chicago, IL 60620
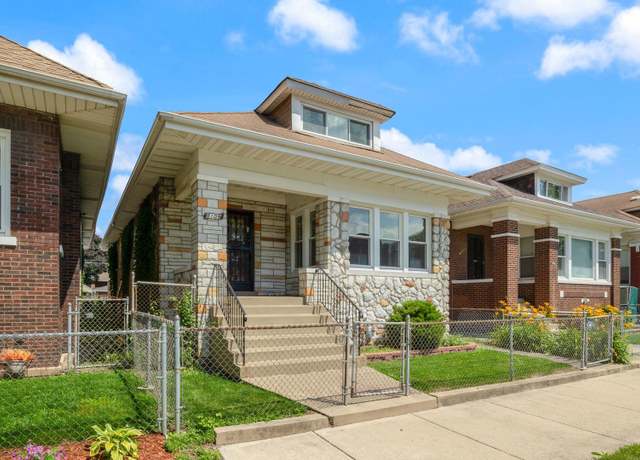 Sign in for address, Chicago, IL 60620
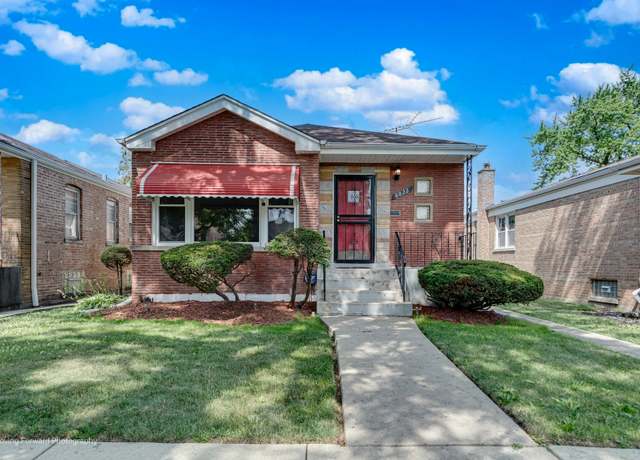 8822 S Paulina St, Chicago, IL 60620
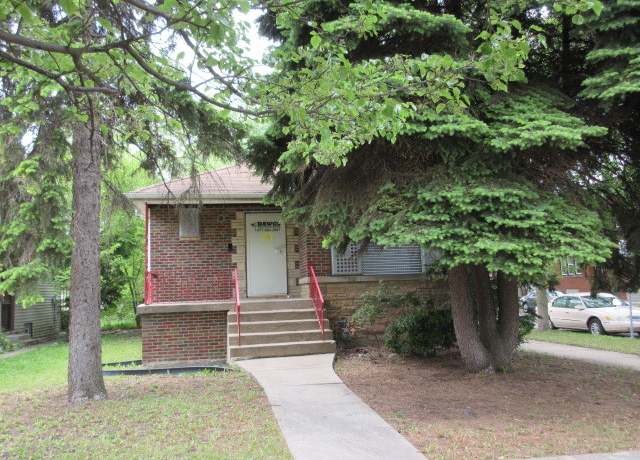 7700 S Ada St, Chicago, IL 60620
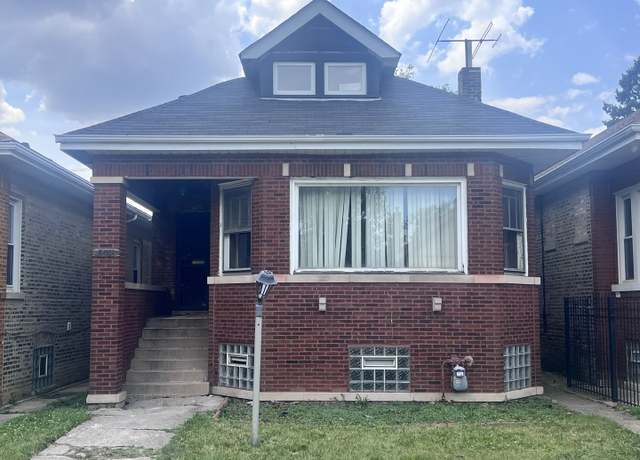 8616 S Justine St, Chicago, IL 60620
- Median Sale Price
- # of Homes Sold
- Median Days on Market
Median Sale Price (All Home Types)
$235,000
+21.1% YoY | Jun 2025
- 1 year
- 3 year
- 5 year

Based on information submitted to the MLS GRID as of Thu Jul 24 2025. All data is obtained from various sources and may not have been verified by broker or MLS GRID. Supplied Open House Information is subject to change without notice. All information should be independently reviewed and verified for accuracy. Properties may or may not be listed by the office/agent presenting the information.
About us
Find us
Subsidiaries
Copyright: © 2025 Redfin. All rights reserved.
Updated January 2023: By searching, you agree to the Terms of Use, and Privacy Policy.
Do not sell or share my personal information.
REDFIN and all REDFIN variants, TITLE FORWARD, WALK SCORE, and the R logos, are trademarks of Redfin Corporation, registered or pending in the USPTO.
California DRE #01521930
Redfin is licensed to do business in New York as Redfin Real Estate. NY Standard Operating Procedures
New Mexico Real Estate Licenses
TREC: Info About Brokerage Services, Consumer Protection Notice
Rocket Mortgage is an affiliated business of Redfin. All mortgage lending products and information are provided by Rocket Mortgage, LLC | NMLS #3030; www.NMLSConsumerAccess.org. Licensed in 50 states. This site is not authorized by the New York State Department of Financial Services for mortgage solicitation or loan applications activities related to properties located in the State of New York. For additional information on Rocket Mortgage or to receive lending services in the State of New York, please visit RocketMortgage.com.
Rocket Mortgage, LLC, Rocket Homes Real Estate LLC, Rocket Card, LLC, RockLoans Marketplace LLC (doing business as Rocket Loans), and Rocket Money, Inc., are separate operating subsidiaries of Rocket Limited Partnership. Redfin Corporation is an affiliated business of Rocket Limited Partnership. Each company is a separate legal entity operated and managed through its own management and governance structure. Rocket Limited Partnership is an indirect, wholly owned subsidiary of Rocket Companies, Inc. (NYSE: RKT).
If you are using a screen reader, or having trouble reading this website, please call Redfin Customer Support for help at 1-844-759-7732.
 REDFIN IS COMMITTED TO AND ABIDES BY THE FAIR HOUSING ACT AND EQUAL OPPORTUNITY ACT. READ REDFIN'S FAIR HOUSING POLICY AND THE NEW YORK STATE FAIR HOUSING NOTICE.
 United States
 Canada