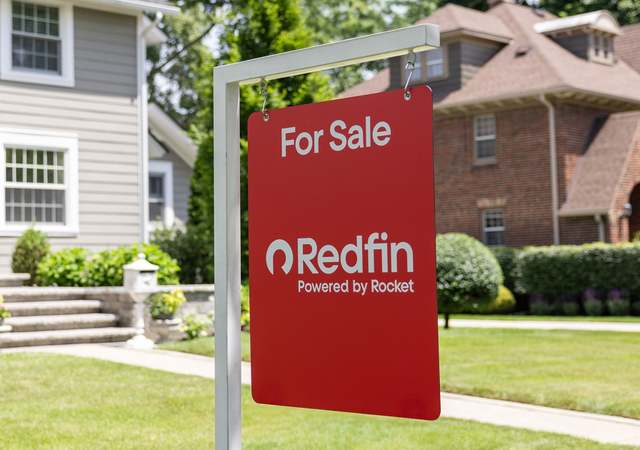
HUGE PRICE REDUCTION!! Well maintained triplex with stable cashflow. Great location, covered parking for each unit. Extra storage shed, newer exterior paint, newer roof, double pane windows, new asphault driveway. Private backyards for each unit. Property has two addresses and is actually located at 2064 San Ramon Street at the corner of Rengstorff.
Multi-familyProperty Type
1962Year Built
9,583 sq ftLot Size
$401Price/Sq.Ft.
Listed by Dan Kroner•DRE #01790340• Intero Real Estate Services
Contact: (408) 234-7784
Bought with Jerry Haslam•DRE #01180022• Coldwell Banker Realty
GREAT MONEY MAKING 3PLEX!!! Location Location Location: North Shoreline Mountain View close to great employers, stores, good schools and easy access to fwys. Units include individual backyards with all dble pane windows, 4panel doors, Great Rentable layout in good condition - ZERO VACANCIES IN 21 YEARS. Newer shake roof, 1 day old exterior paint & fixtures, new fence. 2nd Address: 2064 San Ramon
Public Records
Dec 21, 1984
Sold
$228,500
$100/sq ft
Year
Property tax
Land + Additions
Assessment*
2025
$13,559 (+0.6%)
$1,105,326 + $43,954
$1,149,280
2024
$13,481 (+1.3%)
$1,083,653 + $43,093
$1,126,746
2023
$13,305 (+0.3%)
$1,062,405 + $42,249
$1,104,654
2022
$13,267 (+2.4%)
$1,041,574 + $41,421
$1,082,995
2021
$12,955 (+0.6%)
$1,021,151 + $40,609
$1,061,760
2020
$12,879 (+4.6%)
$1,001,129 + $39,813
$1,040,942
2019
$12,315 (+0.9%)
$990,864 + $39,405
$1,030,269
2018
$12,203 (+4.7%)
$971,436 + $38,633
$1,010,069
2017
$11,651 (+1.7%)
$933,715 + $37,134
$970,849
2016
$11,458 (+2.6%)
$933,715 + $37,134
$970,849
2015
$11,169 (+1.2%)
$915,407 + $36,406
$951,813
2014
$11,035 (+18.9%)
$883,995 + $35,158
$919,153
2012
$9,278 (+4.1%)
$860,000 + $55,000
$915,000
2011
$8,912 (+50.9%)
$703,800 + $51,000
$754,800
2010
$5,906 (−0.6%)
$241,677 + $241,677
$483,354
2009
$5,942 (+6.8%)
$239,871 + $239,871
$479,742
2008
$5,562
$235,727 + $235,727
$471,454
Tax history for 575 N RENGSTORFF Ave
Year
Property tax
Land + Additions
Assessment*
2025
$13,559 (+0.6%)
$1,105,326 + $43,954
$1,149,280
2024
$13,481 (+1.3%)
$1,083,653 + $43,093
$1,126,746
2023
$13,305 (+0.3%)
$1,062,405 + $42,249
$1,104,654
2022
$13,267 (+2.4%)
$1,041,574 + $41,421
$1,082,995
2021
$12,955 (+0.6%)
$1,021,151 + $40,609
$1,061,760
2020
$12,879 (+4.6%)
$1,001,129 + $39,813
$1,040,942
2019
$12,315 (+0.9%)
$990,864 + $39,405
$1,030,269
2018
$12,203 (+4.7%)
$971,436 + $38,633
$1,010,069
2017
$11,651 (+1.7%)
$933,715 + $37,134
$970,849
2016
$11,458 (+2.6%)
$933,715 + $37,134
$970,849
2015
$11,169 (+1.2%)
$915,407 + $36,406
$951,813
2014
$11,035 (+18.9%)
$883,995 + $35,158
$919,153
2012
$9,278 (+4.1%)
$860,000 + $55,000
$915,000
2011
$8,912 (+50.9%)
$703,800 + $51,000
$754,800
2010
$5,906 (−0.6%)
$241,677 + $241,677
$483,354
2009
$5,942 (+6.8%)
$239,871 + $239,871
$479,742
2008
$5,562
$235,727 + $235,727
$471,454
*Taxable value of land and structures on it ("additions") is determined regularly by local assessors and does not affect market price.
Public record
Public record
Zoning
Beds
—
Baths
—
Stories
2
Lot width
—
Lot depth
—
Lot size
9,585 Sq. Ft.
Year renovated
1962
Sq. Ft.
2,284
Year built
1962
Style
Multi-Family (2-4 Unit)
County
Santa Clara County
APN
15004011
Parking Spaces
—
Basement
—
Accessible
—
HOA Dues
—
Garage
—
Features
—
Last updated by owner on Aug 21, 2026.
R3-2.2
Residential-Multiple-Family District
The R3 zoning district is intended for multiple-family housing, including apartments, condominium development, rowhouse development, townhouse development, small-lot single-family development and similar and related compatible uses. The R3 zoning district is consistent with the medium, medium-high and high-density residential land use designation of the general plan. The designation of an area in the R3 zoning district will include establishing a specific maximum density for multiple-family development, expressed as a subcategory to the R3 zoning map symbol (e.g., R3-2, R3-1.5, etc.).
Permitted uses
Include but are not limited to:
Day care facility
Housing-Single unit
Housing-Multiple units
Housing-Senior
Housing-Other
Infrastructure
Office
Agriculture-Cropland
Housing-Mobile home park
Property details
Parking
Parking Information
Parking Description: Off-Street Parking, Carport, Spaces per Unit (1)
Interior
Room Information
Kitchen Description: Dishwasher, Varies by Unit, Oven Range, Refrigerator(s)
Interior Features
Laundry: Community Facility, In Garage
Flooring: Laminate, Carpet (Wall-to-Wall), Vinyl/Linoleum, Carpet, Varies by Unit
HOA Amenities: Patio (Common), Patio (Private), Barbecue Area
School Information
Elementary School District: Whisman Elementary
High School District: Mountain View-Los Altos Union High
Location Information
Property is located at the corner of San Ramon and Rengstorff. It actually sits on San Ramon Street. There is two addresses for the property look for 2064 San Ramon.
Public facts
Beds: —
Baths: —
Sq. Ft.: 2,284
Stories: 2.0
Lot Size: 9,585 square feet
Style: Multi-Family (2-4 Unit)
Year Built: 1962
Year Renovated: 1962
County: Santa Clara County
APN: 15004011
Home facts updated by county records on Aug 21, 2026
Other
Miscellaneous Information
Incorporated: Yes
Around this home
Schools
Theuerkauf Elementary School
Public K-5 • Assigned • 0.6mi
5/10
Crittenden Middle School
Public 6-8 • Assigned • 0.4mi
9/10
Los Altos High School
Public 9-12 • Assigned • 2.0mi
10/10
Provided by GreatSchools
Lifestyle
Provided by Walk Score and Local Logic
Climate risks
1/10 Flood Factor
Minimal risk of a flood reaching the building in the next 30 years
1/10 Fire Factor
Unlikely to be in a wildfire in next 30 years
4/10 Heat Factor
7 days above 89° expected this year, 14 days in 30 years
1/10 Wind Factor
Minimal risk of severe winds over next 30 years
7/10 Air Factor
13 unhealthy days expected this year, 13 days in 30 years
Provided by First Street
Historical weather
Mountain View, CA • 94043
Average low and high temperatures (°F)
61
41
64
45
71
48
69
50
73
53
75
56
75
58
78
59
78
62
75
54
65
47
60
45
Jan
Feb
Mar
Apr
May
Jun
Jul
Aug
Sep
Oct
Nov
Dec
Sun exposure
In this area, properties receive around 11.1 hours in
June and 4.9 hours in December, placing it above the
U.S. average for solar exposure.
11.1 hrs
4.9 hrs
JuneDecember
Provided by Shadowmap
Work with an experienced agent and save on fees. 3 minutes to get started.