
Redfin Home Tour Index Reaches Highest Level on Record but Offers Fall
The housing market is going to get more competitive in 2016.
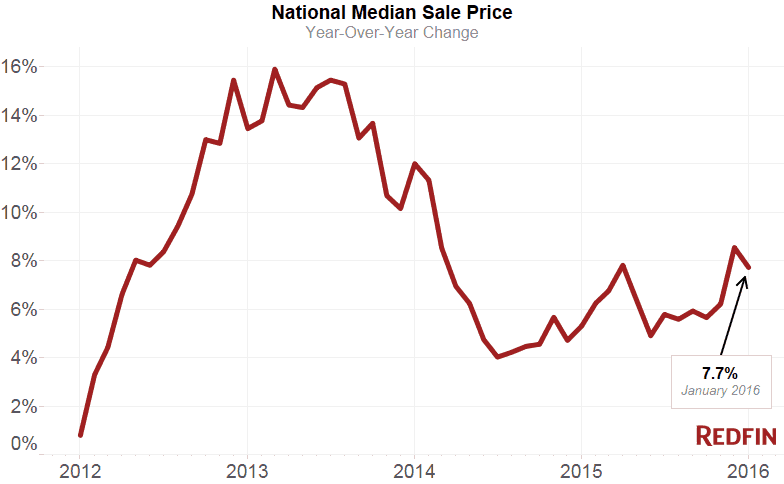
Home sales grew 6.7 percent in January from last year, while depleted inventory pushed the median sale price up 7.7 percent to $255,300. Total inventory fell by 5.6 percent, while the number of new listings inched up 0.5 percent year over year.
Half of all homes went under contract in 46 days or less, eight days faster than a year ago, and 16.6 percent of homes (about one in six) sold above asking price, up 1.4 percentage points from last year.
| Market Summary | January 2016 | Month-Over-Month | Year-Over-Year |
|---|---|---|---|
| Median sale price | $255,300 | -3.9% | 7.7% |
| Homes sold | 120,200 | -30.4% | 6.7% |
| New listings | 206,600 | 53.3% | 0.5% |
| All Homes for sale | 514,100 | 1.3% | -5.6% |
| Median days on market | 46 | 5 | -8 |
| Months of supply | 4.3 | 1.3 | -0.6 |
| Sold above list | 16.6% | -0.8% | 1.4% |
| Average Sale-to-list | 91.1% | 0.1% | 0.0% |
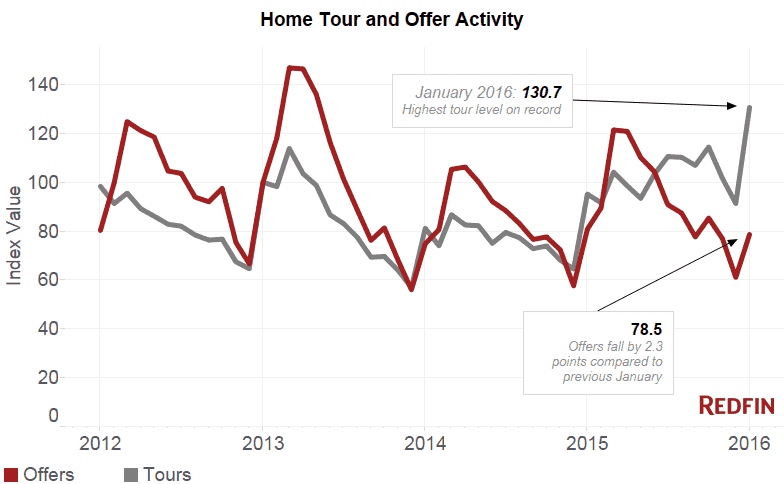
Demand has outpaced the supply of homes for sale since early 2015, when inventory began to drop sharply in many metro areas while home sales rose, growing nationwide by 9.7 percent overall last year while new listings grew by just 5.9 percent. In January, Redfin saw its home tour index reach its highest level on record, while the number of customers making offers fell year over year for the first time since October of 2013, signaling that more buyers are continuing to search but fewer are having success finding the right home in their price range.
Click here to view the interactive dashboard from Redfin’s Data Center
The Balance of the Market in 2016 Will be Determined by Supply
Low mortgage rates and improving economic conditions bolstered demand in 2015, but higher prices have not promoted matching levels of listings. Instead, low rates have caused homeowners to refinance under historically favorable terms, leaving many potential sellers happier to remain where they are and invest in improvements rather than move. We found that since 2001, the average amount of time homeowners stayed in their current residence more than doubled from four to nearly ten years. And homeowners staying put longer creates less opportunity for first-time buyers, who tend to seek already-built units as starter homes. The National Association of Realtors reported in November that the share of first-time buyers fell to 32 percent, the lowest level seen since 1987.
So where can the market go from here? We foresee three potential outcomes in 2016:
Scenario 1: Homeowners and builders bring more balance to the market. Many more homeowners decide to move up or elsewhere, and builders bring about a million and-a-half more new homes to the market than they did last year, helping to balance supply with demand. Housing starts were up by 10.5 percent in 2015. They would need to increase by double that rate in 2016, which isn’t looking likely according to the most recent data on housing starts from the Census.
Scenario 2: More competition, more price growth, slowing or weakening sales growth. Bidding wars become even more prevalent as demand remains strong, while supply is choked by lack of new listings and not enough new construction. Prices increase by double-digit rates in many regions, and home sales hover near 2015 levels.
Scenario 3: Buyers retreat, prices peak. Low inventory, high prices and competition in many areas squeeze buyers out of the market. Growth in home sales stalls, prices peak, and the top of this housing cycle is realized.
“The economy is facing significant headwinds this year. Though housing is positioned for growth it is also extremely sensitive to the jarring macroeconomy” says Redfin’s chief economist Nela Richardson. “So far sales have been bulletproof to price increases, but this is unsustainable in a slowly growing economy unless inventory improves.”
Other January Highlights
Prices
- Price growth accelerated fastest in several of the more affordable metro regions, with the median sale price in Tampa ($165,000) rising 22.2% year over year. Prices in Detroit rose 17.1% to $123,000 and increased 16.7% to $105,000 in Akron, OH.
- San Francisco ($960,000), San Jose ($765,000), and Orange County, Calif. ($599,000) had the highest median sale prices in the nation.
- Honolulu was the only metro where prices fell year over year, by 2% to $515,000.
Sales
- Albany, NY saw the largest year-over-year increase in home sales , up 28.7%, followed by Boston where sales rose 22.5%.
- Miami and West Palm Beach saw the largest declines in sales, which fell 10.7% and 7.8% from January 2015.
Competition
- Seattle and Denver were the two fastest markets, where half of all homes sold in three weeks or less. In Seattle, median days on market (21) was two weeks less than it was at this time last year.
- San Francisco, San Jose, and Oakland were the only three metro regions that continued to see the average home sell above asking price in January. The average home in San Francisco sold for 3.7% above asking price.
- Three northwest regions, Portland, Tacoma, WA, and Seattle had the largest year-over-year increases in their average sale-to-asking price. In Portland the average sale-to-list percentage climbed 2.3 points to 98.4%.
Inventory
- Grand Rapids, MI had the biggest drop in the number of homes for sale, falling 50.3% from a year ago. Louisville had a 40.1% decline, followed by Seattle with 39% fewer homes on the market.
- Miami had the largest increase in inventory with hundreds of new condos driving up supply by 48.6%. Denver had the second largest change in active listings, increasing 30.7%.
- Oakland, Seattle, and Portland had the shortest supply of homes relative to demand, with 1.2, 1.7, and 1.8 months of supply.
You can download data from the January Market Tracker in an Excel Spreadsheet.
For additional local analysis, see: Chicago | Los Angeles | San Francisco | Washington, D.C.
Median Sale Price
| Redfin Metro | Median Sale Price | Month-Over-Month | Year-Over-Year |
|---|---|---|---|
| Akron, OH | $105,000 | -9.9% | 16.7% |
| Albany, NY | $179,900 | -4.1% | -0.1% |
| Allentown, PA | $170,000 | 0.6% | 13.3% |
| Atlanta, GA | $182,000 | -6.7% | 7.1% |
| Austin, TX | $260,000 | -5.5% | 8.3% |
| Baltimore, MD | $219,000 | -6.8% | 5.8% |
| Boston, MA | $330,000 | -1.5% | 1.5% |
| Buffalo, NY | $118,000 | -5.6% | 5.6% |
| Charleston, SC | $225,000 | -7.7% | 2.3% |
| Charlotte, NC | $185,384 | -4.9% | 9.1% |
| Chicago, IL | $190,000 | -3.1% | 9.2% |
| Cincinnati, OH | $129,900 | -10.4% | 9.4% |
| Cleveland, OH | $105,000 | -12.5% | 1.0% |
| Columbus, OH | $153,000 | -2.2% | 9.4% |
| Dallas-Fort Worth, TX | $204,900 | -6.4% | 7.9% |
| Denver, CO | $318,600 | 2.1% | 12.4% |
| Detroit-Warren, MI | $123,000 | -6.7% | 17.1% |
| Fort Lauderdale, FL | $195,000 | -8.1% | 10.8% |
| Fresno, CA | $210,000 | -6.5% | 0.0% |
| Grand Rapids, MI | $137,750 | 1.3% | 10.2% |
| Greenville, SC | $168,500 | 1.5% | 4.1% |
| Hampton Roads, VA | $193,000 | -8.1% | 7.3% |
| Honolulu, HI | $515,000 | -1.9% | -2.0% |
| Houston, TX | $200,000 | -8.0% | 5.3% |
| Hudson Valley, NY | $390,000 | -7.1% | 0.8% |
| Indianapolis, IN | $135,153 | -3.5% | 8.1% |
| Jacksonville, FL | $165,000 | -7.2% | 11.3% |
| Las Vegas, NV | $200,000 | 0.0% | 8.1% |
| Little Rock, AR | $144,000 | 1.5% | 8.3% |
| Long Island, NY | $375,000 | 0.0% | 0.0% |
| Los Angeles, CA | $493,000 | -1.4% | 8.4% |
| Louisville, KY | $157,400 | -4.0% | 10.7% |
| Memphis, TN | $128,750 | -14.2% | -0.5% |
| Miami, FL | $240,000 | 0.0% | 10.1% |
| Minneapolis-St. Paul, MN | $214,900 | 0.0% | 13.1% |
| Nashville, TN | $238,200 | 3.6% | 13.5% |
| New Orleans, LA | $179,075 | -5.8% | 6.0% |
| North Port, FL | $230,000 | -1.1% | 16.2% |
| Oakland, CA | $560,000 | -3.3% | 14.9% |
| Omaha, NE | $157,000 | -3.1% | 5.4% |
| Orange County, CA | $598,900 | -1.0% | 8.9% |
| Orlando, FL | $182,250 | -3.6% | 14.6% |
| Philadelphia, PA | $220,000 | -2.2% | 3.3% |
| Phoenix, AZ | $214,000 | -2.5% | 8.6% |
| Portland, OR | $299,198 | -2.9% | 11.0% |
| Providence, RI | $192,250 | -6.2% | 6.9% |
| Raleigh-Durham, NC | $223,900 | -1.6% | 10.8% |
| Richmond, VA | $200,000 | -5.2% | 8.1% |
| Riverside-San Bernardino, CA | $295,000 | -3.9% | 7.7% |
| Rochester, NY | $119,900 | -6.3% | 1.7% |
| Sacramento, CA | $310,500 | -3.0% | 12.9% |
| San Antonio, TX | $184,900 | -5.6% | 3.6% |
| San Diego, CA | $475,000 | 1.1% | 6.0% |
| San Francisco, CA | $960,000 | -4.6% | 6.5% |
| San Jose, CA | $765,000 | -6.7% | 4.1% |
| Seattle, WA | $400,000 | 0.0% | 11.1% |
| St. Louis, MO | $150,500 | -4.7% | 8.3% |
| Tacoma, WA | $245,000 | -5.0% | 11.4% |
| Tampa, FL | $165,000 | -2.9% | 22.2% |
| Tucson, AZ | $173,250 | -3.2% | 6.0% |
| Tulsa, OK | $140,000 | -1.1% | 0.0% |
| Ventura County, CA | $535,000 | 3.9% | 9.3% |
| Washington, DC | $345,000 | -1.4% | 2.1% |
| West Palm Beach, FL | $220,000 | -6.0% | 10.5% |
| Wilmington, DE | $199,000 | -2.9% | 4.8% |
| National | $255,300 | -3.9% | 7.7% |
Homes Sold
| Redfin Metro | Homes Sold | Month-Over-Month | Year-Over-Year |
|---|---|---|---|
| Akron, OH | 501 | -33.7% | 11.8% |
| Albany, NY | 579 | -26.0% | 28.7% |
| Allentown, PA | 468 | -26.5% | 15.0% |
| Atlanta, GA | 5,341 | -34.1% | 7.9% |
| Austin, TX | 1,475 | -38.8% | -4.1% |
| Baltimore, MD | 2,111 | -32.2% | 11.8% |
| Boston, MA | 4,630 | -32.1% | 22.5% |
| Buffalo, NY | 703 | -28.0% | 13.4% |
| Charleston, SC | 866 | -31.6% | 7.6% |
| Charlotte, NC | 1,634 | -36.1% | -5.5% |
| Chicago, IL | 6,253 | -27.7% | 5.3% |
| Cincinnati, OH | 1,267 | -27.1% | 7.7% |
| Cleveland, OH | 1,492 | -28.7% | 14.9% |
| Columbus, OH | 1,296 | -32.6% | 6.1% |
| Dallas-Fort Worth, TX | 4,872 | -35.6% | 9.8% |
| Denver, CO | 2,797 | -35.7% | 12.1% |
| Detroit-Warren, MI | 4,107 | -21.8% | 8.2% |
| Fort Lauderdale, FL | 2,255 | -22.7% | -1.6% |
| Fresno, CA | 544 | -26.9% | 9.2% |
| Grand Rapids, MI | 663 | -27.0% | 12.4% |
| Greenville, SC | 478 | -30.9% | 7.9% |
| Hampton Roads, VA | 1,114 | -29.2% | 1.8% |
| Honolulu, HI | 538 | -26.3% | 3.3% |
| Houston, TX | 4,140 | -36.3% | 6.7% |
| Hudson Valley, NY | 867 | -27.7% | 13.8% |
| Indianapolis, IN | 1,431 | -36.6% | -1.4% |
| Jacksonville, FL | 1,329 | -30.0% | 2.8% |
| Las Vegas, NV | 2,323 | -28.1% | 4.2% |
| Little Rock, AR | 502 | -28.0% | 11.8% |
| Long Island, NY | 1,835 | -19.4% | 17.9% |
| Los Angeles, CA | 4,437 | -29.3% | 4.7% |
| Louisville, KY | 790 | -29.5% | 1.0% |
| Memphis, TN | 618 | -33.3% | -4.8% |
| Miami, FL | 2,272 | -6.7% | -10.7% |
| Minneapolis-St. Paul, MN | 2,758 | -28.7% | 19.0% |
| Nashville, TN | 1,910 | -30.5% | 21.8% |
| New Orleans, LA | 877 | -22.8% | 9.8% |
| North Port, FL | 1,229 | -22.6% | -5.0% |
| Oakland, CA | 1,652 | -30.4% | 6.4% |
| Omaha, NE | 622 | -32.2% | -0.6% |
| Orange County, CA | 1,821 | -24.9% | 8.1% |
| Orlando, FL | 2,465 | -28.1% | 0.3% |
| Philadelphia, PA | 2,836 | -27.4% | 14.1% |
| Phoenix, AZ | 4,969 | -22.5% | 9.3% |
| Portland, OR | 2,281 | -32.9% | 16.6% |
| Providence, RI | 639 | -33.7% | 0.9% |
| Raleigh-Durham, NC | 1,569 | -33.5% | 6.7% |
| Richmond, VA | 816 | -34.3% | 3.0% |
| Riverside-San Bernardino, CA | 3,392 | -24.0% | 4.1% |
| Rochester, NY | 614 | -35.5% | 5.5% |
| Sacramento, CA | 1,711 | -36.7% | 5.6% |
| San Antonio, TX | 1,409 | -34.6% | 1.2% |
| San Diego, CA | 1,974 | -35.2% | -0.2% |
| San Francisco, CA | 664 | -44.3% | -1.9% |
| San Jose, CA | 813 | -37.9% | -2.3% |
| Seattle, WA | 2,169 | -41.2% | -1.0% |
| St. Louis, MO | 1,713 | -29.0% | 22.0% |
| Tacoma, WA | 813 | -29.5% | 12.9% |
| Tampa, FL | 3,313 | -31.5% | 2.9% |
| Tucson, AZ | 899 | -24.6% | 20.2% |
| Tulsa, OK | 685 | -27.5% | 0.3% |
| Ventura County, CA | 482 | -31.3% | -0.8% |
| Washington, DC | 4,164 | -34.4% | 7.1% |
| West Palm Beach, FL | 1,909 | -29.7% | -7.8% |
| Wilmington, DE | 499 | -23.0% | 12.9% |
| National | 120,200 | -30.4% | 6.7% |
New Listings
| Redfin Metro | New Listings | Month-Over-Month | Year-Over-Year |
|---|---|---|---|
| Akron, OH | 900 | 42.6% | -7.1% |
| Albany, NY | 988 | 38.8% | -11.0% |
| Allentown, PA | 996 | 35.0% | -0.6% |
| Atlanta, GA | 7,851 | 46.9% | -6.0% |
| Austin, TX | 2,531 | 57.3% | 3.8% |
| Baltimore, MD | 3,189 | 18.0% | -10.6% |
| Boston, MA | 5,859 | 48.2% | 8.7% |
| Buffalo, NY | 971 | 22.3% | -9.9% |
| Charleston, SC | 1,589 | 51.8% | 3.7% |
| Chicago, IL | 13,140 | 74.7% | -0.6% |
| Cincinnati, OH | 2,326 | 53.2% | -3.8% |
| Cleveland, OH | 2,527 | 39.5% | -1.7% |
| Columbus, OH | 1,921 | 50.8% | -0.7% |
| Dallas-Fort Worth, TX | 8,146 | 48.0% | 8.4% |
| Denver, CO | 3,655 | 71.5% | 1.9% |
| Detroit-Warren, MI | 7,174 | 32.4% | -3.4% |
| Fort Lauderdale, FL | 2,451 | 77.2% | 75.1% |
| Fresno, CA | 883 | 57.7% | -9.7% |
| Grand Rapids, MI | 874 | 31.4% | -13.1% |
| Greenville, SC | 772 | 24.3% | -14.9% |
| Hampton Roads, VA | 2,839 | 58.1% | -1.6% |
| Honolulu, HI | 983 | 39.2% | -7.9% |
| Houston, TX | 9,445 | 56.0% | 14.2% |
| Hudson Valley, NY | 1,585 | 101.1% | 7.7% |
| Indianapolis, IN | 2,526 | 25.3% | -9.4% |
| Jacksonville, FL | 2,591 | 45.9% | -2.3% |
| Las Vegas, NV | 4,559 | 54.8% | 4.3% |
| Little Rock, AR | 1,235 | 53.8% | -10.1% |
| Long Island, NY | 3,368 | 76.2% | 3.9% |
| Los Angeles, CA | 8,586 | 71.6% | 3.4% |
| Louisville, KY | 1,280 | 42.9% | -12.3% |
| Memphis, TN | 1,160 | 19.8% | -11.6% |
| Miami, FL | 4,937 | 82.2% | 118.8% |
| Minneapolis-St. Paul, MN | 4,062 | 61.0% | -7.6% |
| Nashville, TN | 3,293 | 28.2% | -4.8% |
| New Orleans, LA | 1,624 | 41.0% | -0.1% |
| North Port, FL | 2,809 | 51.9% | 3.1% |
| Oakland, CA | 1,931 | 73.0% | -10.1% |
| Omaha, NE | 1,112 | 56.4% | -9.9% |
| Orange County, CA | 3,326 | 84.4% | 6.1% |
| Orlando, FL | 4,388 | 36.2% | -8.9% |
| Philadelphia, PA | 4,642 | 36.9% | -9.8% |
| Phoenix, AZ | 10,124 | 74.8% | 1.0% |
| Portland, OR | 3,103 | 66.6% | -9.8% |
| Providence, RI | 1,162 | 34.2% | -3.0% |
| Raleigh-Durham, NC | 2,390 | 57.9% | -10.2% |
| Richmond, VA | 1,733 | 75.4% | -6.8% |
| Riverside-San Bernardino, CA | 7,474 | 59.9% | 12.5% |
| Rochester, NY | 1,286 | 51.3% | 0.8% |
| San Antonio, TX | 2,781 | 43.3% | 20.5% |
| San Diego, CA | 3,957 | 77.4% | -5.7% |
| San Francisco, CA | 997 | 120.6% | -10.0% |
| San Jose, CA | 1,057 | 75.3% | -3.3% |
| Seattle, WA | 3,277 | 73.8% | -5.6% |
| St. Louis, MO | 3,021 | 37.6% | -10.9% |
| Tacoma, WA | 1,079 | 59.1% | -8.9% |
| Tampa, FL | 6,241 | 39.6% | -0.1% |
| Tucson, AZ | 2,111 | 75.0% | 1.5% |
| Tulsa, OK | 1,444 | 31.9% | -9.7% |
| Ventura County, CA | 861 | 73.6% | -11.9% |
| Washington, DC | 6,039 | 28.7% | -10.9% |
| West Palm Beach, FL | 4,631 | 50.7% | -0.7% |
| Wilmington, DE | 855 | 44.7% | 3.1% |
| National | 206,600 | 53.3% | 0.5% |
All Homes for Sale
| Redfin Metro | All Homes for Sale | Month-Over-Month | Year-Over-Year |
|---|---|---|---|
| Akron, OH | 3,091 | 0.7% | -10.0% |
| Albany, NY | 4,191 | -8.2% | -9.1% |
| Allentown, PA | 4,452 | 1.6% | 0.7% |
| Atlanta, GA | 19,950 | -6.0% | -10.7% |
| Austin, TX | 4,801 | -4.9% | -2.5% |
| Baltimore, MD | 11,020 | -7.1% | -9.6% |
| Boston, MA | 15,585 | -6.0% | -12.3% |
| Buffalo, NY | 5,189 | -3.5% | -23.0% |
| Charleston, SC | 5,815 | 3.9% | -17.4% |
| Chicago, IL | 38,666 | 6.1% | 3.5% |
| Cincinnati, OH | 8,643 | 2.0% | -6.1% |
| Cleveland, OH | 9,827 | -0.2% | -6.9% |
| Columbus, OH | 5,853 | 12.4% | 1.1% |
| Dallas-Fort Worth, TX | 13,698 | -1.6% | -0.5% |
| Denver, CO | 5,554 | 11.6% | 30.7% |
| Detroit-Warren, MI | 16,361 | -30.5% | -9.7% |
| Fresno, CA | 1,867 | -6.0% | -10.0% |
| Grand Rapids, MI | 2,185 | -12.0% | -50.3% |
| Greenville, SC | 2,935 | 7.7% | -0.3% |
| Hampton Roads, VA | 8,440 | 3.6% | -6.0% |
| Honolulu, HI | 3,191 | 7.7% | -4.1% |
| Houston, TX | 21,534 | 0.0% | 27.4% |
| Hudson Valley, NY | 7,701 | 10.5% | 25.1% |
| Indianapolis, IN | 8,410 | -3.2% | -24.4% |
| Jacksonville, FL | 7,172 | 1.6% | -16.5% |
| Las Vegas, NV | 13,937 | 4.0% | -3.5% |
| Little Rock, AR | 4,150 | 4.0% | -5.6% |
| Long Island, NY | 12,817 | -1.6% | -9.3% |
| Los Angeles, CA | 14,722 | 17.0% | -1.8% |
| Louisville, KY | 3,287 | -7.3% | -40.1% |
| Memphis, TN | 4,004 | -1.6% | -9.4% |
| Miami, FL | 9,987 | 39.6% | 48.6% |
| Minneapolis-St. Paul, MN | 10,066 | -2.1% | -18.1% |
| Nashville, TN | 7,667 | -0.1% | -12.2% |
| North Port, FL | 7,426 | 15.5% | 4.3% |
| Oakland, CA | 1,968 | 7.7% | -21.5% |
| Omaha, NE | 2,193 | -5.6% | -16.0% |
| Orange County, CA | 6,164 | 21.6% | 13.4% |
| Orlando, FL | 11,851 | -0.1% | -15.8% |
| Philadelphia, PA | 17,568 | -4.2% | -10.9% |
| Phoenix, AZ | 22,826 | 16.5% | -1.1% |
| Portland, OR | 4,176 | -11.4% | -37.2% |
| Providence, RI | 3,851 | -3.7% | -3.3% |
| Raleigh-Durham, NC | 7,286 | 9.5% | 1.8% |
| Richmond, VA | 3,968 | -2.6% | -16.9% |
| Riverside-San Bernardino, CA | 17,259 | 12.0% | 12.0% |
| San Antonio, TX | 7,117 | 1.6% | 12.2% |
| San Diego, CA | 5,721 | 0.5% | -18.9% |
| San Francisco, CA | 1,437 | 20.3% | -9.4% |
| San Jose, CA | 1,541 | 12.6% | -24.9% |
| Seattle, WA | 3,622 | -5.8% | -39.0% |
| St. Louis, MO | 8,733 | -4.9% | -18.8% |
| Tacoma, WA | 2,037 | -11.8% | -35.9% |
| Tampa, FL | 15,785 | 5.2% | -12.3% |
| Tucson, AZ | 5,624 | 17.1% | 1.6% |
| Tulsa, OK | 5,673 | 7.1% | 12.2% |
| Ventura County, CA | 1,456 | 3.6% | -13.7% |
| Washington, DC | 15,289 | -7.4% | -5.8% |
| West Palm Beach, FL | 13,418 | 14.0% | 5.4% |
| Wilmington, DE | 3,386 | -4.0% | -5.9% |
| National | 514,100 | 1.3% | -5.6% |
Methodology: Redfin’s National Market Tracker follows housing trends in the country’s largest metropolitan areas (those with population 500,000 or greater) served by Redfin agents. Analysis by Redfin is based on all residential home sales transacted on the multiple-listing service and supplemented by county recorder data where available. Data may be subject to revision. Metropolitan divisions are based the latest definitions released by the Bureau of Labor Statistics. To view a breakdown of these regions, click here.
For more information, contact Redfin journalist services
Phone: 206-588-6863
Email: press@redfin.com
To be added to Redfin’s press release distribution list, subscribe here.


