
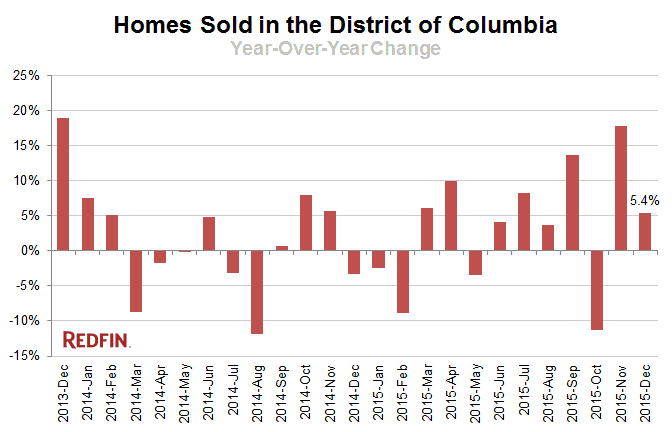
Washington, D.C. home prices fell 0.9 percent in December from a year earlier, to a median $500,500, the first decline in more than a year. Despite buyers and sellers temporarily stepping away from the market during the holiday season, sales were up 5.4 percent.
The supply of homes for sale was down more than 7 percent compared to last year, leaving the District with just 1.7 months of supply, far below the six months that signals a balanced market. The typical home sold in 16 days last month, compared to 12 days in November.
“Listings can linger on the market over the holidays, so a lot of sellers take down their for-sale signs and relist in January,” Redfin real estate agent Dan Galloway said. “We’re just a few weeks into January and the market is already picking up. I suspect we’ll have another busy spring.”
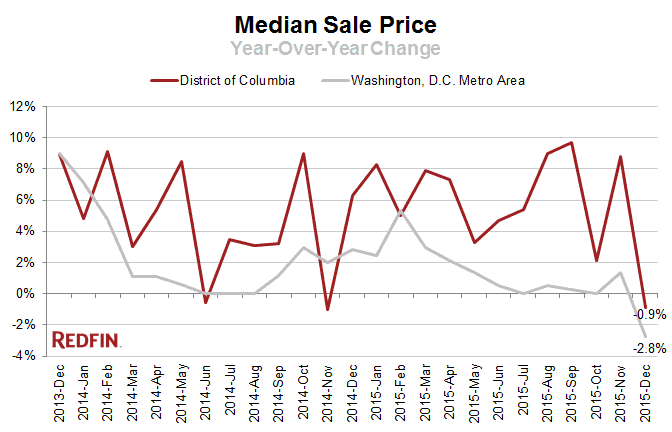
Across the broader D.C, Maryland and Virginia region, the median sale price fell for the first time in 2015, dropping 2.8 percent from a year earlier to $350,000. The price drop was one exception to the national trend, which showed home prices up 8.8 percent nationally.
Sales were up 10.3 percent in the D.C. metro market. The number of homes for sale was down 3 percent, leaving the metro area with 2.6 months of supply. The typical home spent 37 days on the market.
Hot Neighborhoods
Takoma ended the year on a high note. The median sale price was up almost 119 percent to $765,000 and sales surged more than 64 percent compared to last year.
Boosted by new development, Navy Yard and the Southwest Waterfront saw price gains of 39.3 percent and 17 percent respectively. Navy Yard and Mount Pleasant shared honors for the fastest-moving neighborhood, with the typical home under contract in just seven days.
Sale prices fell 27.2 percent in Historic Anacostia and 13.7 percent in Congress Heights, but both neighborhoods saw sales jump more than 60 percent compared to 2014. Agents report the area is teeming with developers and investors seeking bargains with the expectation that prices will grow this year.
See our city page for the most up-to-date data on Washington-area home prices.
Here’s what’s happening in your neighborhood:
| Neighborhood | Median Sale Price | Year-Over-Year | Homes Sold | Year-Over-Year | Inventory | Year-Over-Year | New Listings | Median Days on Market | Avg Sale-to-List |
|---|---|---|---|---|---|---|---|---|---|
| Adams Morgan / Kalorama Heights / Lanier Heights | $517,000 | -1.7% | 101 | 8.6% | 73 | 10.6% | 100 | 9 | 99.4% |
| American University Park / Friendship Heights / Tenleytown | $1,023,000 | 11.2% | 52 | 20.9% | 16 | -36.0% | 33 | 8 | 99.9% |
| Atlas District | $720,000 | 10.3% | 44 | -32.3% | 41 | 41.4% | 52 | 8 | 100.7% |
| Bellevue / Congress Heights / Washington Highlands | $215,500 | 6.9% | 40 | 48.1% | 61 | -7.6% | 65 | 32 | 102.5% |
| Benning Heights / Capitol View / Marshall Heights | $260,500 | 18.4% | 39 | 18.2% | 49 | -44.3% | 48 | 28 | 97.9% |
| Bloomingdale | $752,000 | 12.2% | 32 | 0.0% | 29 | 11.5% | 53 | 8 | 100.3% |
| Capitol Hill | $794,500 | 8.1% | 103 | 1.0% | 57 | 14.0% | 90 | 8 | 99.5% |
| Chevy Chase-DC | $928,000 | 9.4% | 57 | 11.8% | 43 | 16.2% | 43 | 12 | 97.2% |
| Chinatown / Mount Vernon Square / Penn Quarters | $499,500 | 1.5% | 84 | -10.6% | 63 | -8.7% | 75 | 18 | 96.9% |
| Cleveland Park | $462,450 | 4.5% | 36 | 38.5% | 18 | 38.5% | 32 | 10 | 100.1% |
| Columbia Heights | $544,000 | 7.2% | 99 | 26.9% | 84 | 33.3% | 113 | 11 | 99.2% |
| Congress Heights | $220,000 | -13.7% | 21 | 61.5% | 32 | 10.3% | 30 | 32 | 99.6% |
| Deanwood | $200,000 | -1.7% | 27 | 42.1% | 27 | -15.6% | 32 | 29 | 93.7% |
| Dupont Circle | $434,325 | 9.4% | 88 | -12.9% | 58 | -4.9% | 84 | 14 | 100.0% |
| Eckington | $600,000 | 36.4% | 18 | -14.3% | 22 | 120.0% | 20 | 13 | 97.7% |
| Edgewood | $530,000 | -10.2% | 13 | -35.0% | 17 | 41.7% | 26 | 8 | 99.4% |
| Fairlawn / Twining / Randle Highlands / Penn Branch | $285,000 | -2.4% | 33 | 6.5% | 40 | 2.6% | 39 | 34 | 101.1% |
| Foggy Bottom / George Washington University / West End | $439,000 | -12.0% | 72 | 18.0% | 50 | -21.9% | 52 | 25 | 96.6% |
| Fort Totten / Lamont Riggs / Pleasant Hill / Queens Chapel | $385,500 | 10.8% | 30 | -3.2% | 29 | -21.6% | 36 | 21 | 99.7% |
| Foxhall / Palisades / Spring Valley / Wesley Heights | $1,269,750 | 4.5% | 48 | 17.1% | 71 | 22.4% | 55 | 24 | 95.1% |
| Georgetown | $1,312,500 | 16.2% | 46 | -22.0% | 63 | 14.5% | 61 | 15 | 95.6% |
| Glover Park / Cathedral Heights / McLean Gardens | $442,000 | -5.9% | 106 | 5.0% | 94 | 2.2% | 107 | 12 | 98.3% |
| Greenway / Benning / Dupont Park / River Terrace | $220,000 | 8.1% | 17 | -15.0% | 16 | -40.7% | 18 | 33 | 95.1% |
| Hill East | $692,500 | 8.4% | 64 | 16.4% | 27 | -34.1% | 55 | 8 | 99.7% |
| Historic Anacostia | $191,000 | -27.2% | 20 | 66.7% | 22 | 46.7% | 28 | 9 | 100.1% |
| Howard University / Le Droit Park | $688,000 | 17.1% | 60 | 13.2% | 30 | -6.3% | 48 | 8 | 99.2% |
| Kingman Park | $485,000 | 2.6% | 34 | 13.3% | 38 | 22.6% | 52 | 13 | 99.2% |
| Logan Circle-Shaw | $605,000 | 11.5% | 167 | -20.1% | 85 | -8.6% | 150 | 10 | 99.7% |
| Logan Circle-Shaw | $698,750 | 9.7% | 32 | -11.1% | 15 | 15.4% | 34 | 8 | 100.4% |
| Massachusetts Avenue Heights | $834,500 | 77.6% | 25 | -35.9% | 30 | 0.0% | 37 | 14 | 97.7% |
| Mount Pleasant | $890,000 | 10.3% | 23 | 4.5% | 14 | 100.0% | 23 | 7 | 102.5% |
| Navy Yard | $632,545 | 39.3% | 13 | 30.0% | 2 | 0.0% | 9 | 7 | 100.4% |
| NoMa | $710,000 | 6.0% | 20 | -42.9% | 21 | 133.3% | 20 | 14 | 99.7% |
| Petworth | $645,000 | 7.5% | 59 | -18.1% | 42 | -14.3% | 71 | 15 | 98.1% |
| Pleasant Plains | $597,500 | 17.7% | 27 | -15.6% | 19 | -9.5% | 31 | 8 | 101.5% |
| Southwest / Waterfront | $335,750 | 17.0% | 46 | -27.0% | 38 | 18.8% | 49 | 8 | 99.3% |
| Stanton Park | $700,000 | 13.8% | 81 | -13.8% | 62 | 26.5% | 102 | 8 | 100.2% |
| Takoma | $765,000 | 118.6% | 23 | 64.3% | 16 | 60.0% | 25 | 18 | 99.1% |
| Trinidad / Arboretum / Ivy City | $400,000 | -8.0% | 57 | 35.7% | 63 | 16.7% | 76 | 12 | 100.4% |
| Truxton Circle | $638,000 | 3.7% | 14 | -17.6% | 18 | 0.0% | 20 | 25 | 100.5% |
| Union Station / Kingman Park / Stanton Park | $649,000 | 6.7% | 117 | -16.4% | 101 | 36.5% | 140 | 9 | 100.0% |
| Van Ness / Forest Hills / Wakefield | $480,000 | 17.5% | 33 | -21.4% | 27 | 3.8% | 30 | 16 | 96.2% |
| Woodley Park | $522,500 | -4.7% | 17 | 6.3% | 8 | -20.0% | 8 | 8 | 96.2% |
| Washington, DC | $500,500 | -0.9% | 739 | 5.4% | 1,241 | -7.1% | 502 | 16 | 98.7% |
NOTE: Not all neighborhoods are listed, but totals for Washington, D.C., encompass entire city. Data is based on listing information and might not reflect all real estate activity in the market. Neighborhood-specific data is measured over the three months ended Dec. 31. Inventory measures listings active as of Dec. 31.
For more information, contact Redfin journalist services
Phone: 206-588-6863
Email: press@redfin.com
To be added to Redfin’s press release distribution list, please click here.


