
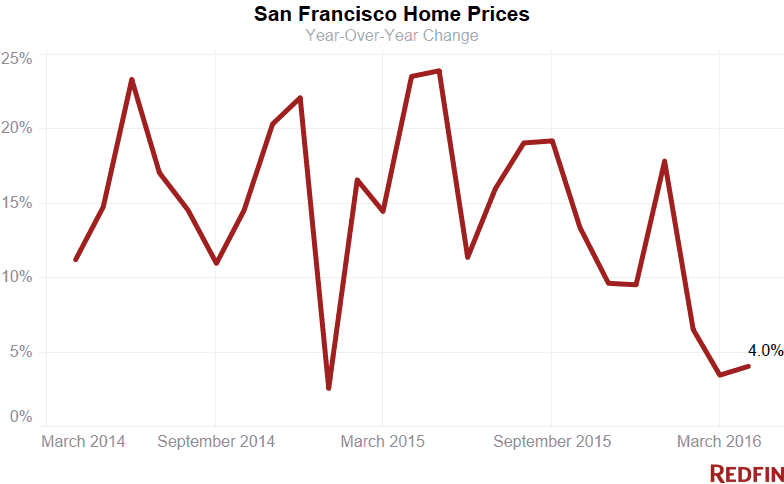
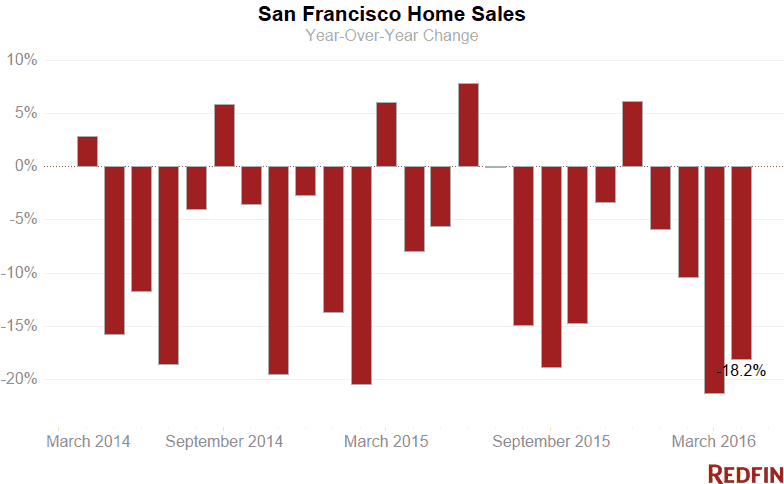
San Francisco city home prices rose 4 percent in April from a year earlier to a median $1.3 million. Sales fell more than 18 percent, the fourth-straight month of declines.
In good news for buyers, the supply of homes for sale jumped more than 50 percent, the biggest advance in more than five years, and more sellers entered the market. The number of new for-sale signs was 7.7 percent higher last month than in April 2015.
The supply of homes for sale in the city has been increasing at a rapid clip all year, but the growing inventory hasn’t been enough to seriously hamper price growth or meet buyer demand. In April, there was less than a two-month supply of properties on the market, well below the six months that signals a balance between buyers and sellers.
That’s one reason nearly 70 percent of homebuyers paid more than sellers were asking in April.
“While this dramatic increase in inventory isn’t halting price growth, we have noticed that the type of property matters,” Redfin agent Mark Colwell said. “The backlog of buyers for single-family homes means that demand isn’t likely to slow down anytime soon, even with the number of homes on the market increasing as much as it has. However, we’re starting to notice that condo prices are beginning to flatten.”
Condo prices were up just 2.6 percent while inventory jumped 73.3 percent last month from April 2015.
Bay Area
Across the greater Bay Area, the median sale price rose 6.2 percent year over year to $1.2 million after slowing in March. Sales plunged for the second month, falling 24.3 percent compared to a year earlier.
Hot Neighborhoods
Pacific Heights maintained its position as the city’s most expensive community, with a median sale price of $2.1 million. Close behind was Forest Hill at just more than $2 million. Noe Valley ($1.83 million), Russian Hill ($1.715 million) and Inner Sunset ($1.655 million) rounded out the top five.
The Tenderloin, the city’s most-affordable neighborhood, recorded three sales in the past three months, only one of which went for more than the seller was asking. That pushed the median price down more than 28 percent, to $485,000. It was the only place in the city where a typical home could be had for less than half a million dollars.
Across most of the city, buyers paid more than sellers were asking. The average home went for less than list price only in the Tenderloin, Rincon Hill and Colma.
See our city page for the most up-to-date data on San Francisco home prices.
Here’s what’s happening in your neighborhood:
| Place | Median Sale Price | Year-Over-Year | Homes Sold | Year-Over-Year | Inventory | Year-Over-Year | New Listings | Median Days on Market | Avg Sale-to-List |
|---|---|---|---|---|---|---|---|---|---|
| Ashbury Heights | 1350000 | -0.244 | 9 | -0.357 | 6 | 0.5 | 14 | 14 | 1.079 |
| Bayview | 770000 | 0.085 | 17 | -0.575 | 16 | -0.333 | 32 | 17 | 1.074 |
| Bernal Heights | 1345000 | 0.034 | 36 | -0.41 | 28 | 0.647 | 65 | 15 | 1.159 |
| Castro | 1201000 | 0.25 | 1 | -0.5 | 1 | NA | 3 | 9 | 1.094 |
| Civic Center / Van Ness | 845000 | -0.05 | 27 | 0.35 | 18 | 0.8 | 44 | 14 | 1.052 |
| Colma | 770000 | NA | 1 | NA | 1 | NA | NA | 27 | 0.975 |
| Crocker Amazon | 715000 | -0.144 | 9 | -0.1 | 10 | 0.429 | 17 | 23 | 1.035 |
| Daly City | 831500 | 0.279 | 30 | -0.348 | 69 | 0.568 | 54 | 20 | 1.075 |
| Excelsior | 940000 | 0.213 | 13 | -0.435 | 9 | -0.1 | 27 | 15 | 1.141 |
| Financial District | 1049000 | -0.462 | 3 | -0.667 | 4 | 0.333 | 5 | 49 | 1.013 |
| Forest Hill | 2012500 | 0.311 | 4 | -0.333 | 1 | -0.75 | 6 | 26 | 1.088 |
| Haight Ashbury | 1321250 | 0.096 | 6 | -0.4 | 5 | -0.444 | 12 | 20 | 1.029 |
| Hayes Valley | 1400000 | 0.077 | 5 | -0.444 | 6 | 5 | 16 | 13 | 1.156 |
| Ingleside | 795000 | -0.055 | 4 | -0.429 | 5 | 1.5 | 8 | 57 | 1.006 |
| Inner Richmond | 1600000 | -0.086 | 23 | -0.08 | 4 | -0.733 | 27 | 14 | 1.112 |
| Inner Sunset | 1655000 | 0.324 | 26 | 0.529 | 14 | 0.4 | 35 | 16 | 1.111 |
| Lower Haight | 1225000 | 0.04 | 13 | -0.409 | 4 | -0.333 | 14 | 14 | 1.071 |
| Merced Heights | 638500 | 0.051 | 13 | 0.083 | 7 | 0.4 | 20 | 14 | 1.152 |
| Miraloma Park | 1390000 | 0.112 | 24 | -0.314 | 24 | 1.4 | 44 | 13 | 1.151 |
| Mission | 1207500 | 0.232 | 48 | -0.448 | 29 | 0 | 52 | 31 | 1.061 |
| Mission Bay | 1330000 | 0.009 | 42 | 0.4 | 21 | 9.5 | 64 | 19 | 1.008 |
| Nob Hill | 935000 | -0.422 | 16 | -0.333 | 16 | 0.455 | 28 | 19 | 1.02 |
| Noe Valley | 1830000 | 0.109 | 58 | -0.205 | 31 | 0.348 | 84 | 15 | 1.098 |
| Outer Mission | 982000 | 0.183 | 3 | -0.727 | 11 | 1.2 | 12 | 14 | 1.218 |
| Outer Richmond | 1528000 | 0.284 | 15 | -0.286 | 13 | 0.3 | 34 | 18 | 1.202 |
| Outer Sunset | 1075000 | 0.126 | 37 | 0.233 | 17 | 0.214 | 50 | 14 | 1.207 |
| Pacific Heights | 901500 | 0.015 | 6 | -0.143 | 1 | -0.667 | 4 | 33 | 1.032 |
| Pacific Heights | 2100000 | -0.129 | 35 | -0.286 | 41 | 1.05 | 82 | 12 | 1.077 |
| Parkside | 1168000 | 0.068 | 25 | 0.389 | 11 | -0.154 | 32 | 16 | 1.147 |
| Portola | 834000 | 0.112 | 16 | 0.231 | 3 | -0.5 | 15 | 20 | 1.095 |
| Potrero Hill | 1160000 | -0.171 | 49 | 0.4 | 28 | 0.867 | 61 | 16 | 1.086 |
| Rincon Hill | 1120000 | -0.128 | 28 | -0.176 | 34 | 2.778 | 54 | 15 | 0.998 |
| Russian Hill | 1715000 | 0.429 | 24 | 0.043 | 19 | 1.714 | 46 | 13 | 1.056 |
| South of Market | 995000 | 0.015 | 72 | -0.143 | 67 | 0.914 | 121 | 17 | 1.026 |
| South San Francisco | 840000 | 0.104 | 37 | -0.098 | 51 | 0.378 | 41 | 15 | 1.089 |
| Sunnyside | 1210000 | 0.201 | 23 | 0.278 | 11 | 2.667 | 29 | 13 | 1.187 |
| Sunset District | 1258000 | 0.128 | 121 | 0.1 | 64 | 0.255 | 178 | 14 | 1.178 |
| Telegraph Hill | 949000 | -0.269 | 11 | -0.312 | 7 | 0 | 22 | 13 | 1.046 |
| Tenderloin | 485000 | -0.284 | 3 | -0.25 | 4 | 3 | 9 | 15 | 0.998 |
| Twin Peaks | 1475000 | 0.425 | 7 | -0.364 | 3 | 0.5 | 5 | 15 | 1.045 |
| Visitacion Valley | 765000 | 0.048 | 10 | -0.474 | 7 | -0.462 | 12 | 27 | 1.014 |
| Western Addition | 1200000 | 0.371 | 15 | 0.154 | 11 | 1.75 | 22 | 27 | 1.044 |
| San Francisco, CA | 1300444 | 0.04 | 432 | -0.182 | 816 | 0.503 | 688 | 16 | 1.092 |
NOTE: Not all neighborhoods are listed, but totals for San Francisco encompass entire city. Data is based on listing information and might not reflect all real estate activity in the market. Neighborhood-specific data is measured over a three-month span that ended April 30. Inventory measures listings active as of April 30.
For more information, contact Redfin journalist services
Phone: 206-588-6863
Email: press@redfin.com
See Redfin’s data center to find out what’s happening in other cities.
To be added to Redfin’s press release distribution list, subscribe here.


