
Today we’re launching Opportunity Score. Built in partnership with the White House Opportunity Project, Opportunity Score is an online tool that helps Americans find homes within a 30-minute car-free commute to nearby jobs. Opportunity Score assigns an address a rating, from zero to 100, that represents how easy it is to get to nearby jobs without a car. Scores also consider the local population to reflect the fact that places with more people likely have more competition for local jobs. The tool is available right now for millions of addresses in more than 350 U.S. cities.
The Tool
To show you why we’re excited about Opportunity Score and how it will be useful to Americans, imagine a family living in the East Bay of San Francisco. They don’t have a car. Mom has a job downtown with a two-hour commute. Dad got laid off last Friday, and now he’s looking for work and a more affordable home. He can use Opportunity Score to find a place to live that’s within a short, car-free commute from his wife’s job downtown and from other job centers where he might find employment.
Here’s what they see when comparing a downtown San Francisco address with one in Daly City:
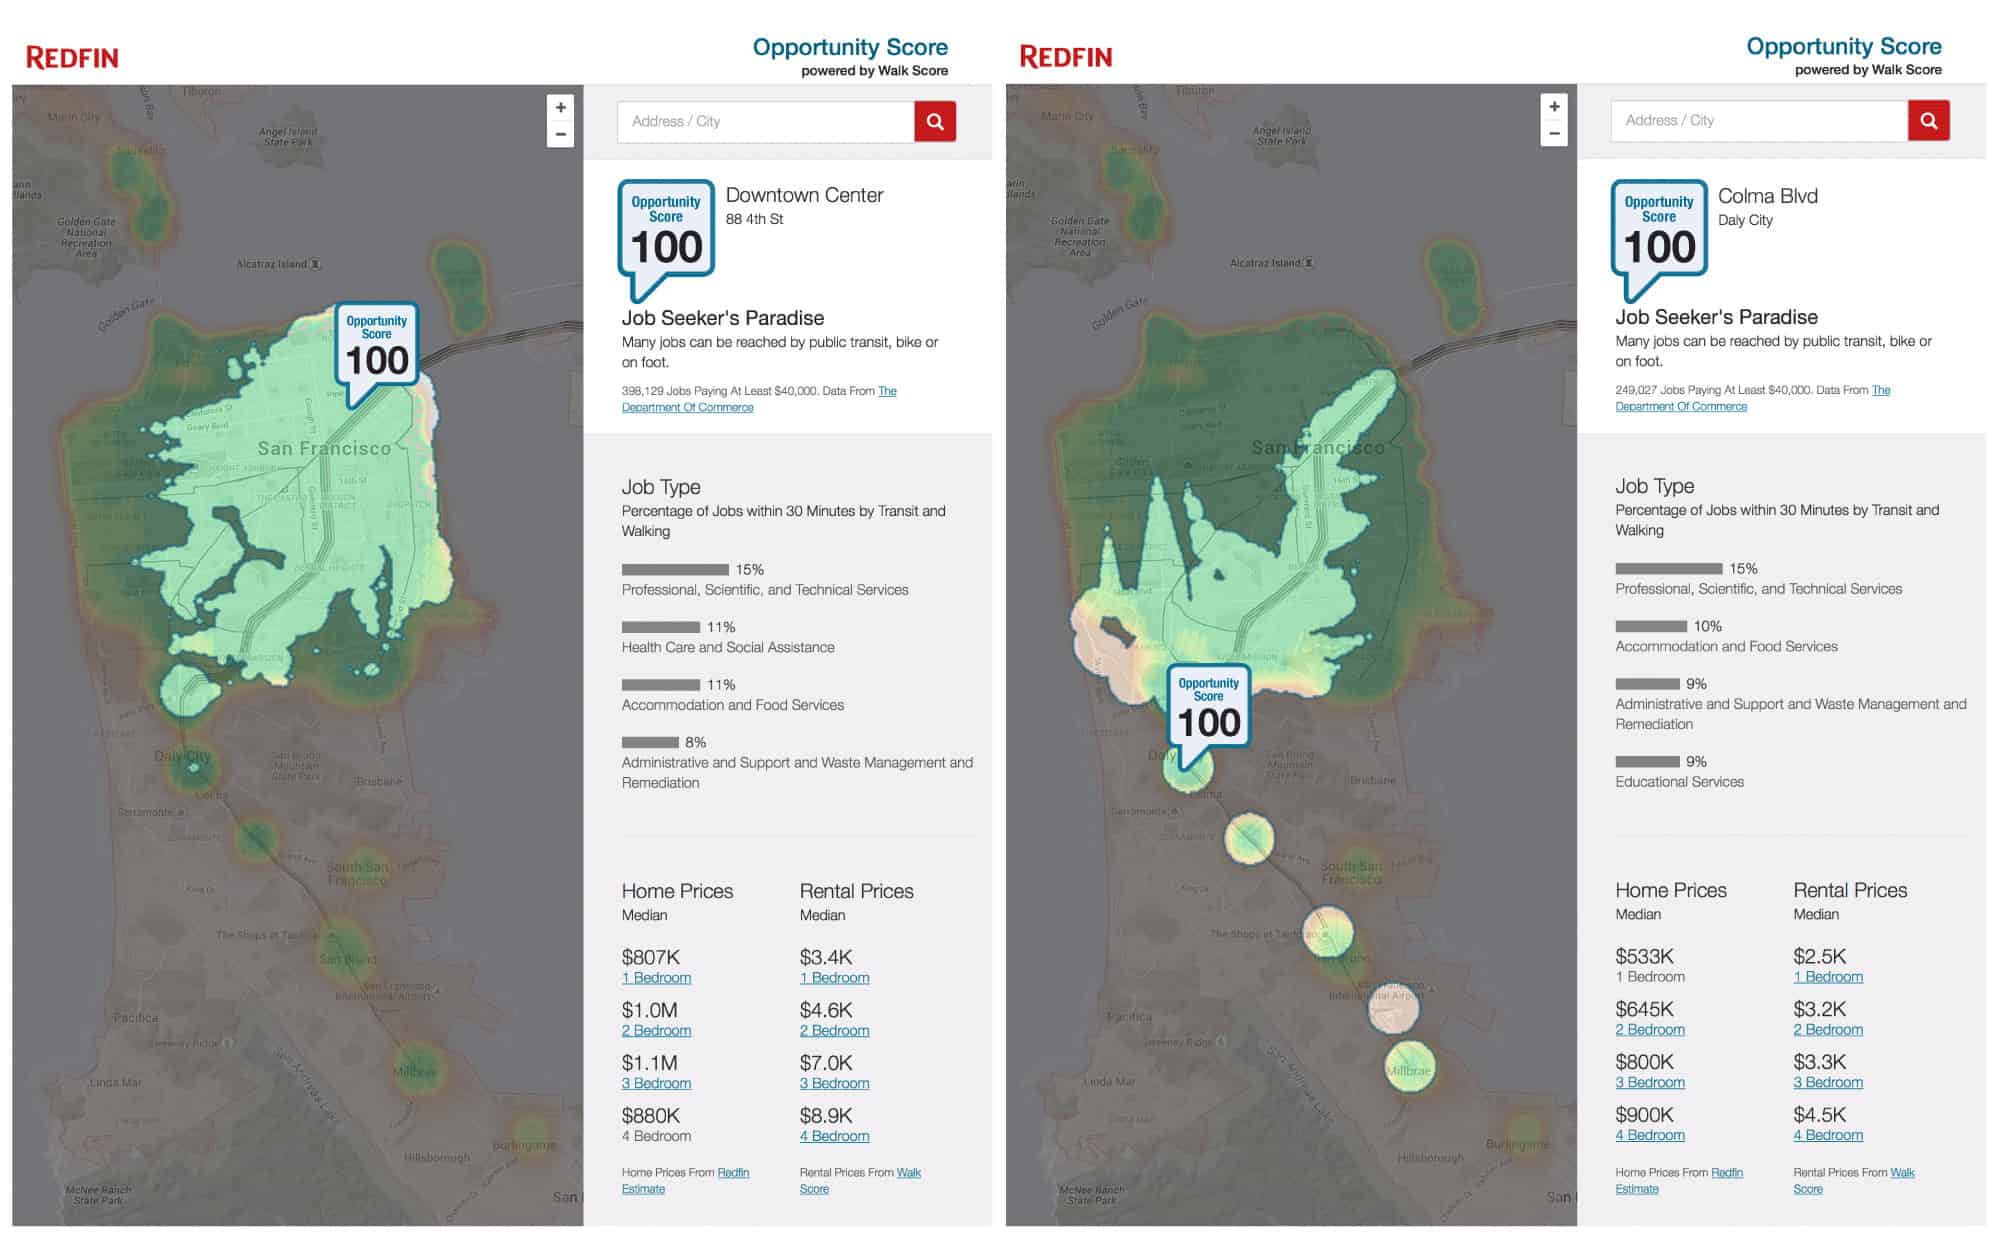
Both addresses have an Opportunity Score of 100. That means there are a lot of jobs paying at least $40,000 that are accessible in 30 minutes without a car, even when adjusting for all the competing workers in the greater area.
But what about home prices? The right half of the Opportunity Score page summarizes prices of homes for sale and for rent near an address. In this example, two-bedroom homes near the downtown San Francisco address are selling for around $1 million and two-bedroom rentals are about $4,600 a month. Rental prices near the Daly City BART station are still high, but two-bedroom homes are listed for around $645,000. That’s a whopping 35 percent savings, and the employment access is still plentiful. The family can use the tool to weigh the factors that are most important for them and their lifestyle—transit access, job opportunity and affordability.
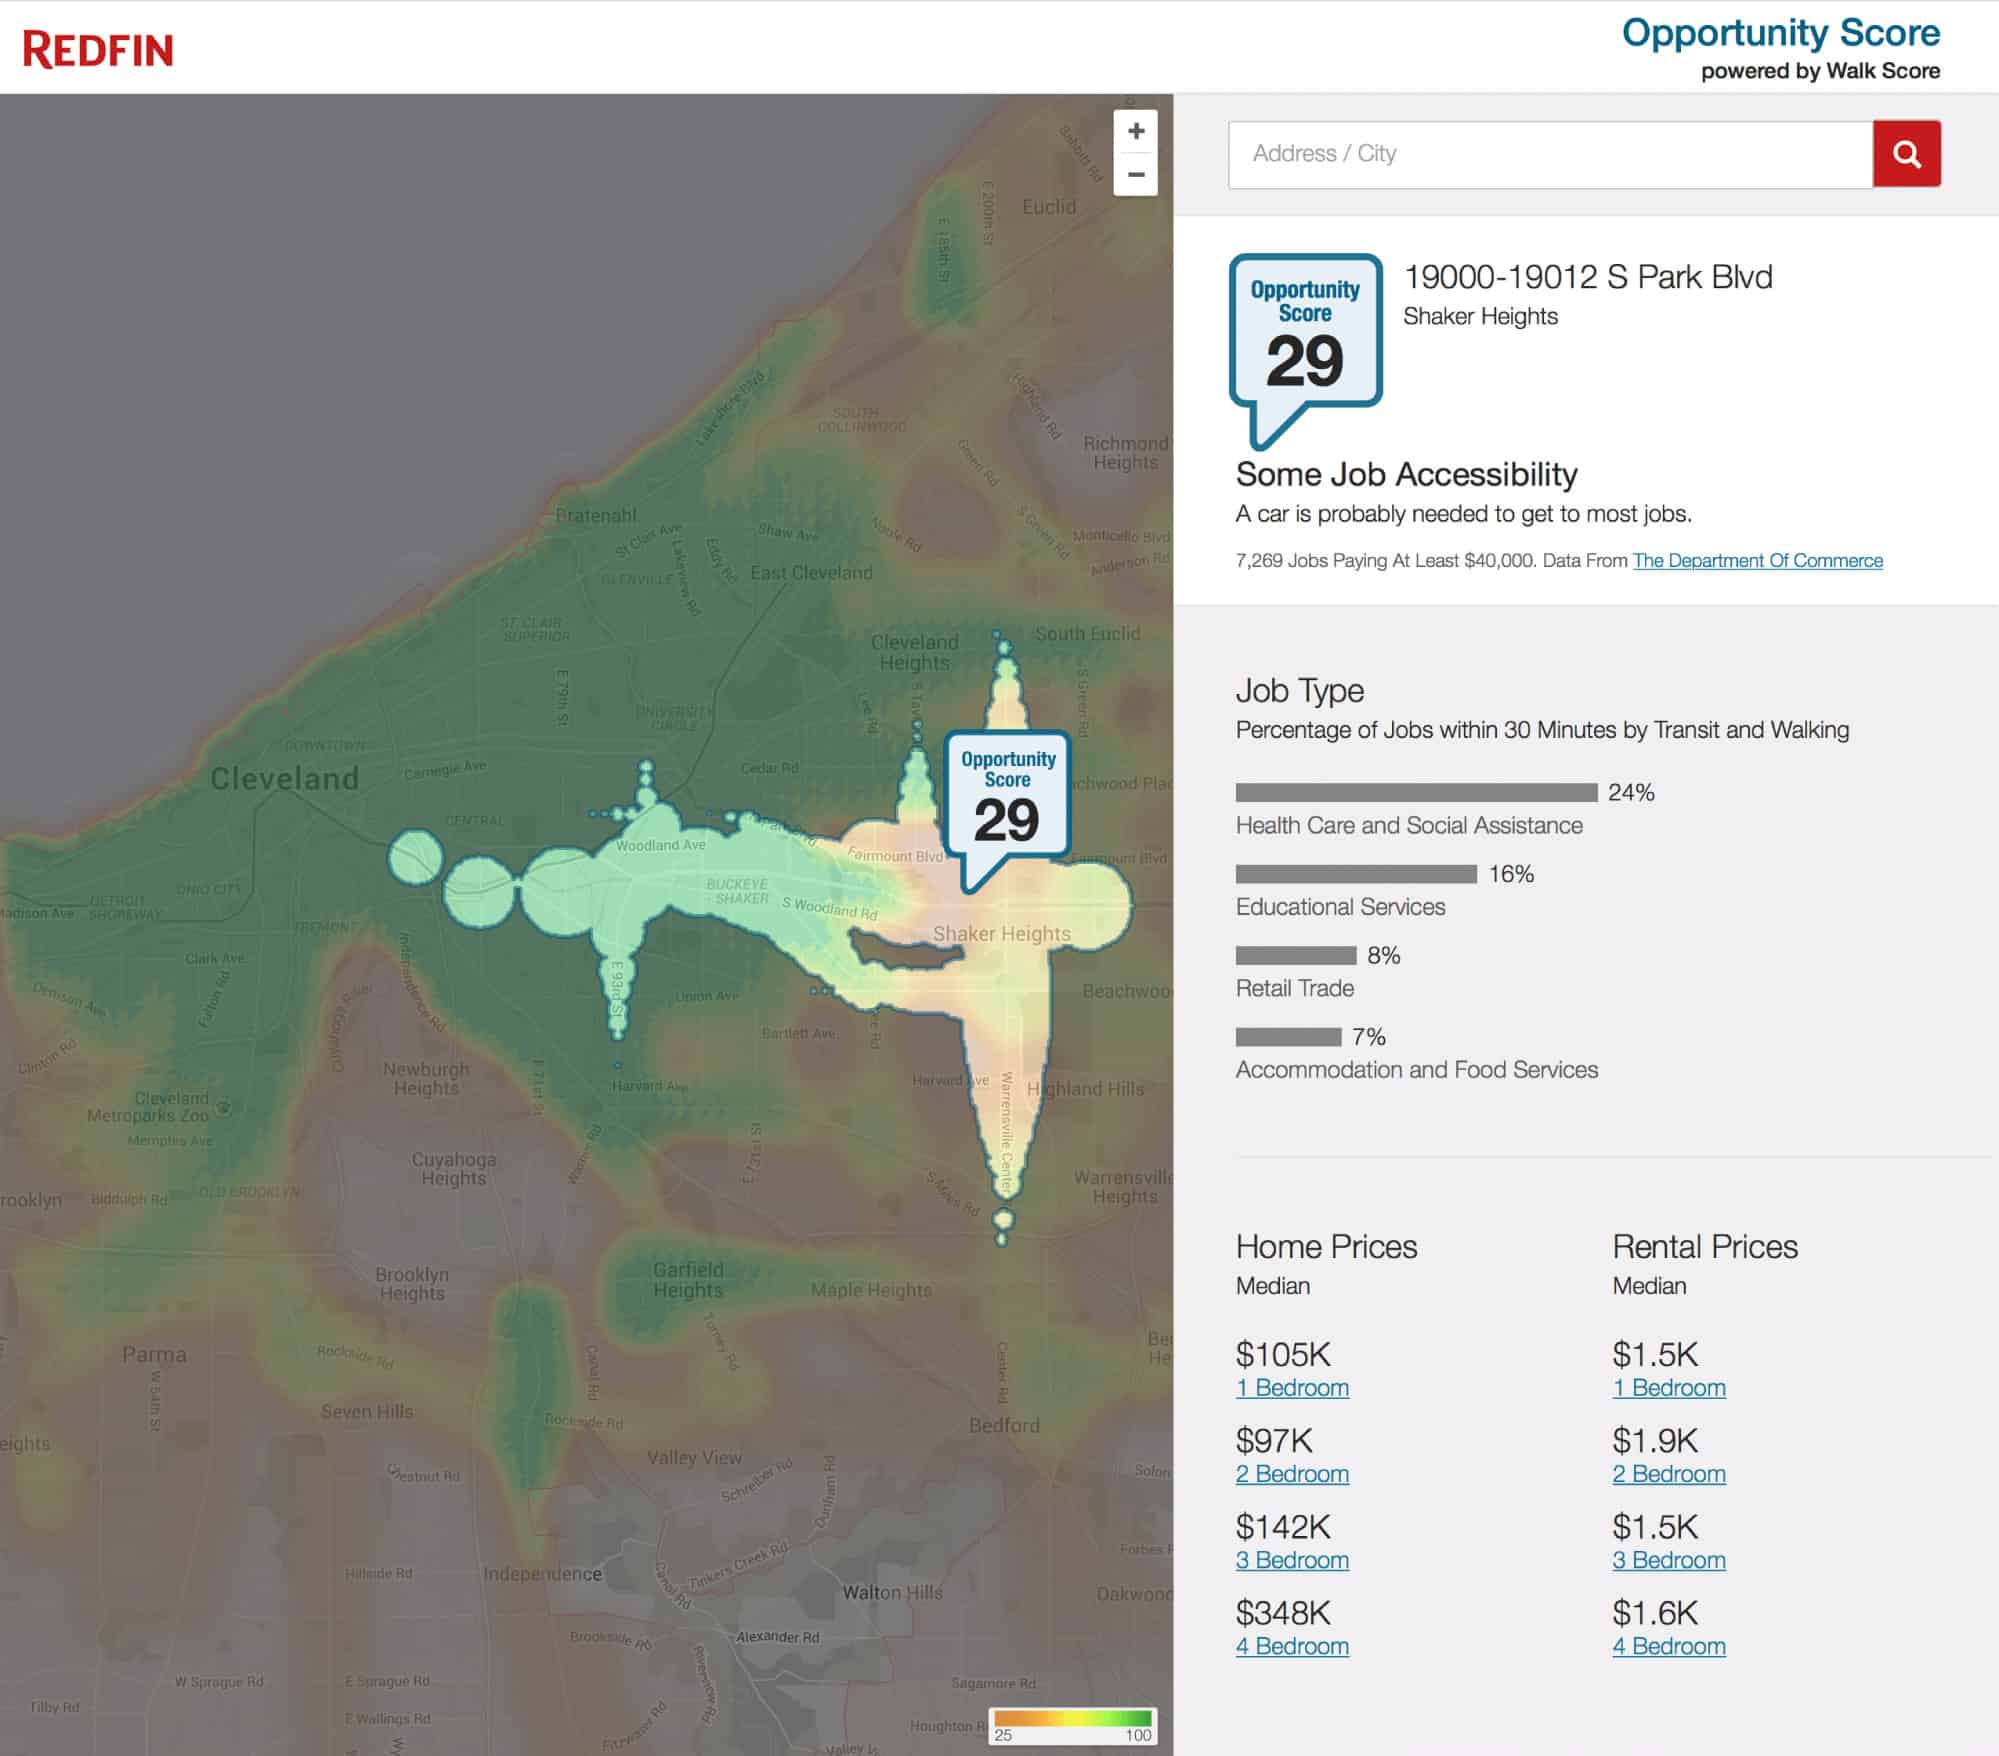
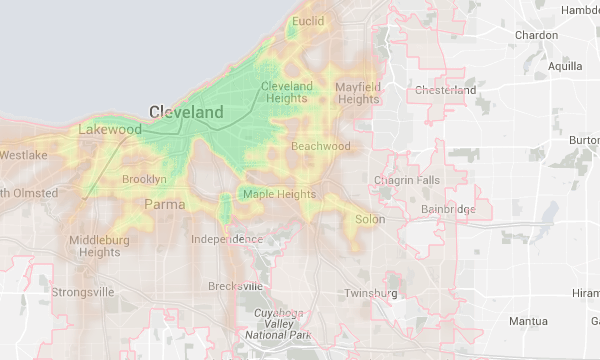
But not all addresses are connected to a lot of jobs by public transit. The next map shows the Opportunity Score of an address in Shaker Heights near Cleveland, Ohio. The highlighted area on the map shows that most of the jobs in the Cleveland area are out of range in 30 minutes by transit.
Are we suggesting this is a bad place to live? No way. The homes in this area have luxurious walk-in closets, high-end kitchens and fragrant landscaping. The Opportunity Score of 29 just means that most people will need a car to get to work, and getting to work will probably take longer than 30 minutes.
Who It’s For
Opportunity Score can be used by anyone, from a person searching for a job and a home, to someone who already has a great job but wants to spend less time commuting, to a recent grad who’s choosing a new city to move to based on employment availability and housing affordability.
Opportunity Score is for researchers, writers and policy-makers too, of course. It comes with some really useful maps to help people visualize parts of the country that are ripe with opportunity, as well as ones that are lacking.
The bottom line is that everyone deserves opportunity. Our mission at Redfin and Walk Score is to make information about things like jobs, home prices and transit access easily available so people can make the best decisions possible and find places to live that will afford the best possible opportunities for them and their families.
Urban Area Rankings
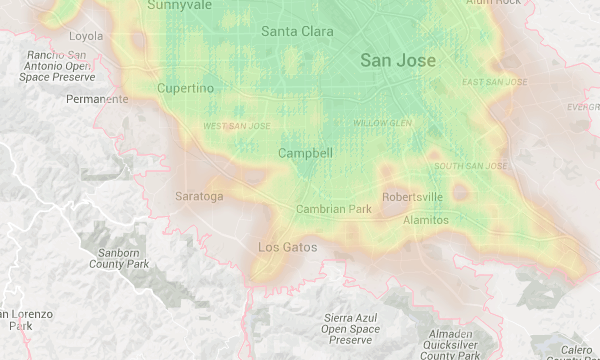
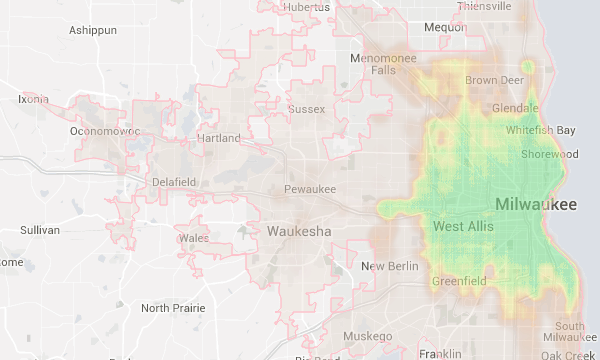
Of course, there’s even more we can do with Opportunity Score data. To get you started, we ranked the 50 most populous urbanized areas as defined by the U.S. Census by their population-weighted median Opportunity Score ratings. The San Jose, California area is the most accessible for workers without a car, and urban areas we don’t often talk about, like Milwaukee and Albuquerque, rose to the top. For each urban area, clicking on the map will take you to the Opportunity Score of that area. Here they are:
#1. San Jose, CA
70 |
|
PERCENT OF JOBS PAYING $40,000 OR MORE 78% |
|
MOST COMMON JOB TYPE Manufacturing |
|
POPULATION 1,701,890 |
#2. Milwaukee, WI
63 |
|
PERCENT OF JOBS PAYING $40,000 OR MORE 75% |
|
MOST COMMON JOB TYPE Health Care and Social Assistance |
|
POPULATION 1,288,680 |
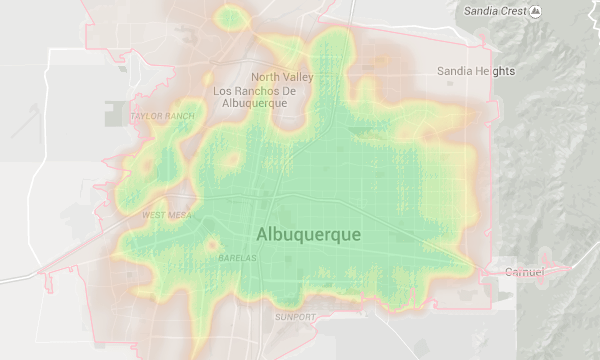
#3. Albuquerque, NM
59 |
|
PERCENT OF JOBS PAYING $40,000 OR MORE 26% |
|
MOST COMMON JOB TYPE Health Care and Social Assistance |
|
POPULATION 701,406 |
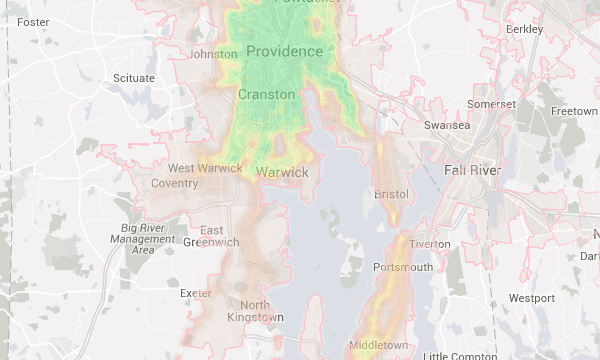
#4. Providence, RI
58 |
|
PERCENT OF JOBS PAYING $40,000 OR MORE 66% |
|
MOST COMMON JOB TYPE Health Care and Social Assistance |
|
POPULATION 963,913 |
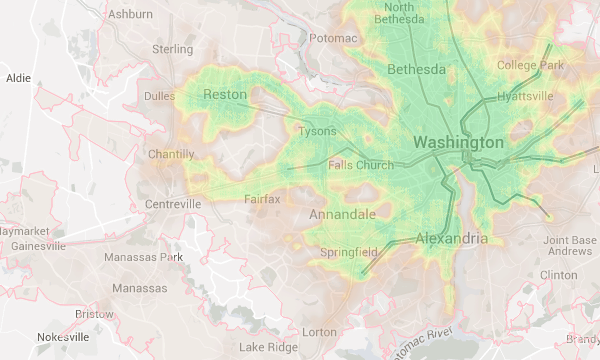
#5. Washington, DC–VA–MD
51 |
|
PERCENT OF JOBS PAYING $40,000 OR MORE 76% |
|
MOST COMMON JOB TYPE Professional, Scientific, and Technical Services |
|
POPULATION 5,315,030 |
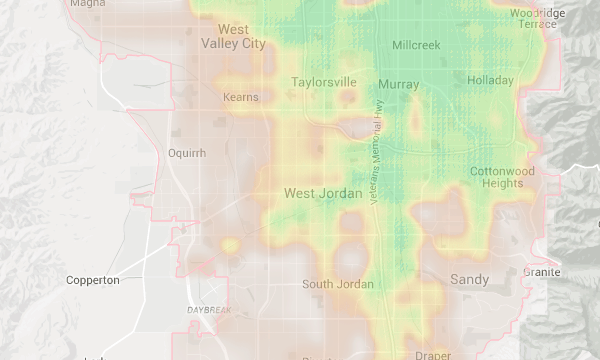
#5. Salt Lake City/West Valley City, UT
51 |
|
PERCENT OF JOBS PAYING $40,000 OR MORE 47% |
|
MOST COMMON JOB TYPE Retail Trade |
|
POPULATION 1,008,700 |
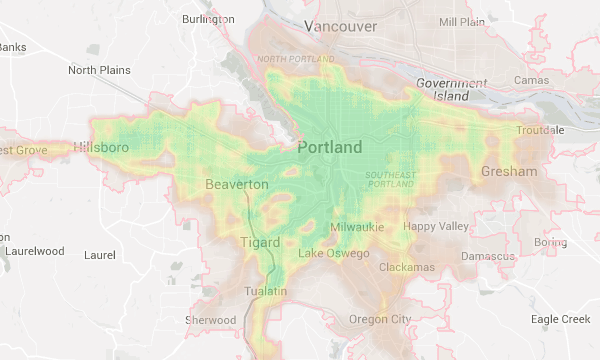
#5. Portland, OR–WA
51 |
|
PERCENT OF JOBS PAYING $40,000 OR MORE 39% |
|
MOST COMMON JOB TYPE Health Care and Social Assistance |
|
POPULATION 1,802,120 |
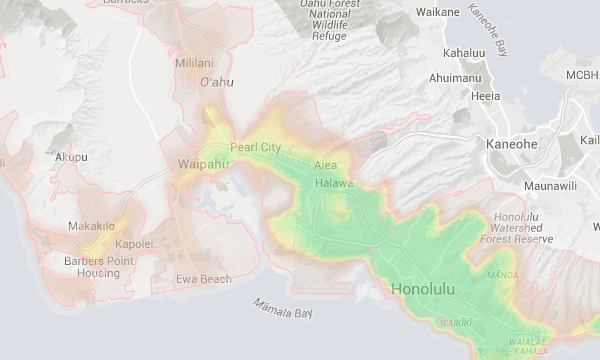
#8. Urban Honolulu, HI
50 |
|
PERCENT OF JOBS PAYING $40,000 OR MORE 77% |
|
MOST COMMON JOB TYPE Accommodation and Food Services |
|
POPULATION 746,976 |
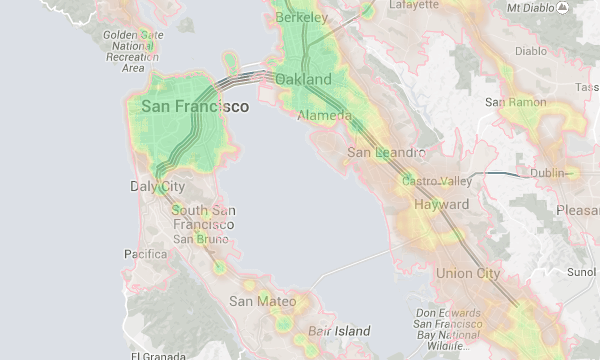
#9. San Francisco/Oakland, CA
47 |
|
PERCENT OF JOBS PAYING $40,000 OR MORE 77% |
|
MOST COMMON JOB TYPE Health Care and Social Assistance |
|
POPULATION 4,241,940 |
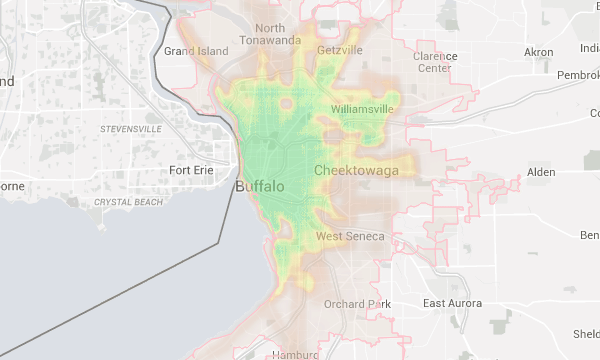
#9. Buffalo, NY
47 |
|
PERCENT OF JOBS PAYING $40,000 OR MORE 66% |
|
MOST COMMON JOB TYPE Health Care and Social Assistance |
|
POPULATION 890,967 |
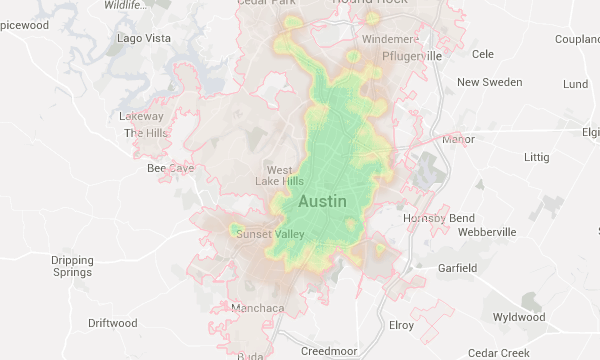
#9. Austin, TX
47 |
|
PERCENT OF JOBS PAYING $40,000 OR MORE 66% |
|
MOST COMMON JOB TYPE Educational Services |
|
POPULATION 1,228,380 |
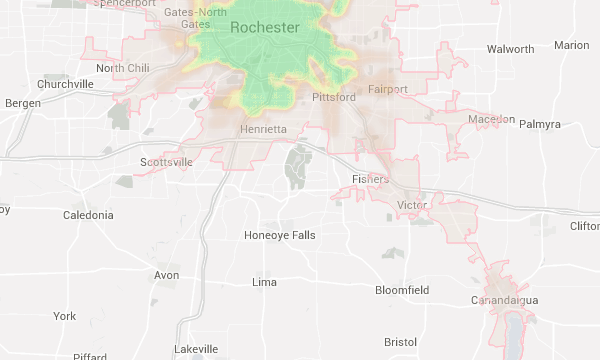
#12. Rochester, NY
45 |
|
PERCENT OF JOBS PAYING $40,000 OR MORE 67% |
|
MOST COMMON JOB TYPE Educational Services |
|
POPULATION 654,982 |
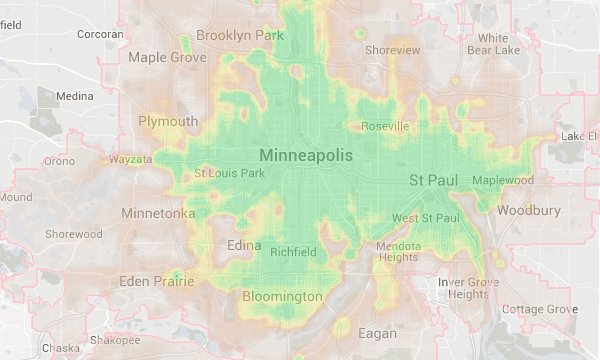
#12. Minneapolis/St. Paul, MN–WI
45 |
|
PERCENT OF JOBS PAYING $40,000 OR MORE 73% |
|
MOST COMMON JOB TYPE Health Care and Social Assistance |
|
POPULATION 2,550,340 |
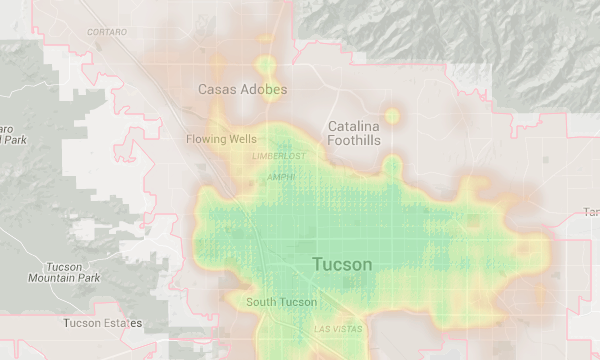
#14. Tucson, AZ
44 |
|
PERCENT OF JOBS PAYING $40,000 OR MORE 74% |
|
MOST COMMON JOB TYPE Health Care and Social Assistance |
|
POPULATION 769,277 |
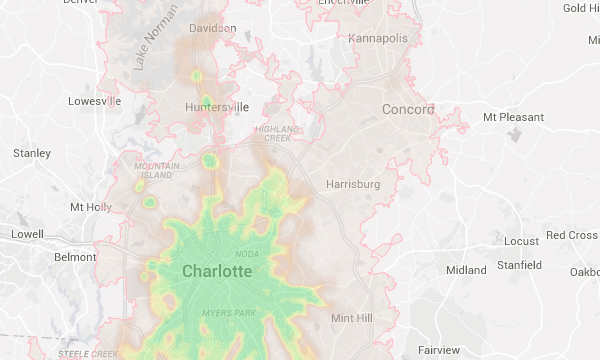
#15. Charlotte, NC–SC
38 |
|
PERCENT OF JOBS PAYING $40,000 OR MORE 64% |
|
MOST COMMON JOB TYPE Health Care and Social Assistance |
|
POPULATION 1,327,250 |
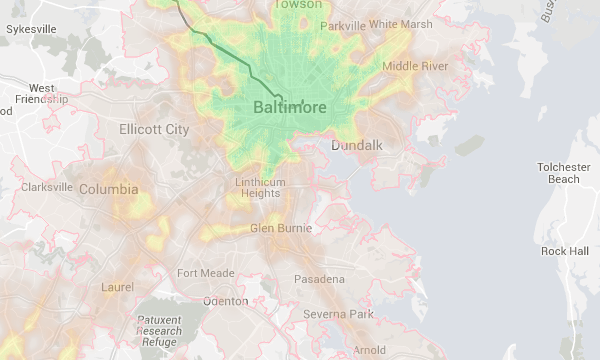
#15. Baltimore, MD
38 |
|
PERCENT OF JOBS PAYING $40,000 OR MORE 82% |
|
MOST COMMON JOB TYPE Health Care and Social Assistance |
|
POPULATION 2,894,460 |
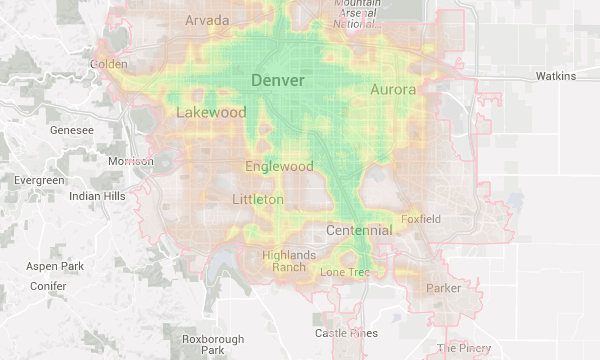
#17. Denver/Aurora, CO
37 |
|
PERCENT OF JOBS PAYING $40,000 OR MORE 24% |
|
MOST COMMON JOB TYPE Health Care and Social Assistance |
|
POPULATION 2,394,280 |
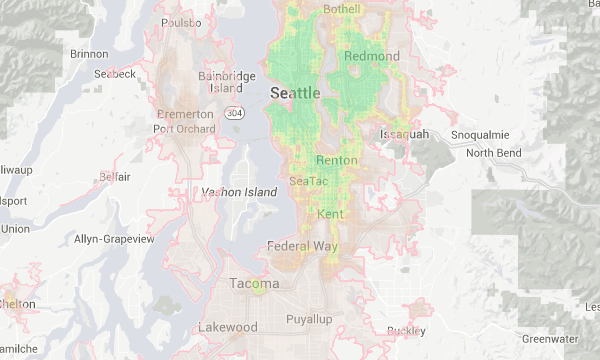
#18. Seattle, WA
36 |
|
PERCENT OF JOBS PAYING $40,000 OR MORE 61% |
|
MOST COMMON JOB TYPE Health Care and Social Assistance |
|
POPULATION 3,149,580 |
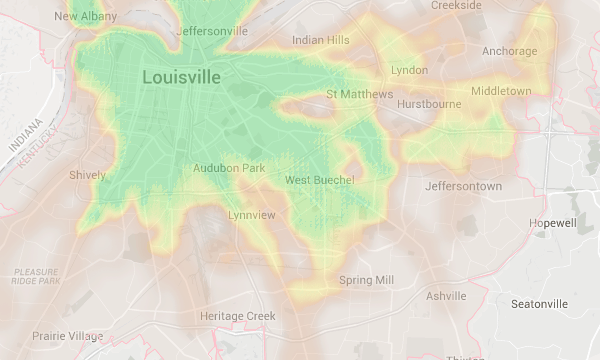
#19. Louisville/Jefferson County, KY–IN
35 |
|
PERCENT OF JOBS PAYING $40,000 OR MORE 75% |
|
MOST COMMON JOB TYPE Health Care and Social Assistance |
|
POPULATION 902,842 |
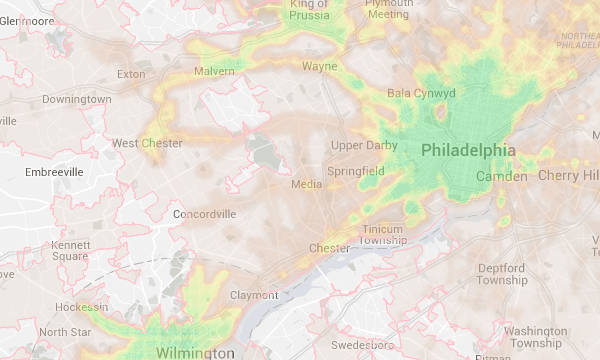
#20. Philadelphia, PA–NJ–DE–MD
33 |
|
PERCENT OF JOBS PAYING $40,000 OR MORE 57% |
|
MOST COMMON JOB TYPE Health Care and Social Assistance |
|
POPULATION 5,210,800 |
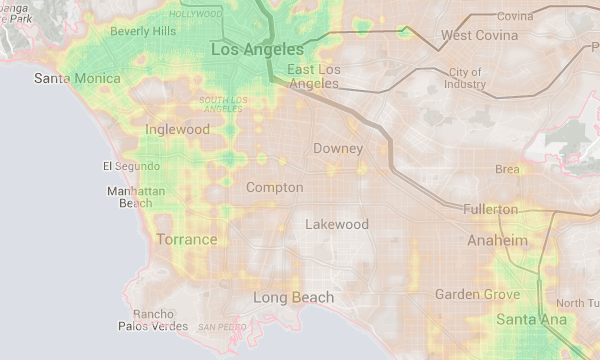
#20. Los Angeles/Long Beach/Anaheim, CA
33 |
|
PERCENT OF JOBS PAYING $40,000 OR MORE 71% |
|
MOST COMMON JOB TYPE Health Care and Social Assistance |
|
POPULATION 12,891,000 |
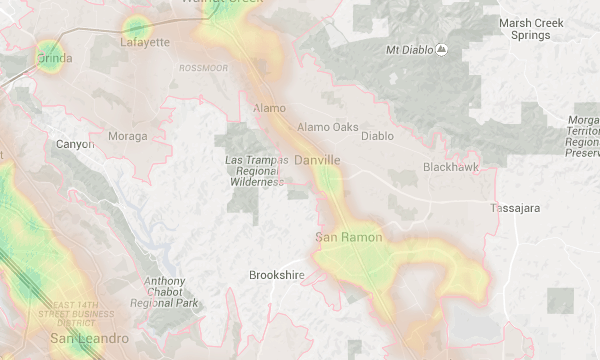
#20. Concord, CA
33 |
|
PERCENT OF JOBS PAYING $40,000 OR MORE 46% |
|
MOST COMMON JOB TYPE Health Care and Social Assistance |
|
POPULATION 1,210,080 |
#20. Cleveland, OH
33 |
|
PERCENT OF JOBS PAYING $40,000 OR MORE 65% |
|
MOST COMMON JOB TYPE Health Care and Social Assistance |
|
POPULATION 1,659,340 |
#24. San Antonio, TX
32 |
|
PERCENT OF JOBS PAYING $40,000 OR MORE 55% |
|
MOST COMMON JOB TYPE Health Care and Social Assistance |
|
POPULATION 1,709,500 |
#24. Sacramento, CA
32 |
|
PERCENT OF JOBS PAYING $40,000 OR MORE 70% |
|
MOST COMMON JOB TYPE Public Administration |
|
POPULATION 1,667,840 |
#26. San Diego, CA
31 |
|
PERCENT OF JOBS PAYING $40,000 OR MORE 41% |
|
MOST COMMON JOB TYPE Health Care and Social Assistance |
|
POPULATION 2,831,810 |
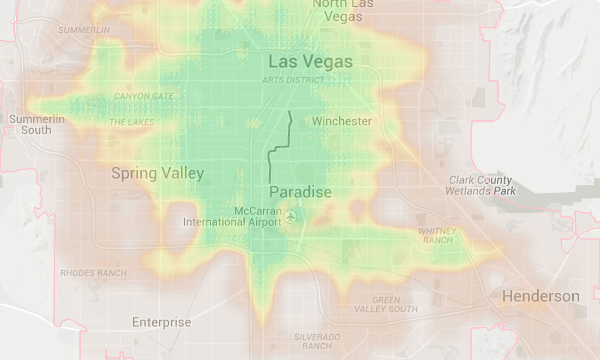
#26. Las Vegas/Henderson, NV
31 |
|
PERCENT OF JOBS PAYING $40,000 OR MORE 83% |
|
MOST COMMON JOB TYPE Accommodation and Food Services |
|
POPULATION 1,857,330 |
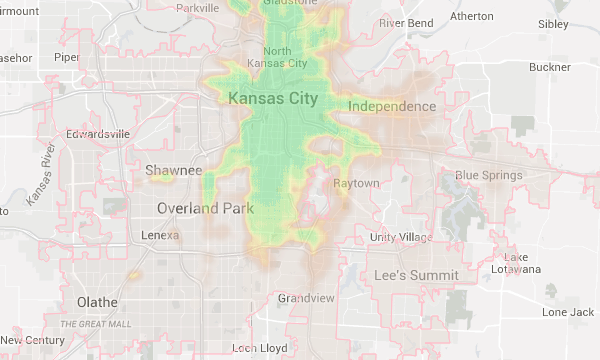
#26. Kansas City, MO–KS
31 |
|
PERCENT OF JOBS PAYING $40,000 OR MORE 83% |
|
MOST COMMON JOB TYPE Health Care and Social Assistance |
|
POPULATION 1,067,470 |
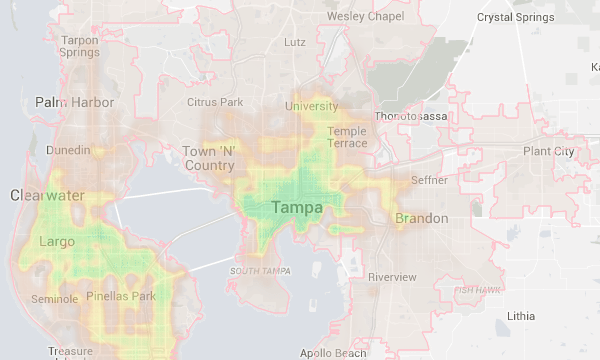
#29. Tampa/St. Petersburg, FL
30 |
|
PERCENT OF JOBS PAYING $40,000 OR MORE 26% |
|
MOST COMMON JOB TYPE Health Care and Social Assistance |
|
POPULATION 2,316,720 |
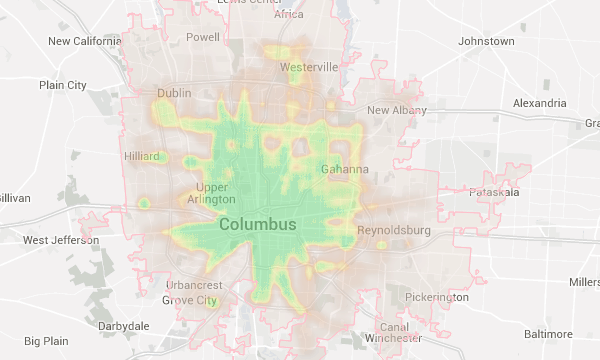
#29. Columbus, OH
30 |
|
PERCENT OF JOBS PAYING $40,000 OR MORE 63% |
|
MOST COMMON JOB TYPE Health Care and Social Assistance |
|
POPULATION 1,287,410 |
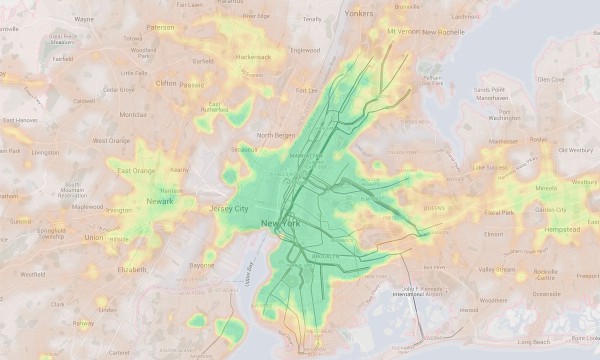
#31. New York/Newark, NY–NJ–CT
29 |
|
PERCENT OF JOBS PAYING $40,000 OR MORE 79% |
|
MOST COMMON JOB TYPE Health Care and Social Assistance |
|
POPULATION 19,242,300 |
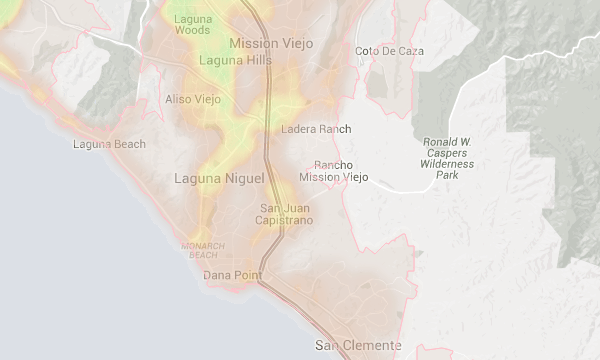
#31. Mission Viejo/Lake Forest/San Clemente, CA
29 |
|
PERCENT OF JOBS PAYING $40,000 OR MORE 58% |
|
MOST COMMON JOB TYPE Health Care and Social Assistance |
|
POPULATION 697,605 |
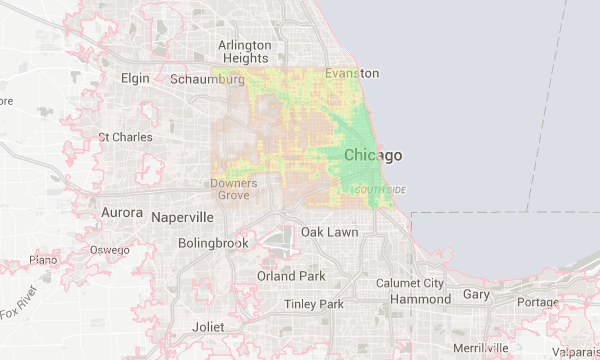
#31. Chicago, IL–IN
29 |
|
PERCENT OF JOBS PAYING $40,000 OR MORE 81% |
|
MOST COMMON JOB TYPE Health Care and Social Assistance |
|
POPULATION 8,212,400 |
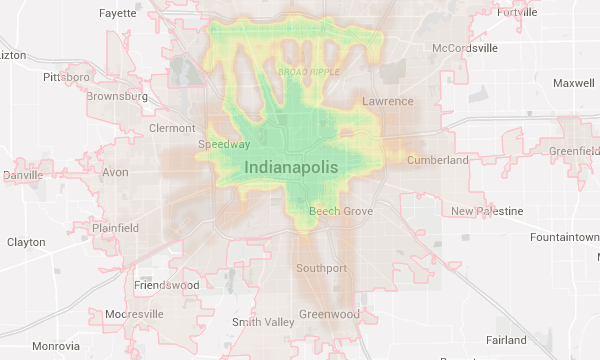
#34. Indianapolis, IN
27 |
|
PERCENT OF JOBS PAYING $40,000 OR MORE 72% |
|
MOST COMMON JOB TYPE Health Care and Social Assistance |
|
POPULATION 1,332,980 |
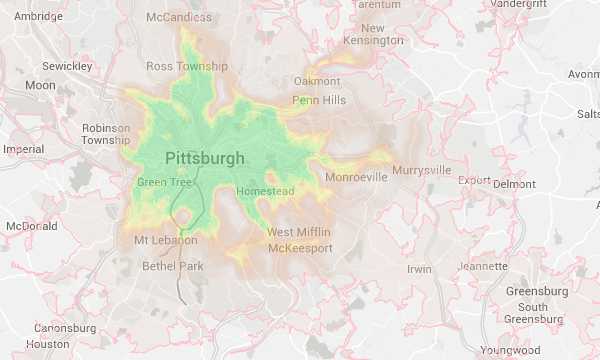
#35. Pittsburgh, PA
26 |
|
PERCENT OF JOBS PAYING $40,000 OR MORE 42% |
|
MOST COMMON JOB TYPE Health Care and Social Assistance |
|
POPULATION 1,580,710 |
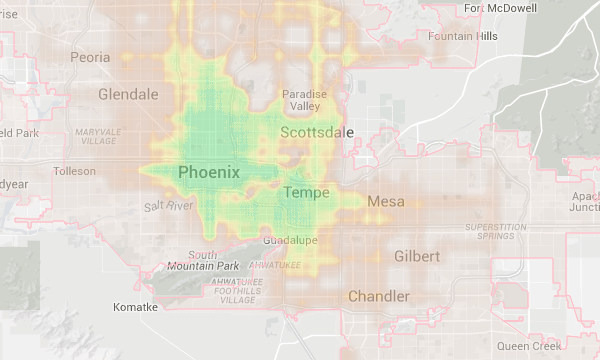
#35. Phoenix/Mesa, AZ
26 |
|
PERCENT OF JOBS PAYING $40,000 OR MORE 67% |
|
MOST COMMON JOB TYPE Health Care and Social Assistance |
|
POPULATION 3,750,550 |
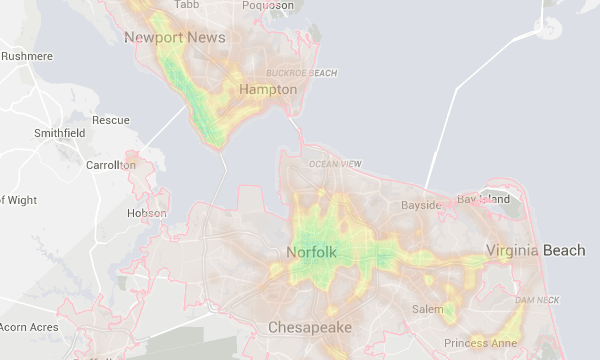
#37. Virginia Beach, VA
25 |
|
PERCENT OF JOBS PAYING $40,000 OR MORE 80% |
|
MOST COMMON JOB TYPE Health Care and Social Assistance |
|
POPULATION 1,351,410 |
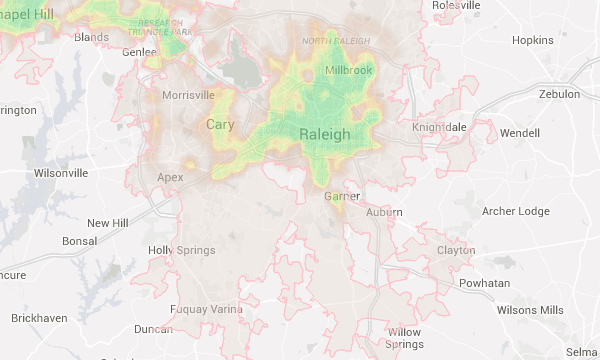
#38. Raleigh, NC
24 |
|
PERCENT OF JOBS PAYING $40,000 OR MORE 48% |
|
MOST COMMON JOB TYPE Health Care and Social Assistance |
|
POPULATION 949,159 |
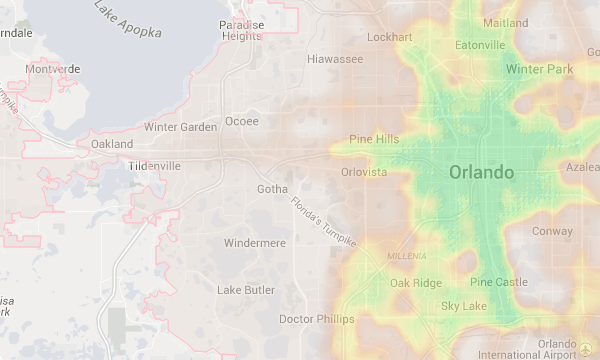
#39. Orlando, FL
23 |
|
PERCENT OF JOBS PAYING $40,000 OR MORE 45% |
|
MOST COMMON JOB TYPE Accommodation and Food Services |
|
POPULATION 1,565,570 |
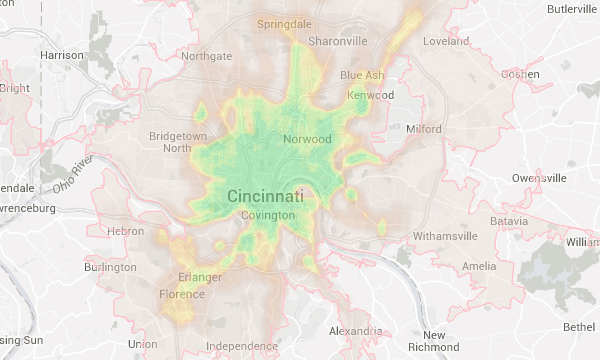
#39. Cincinnati, OH–KY–IN
23 |
|
PERCENT OF JOBS PAYING $40,000 OR MORE 76% |
|
MOST COMMON JOB TYPE Health Care and Social Assistance |
|
POPULATION 1,527,770 |
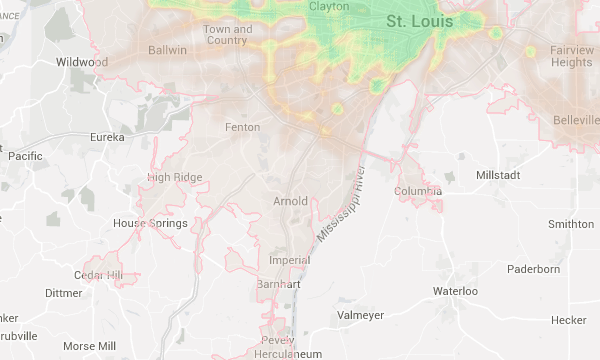
#41. St. Louis, MO–IL
22 |
|
PERCENT OF JOBS PAYING $40,000 OR MORE 76% |
|
MOST COMMON JOB TYPE Health Care and Social Assistance |
|
POPULATION 2,000,310 |
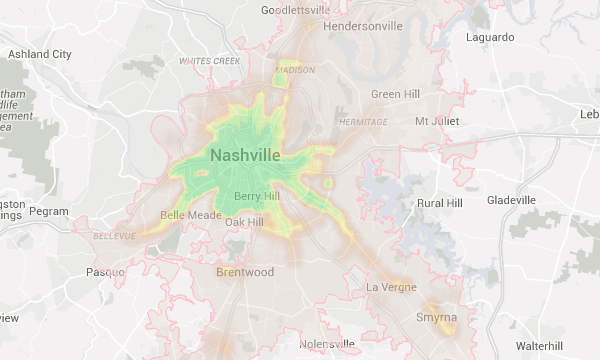
#42. Nashville/Davidson, TN
22 |
|
PERCENT OF JOBS PAYING $40,000 OR MORE 78% |
|
MOST COMMON JOB TYPE Health Care and Social Assistance |
|
POPULATION 849,276 |
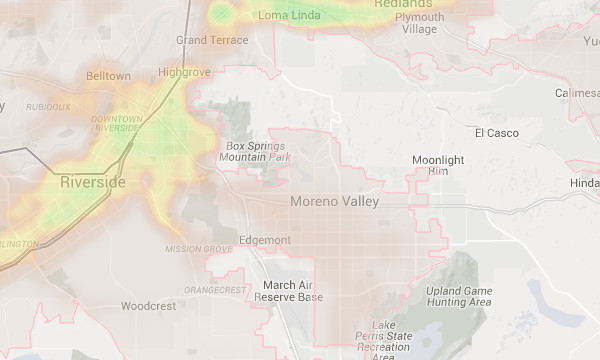
#43. Riverside/San Bernardino, CA
18 |
|
PERCENT OF JOBS PAYING $40,000 OR MORE 57% |
|
MOST COMMON JOB TYPE Health Care and Social Assistance |
|
POPULATION 2,245,100 |
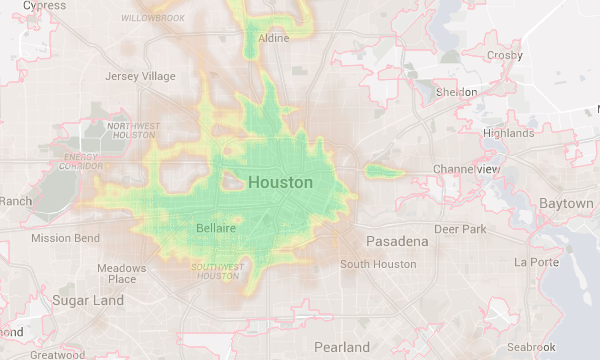
#44. Houston, TX
16 |
|
PERCENT OF JOBS PAYING $40,000 OR MORE 14% |
|
MOST COMMON JOB TYPE Health Care and Social Assistance |
|
POPULATION 4,765,090 |
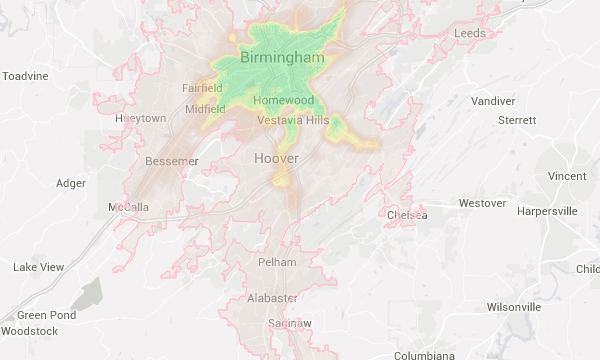
#44. Birmingham, AL
16 |
|
PERCENT OF JOBS PAYING $40,000 OR MORE 88% |
|
MOST COMMON JOB TYPE Health Care and Social Assistance |
|
POPULATION 635,658 |
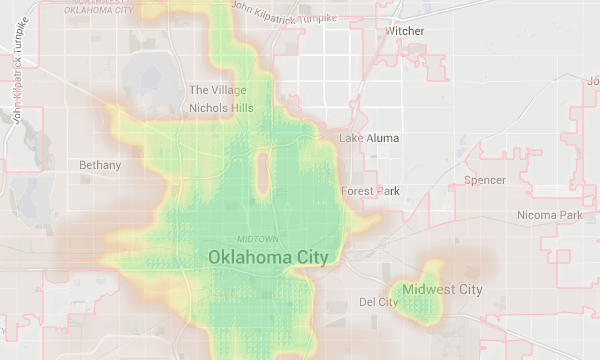
#46. Oklahoma City, OK
12 |
|
PERCENT OF JOBS PAYING $40,000 OR MORE 19% |
|
MOST COMMON JOB TYPE Health Care and Social Assistance |
|
POPULATION 826,721 |
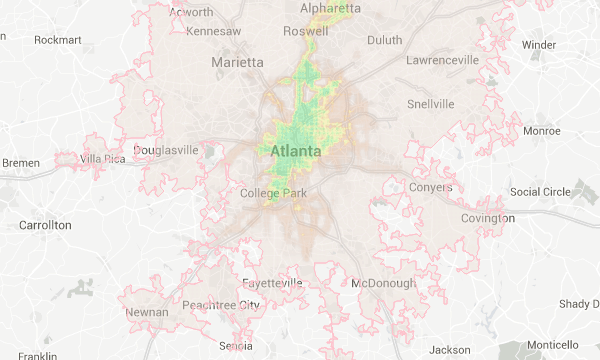
#47. Atlanta, GA
10 |
|
PERCENT OF JOBS PAYING $40,000 OR MORE 79% |
|
MOST COMMON JOB TYPE Retail Trade |
|
POPULATION 4,274,570 |
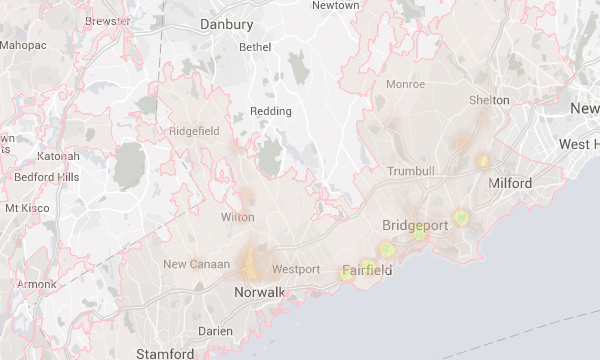
#48. Bridgeport/Stamford, CT–NY
7 |
|
PERCENT OF JOBS PAYING $40,000 OR MORE 77% |
|
MOST COMMON JOB TYPE Health Care and Social Assistance |
|
POPULATION 918,913 |
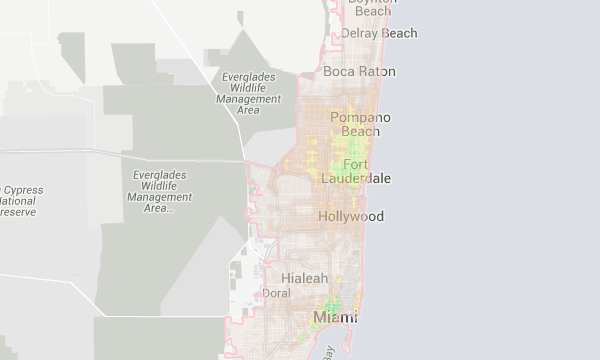
#49. Miami, FL
6 |
|
PERCENT OF JOBS PAYING $40,000 OR MORE 28% |
|
MOST COMMON JOB TYPE Health Care and Social Assistance |
|
POPULATION 5,434,950 |
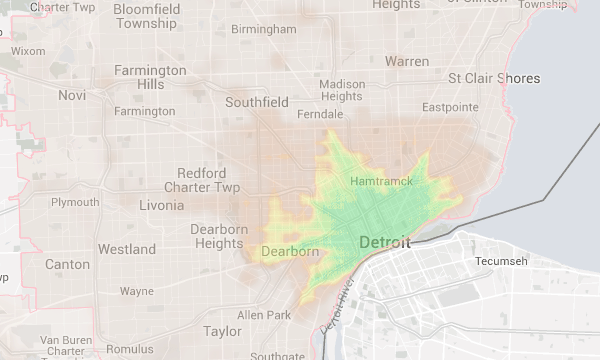
#50. Detroit, MI
3 |
|
PERCENT OF JOBS PAYING $40,000 OR MORE 72% |
|
MOST COMMON JOB TYPE Health Care and Social Assistance |
|
POPULATION 3,884,790 |
How We Built Opportunity Score |
Back To Top |
Opportunity Score is powered by the Walk Score Travel Time API (thank you Bo, Jason and David for the transit shed grinding machine pool), jobs data from the U.S. Department of Commerce, population data from the U.S. Census and housing data from the Redfin Estimate and Walk Score rentals.
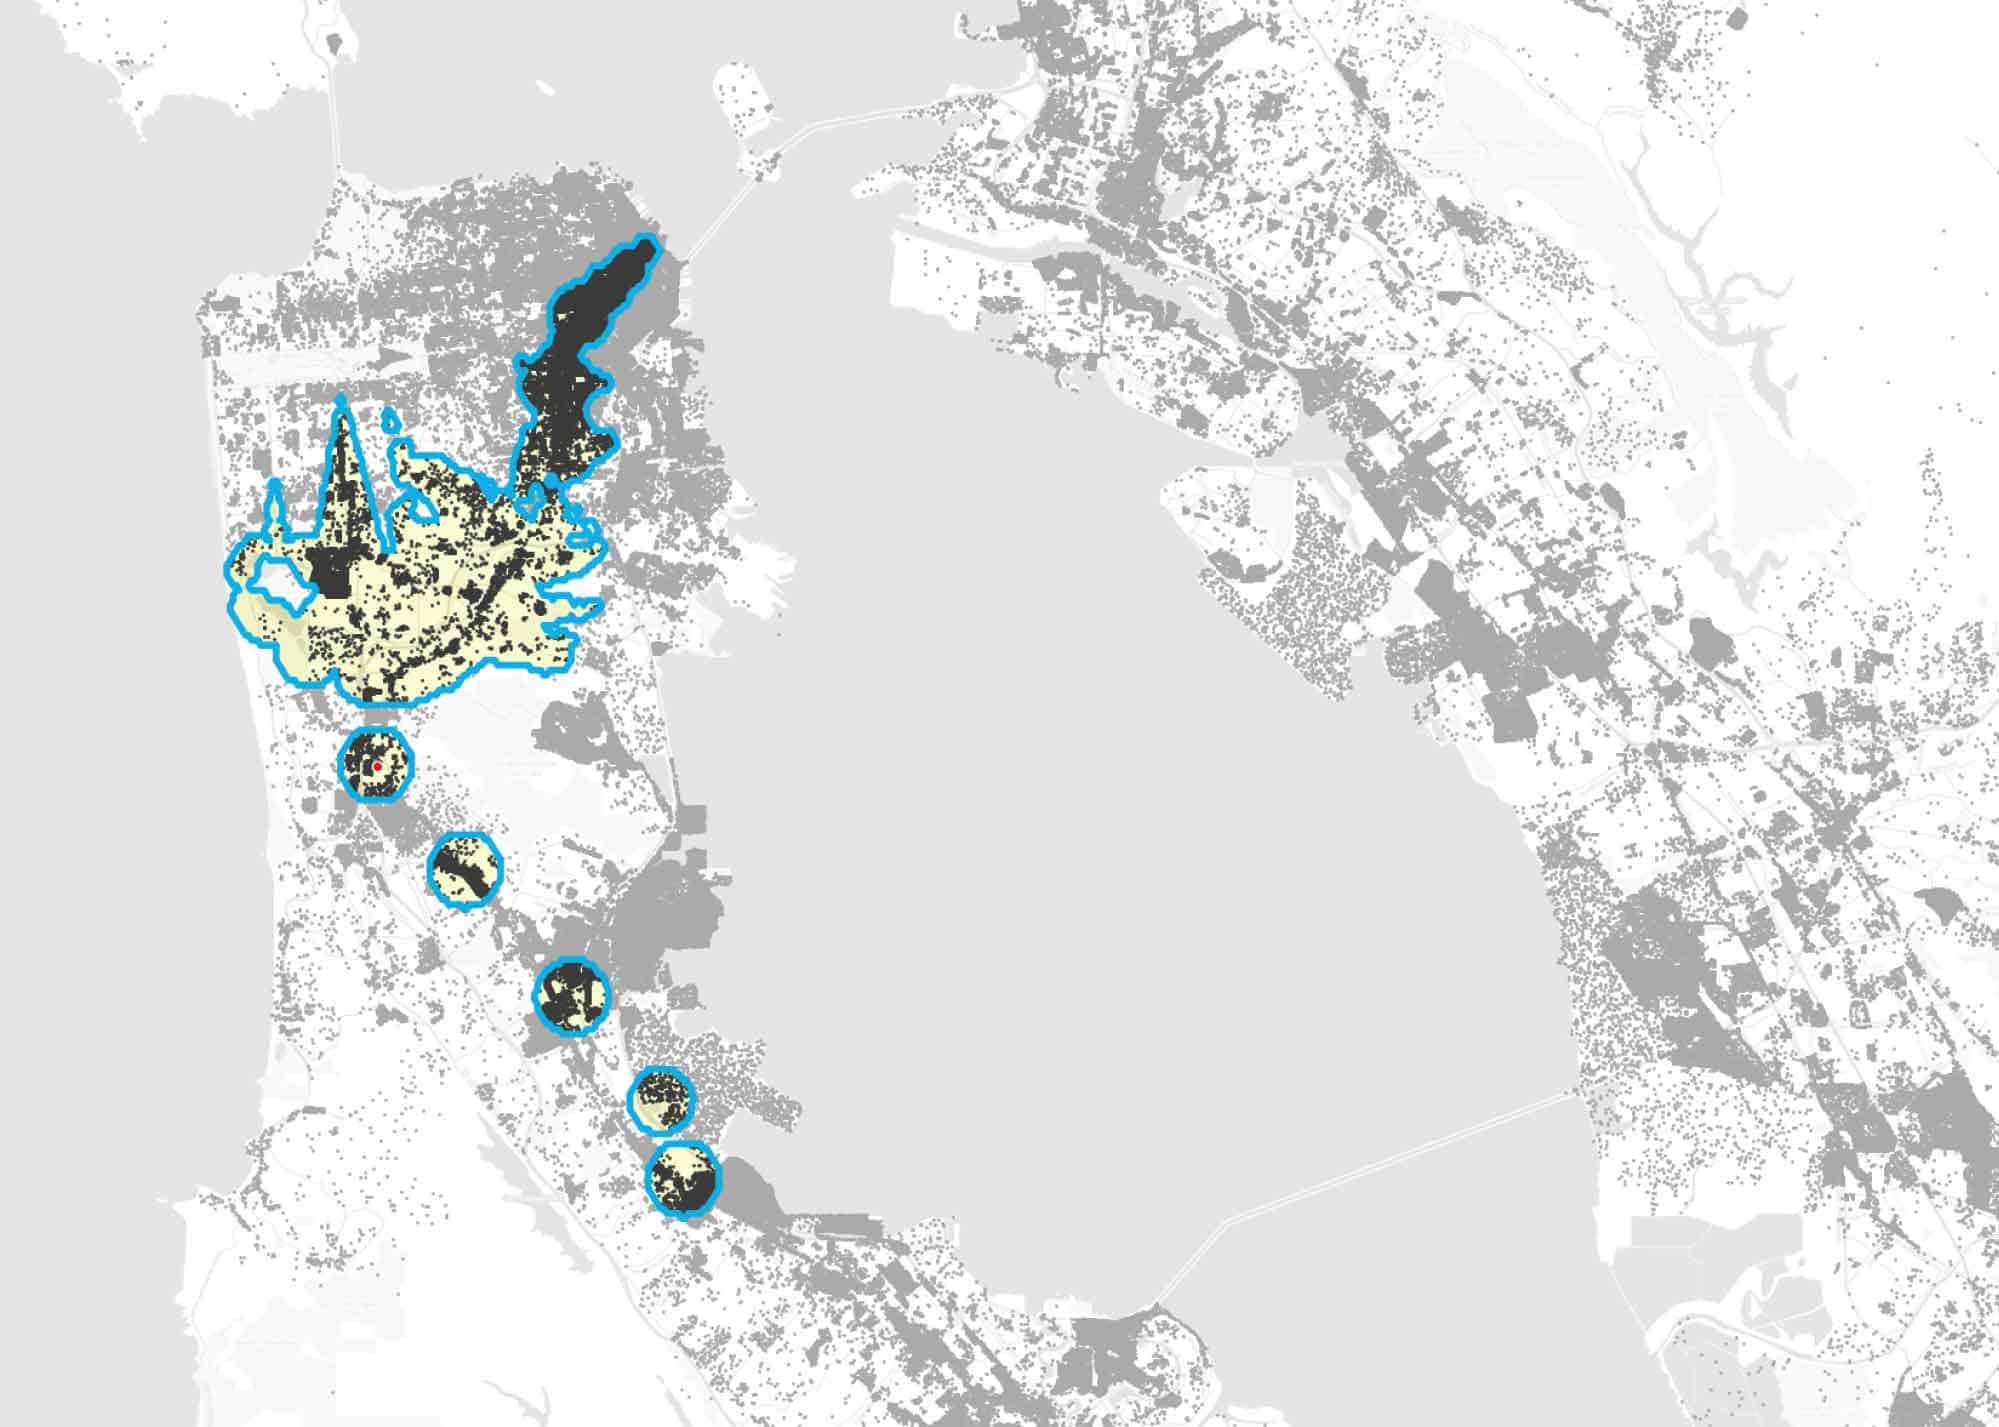
In the following map, the light grey dots are individual jobs that pay more than $40,000, the highest pay tier we can filter for in the jobs data from the Department of Commerce. The highlighted yellow blobs with the blue outlines make up the 30-minute “transit shed”—showing where you can go within 30 minutes without a car. Within those blobs, each dark grey dot is one of the 250,000 jobs reachable in 30 minutes from the Daly City BART station. After we count up the jobs, we factor in the population in a 30-mile buffer from the origin point.
And then we do some math.
We call the transit accessible jobs ‘n’ and we use it in our recipe to get the Opportunity Score for an address. The other big ingredient is the letter ‘p’ and it’s proportional to the inverse of the population in the greater area. We combine ‘n’ and ‘p’ to get a score using a binomial distribution that can be simplified to [1 – (1-p)^n] before scaling the score from 0 to 100.
Tim helped with that. Thanks, Tim.
We did this for millions of addresses in hundreds of cities, and then built a tool on top of it. This means that you can explore the Opportunity Score of your area right now. Do you have questions or an interest in collaborating? Contact research@redfin.com.
Other popular posts:
1. Senior Guide for Decluttering and Feeling at Home in a Retirement Home


