
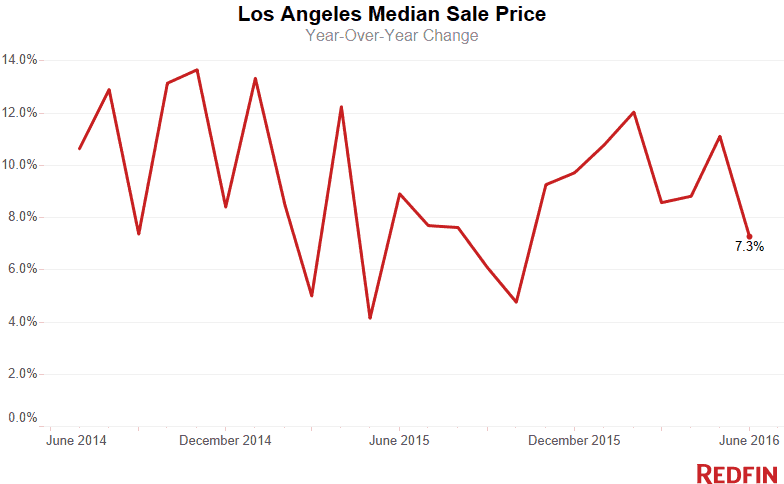
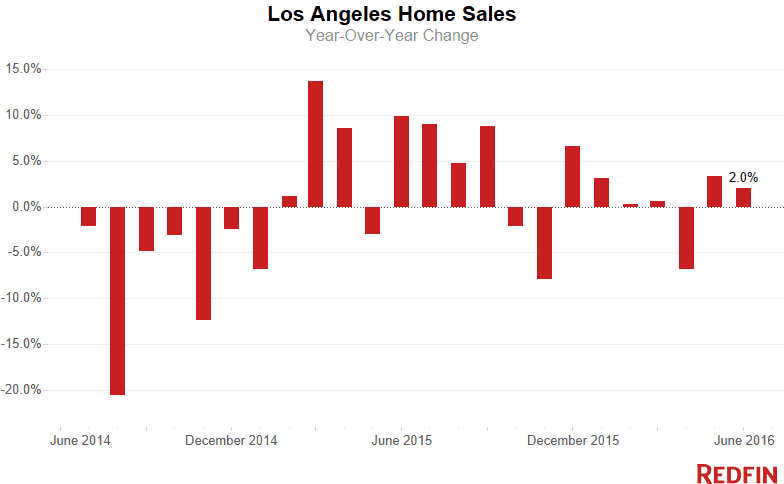
Home prices in the city of Los Angeles rose 7.3 percent in June from a year earlier to $590,000, down slightly from last month’s high-water mark of $600,000. Home sales remained tepid in June, increasing just 2.0 percent over last year.
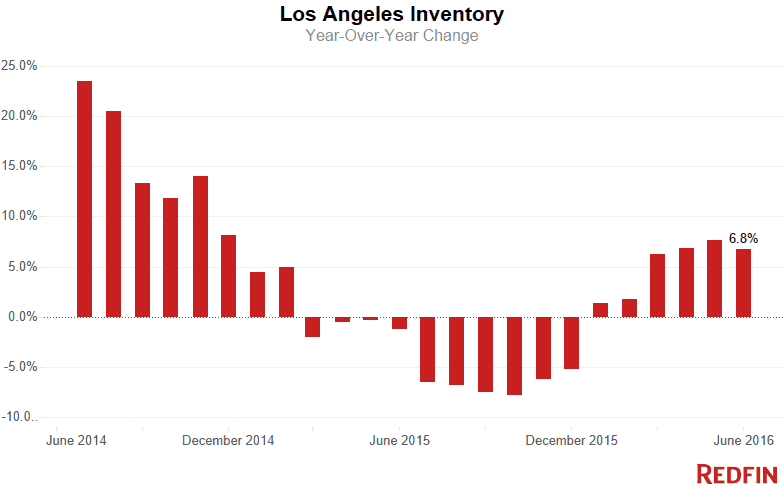
While new listings were up 7.7 percent since last June and overall supply continued a six-month run of annual growth, L.A. homebuyers continued to struggle with a lack of options. In June there were 2.4 months of supply available. Six months of supply typically signals a balanced market, which L.A. has not enjoyed since February of 2011.
Even in the face of robust price growth, competition has continued to increase. Forty-two percent of homes sold in June went for more than the asking price and the average sale-to-list ratio came in at 100.2 percent – the highest level recorded since October 2013.
“It’s not breaking news that there is a housing supply shortage in L.A.,” said Redfin real estate agent Anthony Altieri. “While the dream of a perfectly remodeled midcentury home in Silver Lake, for instance, is out of reach for many buyers, there are options for those whose primary goal is getting a home under contract while mortgage rates are still so low. If you’re willing to consider a fixer-upper or even purchase a condo instead, you can typically buy at a much lower premium and face a lot less competition.”
Area Trends and Hot Neighborhoods
Prices are still rising on the Westside, with the median in sale price this June holding strong at $1.22 million dollars, up 11 percent from last year. Competition remains highest on the Eastside, where 51 percent of all home sold in June went for more than the asking price. With the typical home selling within 20 days, the Eastside was also the fastest market compared with the Westside, South L.A. and the Valley.
With the housing affordability crisis in L.A. seeming interminable, this month we took a look at trends in the condominium market to see where buyers may still find a reasonably priced home in a desirable neighborhood. Of the neighborhoods we tracked in June, here are the ones where condos are still relatively affordable:
- In Silver Lake the median sale price for a single-family home as of June was $1.07 million. Condo-buyers, on the other hand, were snagging properties in this trendy Eastside ‘hood for a median price of $558,000.
- In Woodland Hills the typical single-family home fetched a median sale price of $760,000. Condos appeared to be a bargain, which were fetching a median price of just $385,000.
- Lots of people dream of living in the Hollywood Hills. As of this June, buyers were forking over a median price of $1.4 million for a single-family home. Condo-buyers were still enjoying the prestigious neighborhood and access to the Sunset Strip but for nearly $1 million less, at a median $535,000 in June.
- Buying on the Westside seems out of reach for the typical buyer regardless of property type. This June the median sale price for a single-family home in Venice was $1.8 million, but a buyer would still have to pay a median price of just over a million dollars for a condo.
- Condos in the Westside areas of the Pacific Palisades, Malibu and Santa Monica all fetched a median sale price of over $800K in June.
Here’s what’s happening in your neighborhood:
| Place | Median Sale Price | Year-Over-Year | Homes Sold | Year-Over-Year | Inventory | Year-Over-Year | New Listings | Median Days on Market | Avg Sale-to-List |
|---|---|---|---|---|---|---|---|---|---|
| Beverly Glen | $1,390,000 | -47.0% | 15 | 0.0% | 41 | 41.4% | 45 | 28 | 98.2% |
| Beverly Hills Post Office | $2,050,000 | -7.9% | 45 | -13.5% | 124 | 40.9% | 119 | 42 | 98.3% |
| Brentwood | $1,836,000 | 12.6% | 139 | -2.8% | 128 | -5.2% | 166 | 27 | 100.3% |
| Central LA | $850,000 | 3.7% | 981 | -2.9% | 1,045 | 11.2% | 1,444 | 29 | 99.0% |
| Century City | $1,060,000 | 25.2% | 82 | -19.6% | 73 | -26.3% | 110 | 22 | 99.6% |
| Chatsworth | $505,000 | -4.5% | 99 | -2.0% | 89 | 20.3% | 139 | 34 | 99.5% |
| Cheviot Hills | $2,200,000 | 22.5% | 21 | -4.5% | 16 | 77.8% | 31 | 34 | 97.4% |
| Crenshaw | $532,000 | 15.7% | 49 | 14.0% | 15 | -34.8% | 43 | 17 | 104.9% |
| Downtown | $641,250 | 3.4% | 100 | -18.7% | 138 | 43.8% | 175 | 35 | 98.6% |
| Eagle Rock | $750,000 | 8.9% | 82 | 24.2% | 30 | -41.2% | 79 | 16 | 102.6% |
| East LA | $645,000 | 12.2% | 624 | 0.7% | 426 | -7.4% | 792 | 20 | 102.2% |
| Encino | $890,500 | 9.1% | 189 | -16.7% | 193 | 6.6% | 265 | 35 | 99.2% |
| Fox Hills | $470,500 | 8.8% | 28 | -15.2% | 11 | -8.3% | 31 | 12 | 103.1% |
| Glassell Park | $725,000 | 13.5% | 42 | 2.4% | 27 | -6.9% | 52 | 17 | 104.4% |
| Greater Echo Park Elysian | $855,250 | 20.0% | 46 | -17.9% | 53 | -3.6% | 76 | 33 | 99.9% |
| Hancock Park | $2,133,500 | -7.2% | 24 | 84.6% | 30 | 76.5% | 34 | 25 | 98.4% |
| Highland Park | $640,000 | 11.3% | 102 | 7.4% | 45 | -28.6% | 106 | 22 | 102.7% |
| Hollywood | $685,000 | -4.7% | 87 | -7.4% | 85 | 28.8% | 127 | 30 | 98.7% |
| Hollywood Hills West | $962,250 | -19.8% | 120 | -11.1% | 174 | 20.0% | 204 | 31 | 99.4% |
| Holmby Hills | $870,000 | 3.7% | 5 | -44.4% | 7 | 16.7% | 4 | 37 | 96.8% |
| Koreatown / Wilshire Center | $579,000 | -1.0% | 135 | 12.5% | 136 | 7.1% | 183 | 35 | 98.4% |
| Lake Balboa | $530,000 | 14.0% | 97 | -19.8% | 62 | 5.1% | 122 | 30 | 100.2% |
| Malibu | $2,776,250 | 33.8% | 28 | -26.3% | 251 | 5.5% | 49 | 104 | 94.3% |
| Marina del Rey | $865,000 | 1.7% | 107 | 42.7% | 70 | 55.6% | 126 | 20 | 100.8% |
| Mid-City | $850,000 | 0.8% | 160 | -0.6% | 137 | 3.0% | 210 | 30 | 100.2% |
| Mid-Wilshire | $850,000 | 0.5% | 443 | 1.4% | 444 | 8.3% | 620 | 34 | 99.1% |
| Mount Washington | $680,000 | -9.3% | 29 | 3.6% | 27 | 107.7% | 43 | 19 | 103.4% |
| North Hollywood | $495,000 | 8.5% | 169 | 8.3% | 111 | 1.8% | 191 | 32 | 99.7% |
| North Valley | $480,000 | 6.8% | 1,374 | 1.0% | 924 | 11.2% | 1,793 | 28 | 100.2% |
| Northridge | $640,000 | 19.2% | 143 | -4.7% | 100 | -2.0% | 186 | 37 | 99.4% |
| Northwest San Pedro | $487,250 | 8.5% | 86 | -16.5% | 72 | -8.9% | 127 | 37 | 99.8% |
| Pacific Palisades | $2,090,000 | -13.8% | 111 | -5.1% | 134 | 22.9% | 172 | 33 | 98.7% |
| Pacoima | $395,000 | 14.5% | 98 | 10.1% | 45 | 4.7% | 105 | 17 | 99.5% |
| Panorama City | $380,000 | 14.3% | 72 | -2.7% | 41 | 2.5% | 101 | 30 | 101.2% |
| Pasadena | $710,000 | 6.5% | 188 | 9.3% | 340 | -1.2% | 205 | 18 | 101.1% |
| Santa Monica | $1,435,000 | 13.5% | 61 | -35.1% | 136 | -11.1% | 84 | 22 | 100.6% |
| Sherman Oaks | $800,000 | 6.8% | 274 | 4.6% | 248 | 29.2% | 366 | 35 | 99.6% |
| Silver Lake | $992,750 | 7.9% | 74 | -1.3% | 57 | 54.0% | 97 | 19 | 105.0% |
| South Central LA | $368,000 | 9.8% | 234 | -0.4% | 172 | -26.5% | 339 | 31 | 100.1% |
| South LA | $410,000 | 12.3% | 961 | -0.2% | 808 | -9.3% | 1,358 | 32 | 100.4% |
| South Valley | $585,000 | 11.4% | 1,876 | -1.2% | 1,565 | 17.7% | 2,559 | 34 | 99.6% |
| Studio City | $1,040,000 | 6.9% | 149 | -5.7% | 176 | 24.8% | 239 | 30 | 99.9% |
| Sun Valley | $460,000 | 11.1% | 95 | 35.7% | 51 | -7.3% | 101 | 30 | 99.5% |
| Sylmar | $425,000 | 6.2% | 172 | 0.6% | 102 | 14.6% | 216 | 28 | 100.3% |
| Tarzana | $609,000 | 28.2% | 141 | 4.4% | 148 | 20.3% | 207 | 31 | 98.8% |
| Valley Village | $860,000 | 16.1% | 81 | 37.3% | 42 | 23.5% | 98 | 25 | 100.3% |
| Van Nuys | $491,250 | 17.0% | 104 | 16.9% | 60 | -13.0% | 135 | 35 | 99.8% |
| Venice | $1,500,000 | 1.7% | 130 | -5.8% | 148 | -3.3% | 189 | 37 | 97.9% |
| Watts | $285,000 | 14.0% | 69 | 11.3% | 53 | -31.2% | 91 | 42 | 98.8% |
| West Adams | $555,750 | 18.2% | 42 | -6.7% | 29 | -3.3% | 65 | 25 | 101.2% |
| West Long Beach | $372,500 | 6.7% | 36 | -28.0% | 31 | -8.8% | 55 | 31 | 98.4% |
| West Los Angeles | $1,221,000 | 11.0% | 1,703 | -6.8% | 1,584 | 7.5% | 2,374 | 22 | 100.2% |
| Westwood | $950,000 | 7.3% | 135 | 1.5% | 119 | -7.8% | 172 | 26 | 99.5% |
| Woodland Hills | $710,000 | 6.8% | 263 | 4.0% | 257 | 33.2% | 407 | 35 | 98.9% |
| Los Angeles, CA | $590,000 | 7.3% | 2,771 | 2.0% | 6,516 | 6.8% | 3,748 | 29 | 100.2% |
See Redfin’s data center to find out what’s happening in other cities.
NOTE: Not all neighborhoods are listed, but totals for L.A. encompass entire city. Data is based on listing information and might not reflect all real estate activity in the market. Neighborhood-specific data is measured over the three months ended June 30. Inventory measures listings active as of June 30.
For more information, contact Redfin journalist services
Phone: 206-588-6863
Email: press@redfin.com
To be added to Redfin’s press release distribution list, subscribe here.


