
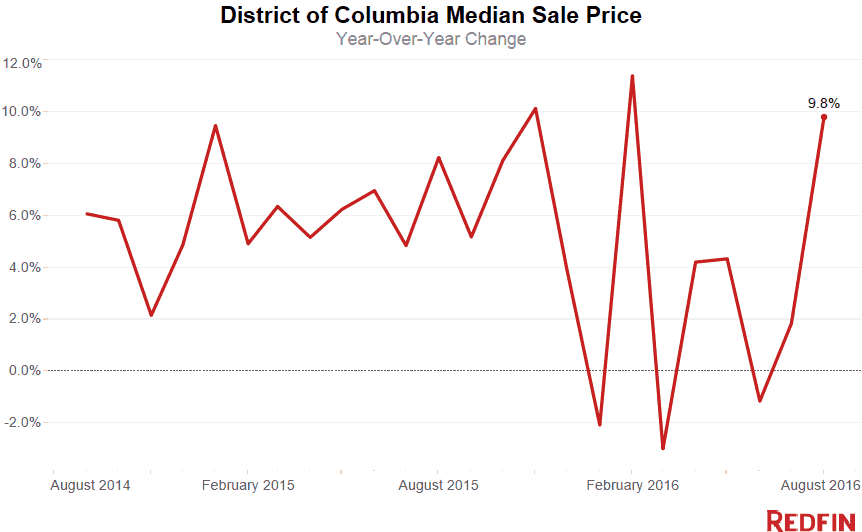
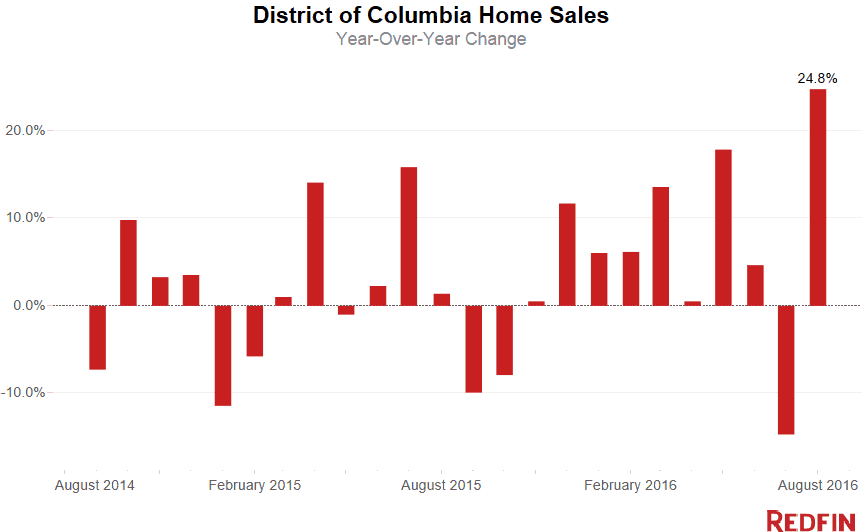
Washington, D.C., home prices increased 9.8 percent in August from a year earlier to a median sale price of $576,500. August sales surged 24.8 percent compared to last year. Some of the sales surge may be attributed to closings that were pushed into August from July, which had fewer business days than normal.
Overall, the District has had strong sales this year with year-over-year growth every month except July, despite the fact that the number of homes for sale remains low.
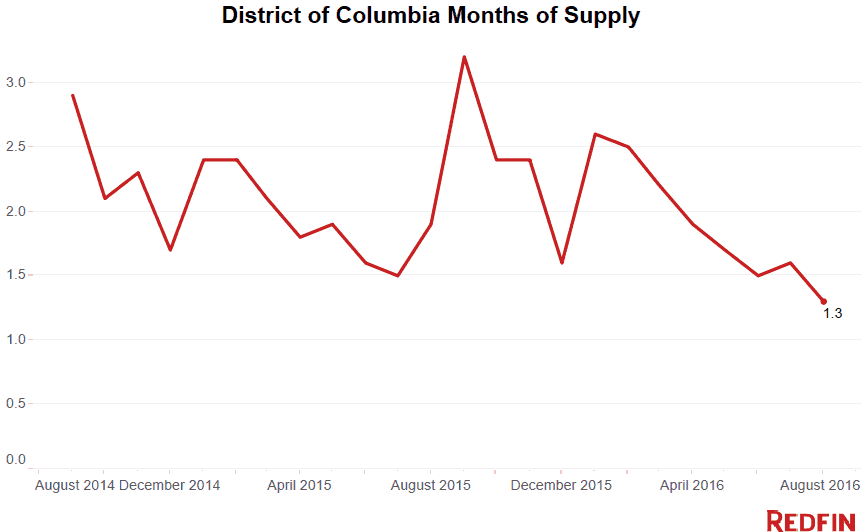
The overall number of homes for sale declined 13.4 percent since last August, resulting in just 1.3 months of supply on the market—the lowest level on record since 2009 and well below 6 months, which signals a balanced market.
Solid buyer demand coupled with the shortage of inventory kept conditions competitive. The typical home found a buyer in 18 days and 34.6 percent of homes were bid up, selling for more than their initial asking price.
What’s Happening in the D.C. Metro Region?
Across the broader D.C., Maryland and Virginia region, the median sale price gained 0.7 percent in August from last year, to $380,000. Home sales were up 24.4 percent compared to last year, matching strong sales growth in the District.
The number of homes listed in August fell 4 percent, pushing the total number of properties for sale down by 21.5 percent from last year. The region had a 2.2-month supply of homes for sale. The typical home found a buyer in 30 days.
Washington, D.C., Neighborhood Trends
A perennial favorite among buyers, Capitol Hill has seen a shortage of available homes for sale all year. Inventory was down 48.1 percent in August. The median sale price was up 7.3 percent to $850,000 and the average home was snapped up in 11 days.
The boom in residential and commercial development in Navy Yard and Southwest pushed home prices up 28 percent and 16 percent respectively. Buyers are drawn to new amenities and park spaces and the promise of a redeveloped waterfront.
In four neighborhoods, at least half of homes sold above their asking price: American University Park, Mount Pleasant, Petworth and Navy Yard.
See our city page for the most up-to-date data on Washington-area home prices.
Here’s what’s happening in your neighborhood:
| Place | Median Sale Price | Year-Over-Year | Homes Sold | Year-Over-Year | Inventory | Year-Over-Year | New Listings | Median Days on Market | Avg Sale-to-List |
|---|---|---|---|---|---|---|---|---|---|
| Adams Morgan / Kalorama Heights / Lanier Heights | $562,500 | 2.0% | 122 | -16.4% | 57 | 5.6% | 116 | 15 | 99.9% |
| Alexandria | $439,650 | -2.3% | 530 | -2.8% | 1,035 | -21.8% | 446 | 33 | 98.6% |
| American University Park / Friendship Heights / Tenleytown | $1,051,000 | 8.3% | 65 | 8.3% | 14 | -36.4% | 29 | 7 | 102.1% |
| Arlington | $518,750 | -4.6% | 288 | 9.9% | 616 | -12.9% | 258 | 25 | 99.0% |
| Atlas District | $659,900 | 1.8% | 79 | 41.1% | 27 | -6.9% | 62 | 10 | 100.5% |
| Bellevue / Congress Heights / Washington Highlands | $235,000 | 18.4% | 58 | 52.6% | 53 | 8.2% | 78 | 34 | 97.4% |
| Benning Heights / Capitol View / Marshall Heights | $240,625 | -1.4% | 50 | 28.2% | 33 | -26.7% | 62 | 17 | 102.5% |
| Bethesda | $863,900 | -2.9% | 137 | 53.9% | 347 | -5.5% | 101 | 39 | 97.5% |
| Bloomingdale | $680,000 | 0.1% | 65 | 80.6% | 10 | -28.6% | 42 | 18 | 100.1% |
| Capitol Hill | $850,000 | 7.3% | 127 | -13.0% | 27 | -48.1% | 85 | 11 | 99.8% |
| Chevy Chase-DC | $984,500 | 2.8% | 72 | 16.1% | 23 | -34.3% | 58 | 10 | 101.2% |
| Chinatown / Mount Vernon Square / Penn Quarter | $530,000 | 7.1% | 105 | -26.6% | 29 | -52.5% | 80 | 20 | 99.5% |
| Cleveland Park | $470,375 | -18.6% | 40 | -4.8% | 13 | -31.6% | 30 | 21 | 99.8% |
| College Park | $293,000 | 17.2% | 23 | 21.1% | 37 | -19.6% | 29 | 7 | 99.5% |
| Columbia Heights | $587,500 | 3.1% | 130 | 23.8% | 46 | -14.8% | 102 | 23 | 100.2% |
| Congress Heights | $249,500 | 6.6% | 32 | 166.7% | 33 | 37.5% | 42 | 44 | 98.2% |
| Dupont Circle | $428,950 | 0.4% | 146 | 17.7% | 43 | -14.0% | 114 | 12 | 100.0% |
| Eckington | $620,000 | -0.6% | 29 | 3.6% | 6 | -64.7% | 19 | 20 | 99.0% |
| Edgewood | $465,000 | -18.2% | 35 | 16.7% | 14 | 16.7% | 38 | 10 | 101.9% |
| Fairlawn / Twining / Randle Highlands / Penn Branch | $342,500 | 18.1% | 48 | 11.6% | 31 | -20.5% | 56 | 32 | 99.9% |
| Foggy Bottom / George Washington University / West End | $440,000 | 13.1% | 89 | 14.1% | 47 | -24.2% | 82 | 14 | 98.0% |
| Fort Totten / Lamont Riggs / Pleasant Hill / Queens Chapel | $474,900 | 17.0% | 43 | -4.4% | 10 | -60.0% | 29 | 18 | 100.6% |
| Foxhall / Palisades / Spring Valley / Wesley Heights | $1,328,900 | 21.8% | 84 | -4.5% | 64 | -3.0% | 64 | 34 | 97.7% |
| Georgetown | $1,225,000 | -2.0% | 77 | -13.5% | 58 | 28.9% | 74 | 22 | 97.6% |
| Glover Park / Cathedral Heights / McLean Gardens | $467,500 | 3.7% | 136 | -19.1% | 87 | 31.8% | 134 | 27 | 98.3% |
| Greenway / Benning / Dupont Park / River Terrace | $235,450 | 9.5% | 24 | 4.3% | 13 | -13.3% | 27 | 19 | 97.4% |
| Hill East | $755,000 | 9.4% | 87 | 0.0% | 22 | -15.4% | 62 | 9 | 101.3% |
| Historic Anacostia | $305,000 | 10.9% | 11 | 22.2% | 11 | 37.5% | 20 | 26 | 97.2% |
| Howard University / Le Droit Park | $657,000 | 8.2% | 78 | 5.4% | 28 | -12.5% | 77 | 13 | 100.7% |
| Logan Circle-Shaw | $655,000 | 6.1% | 98 | 21.0% | 24 | -17.2% | 100 | 10 | 100.6% |
| Logan Circle-Shaw | $640,000 | -3.4% | 119 | 29.3% | 28 | -33.3% | 112 | 12 | 99.9% |
| Massachusetts Avenue Heights | $379,900 | 5.5% | 47 | -13.0% | 28 | 40.0% | 55 | 25 | 98.6% |
| Mount Pleasant | $910,000 | 16.1% | 47 | 67.9% | 6 | 0.0% | 30 | 6 | 102.7% |
| Navy Yard | $537,500 | 28.0% | 14 | -17.6% | 6 | 200.0% | 15 | 18 | 99.9% |
| NoMa | $655,925 | -1.1% | 36 | 38.5% | 9 | -40.0% | 27 | 10 | 99.5% |
| Petworth | $650,000 | 6.6% | 81 | -14.7% | 46 | 43.8% | 106 | 10 | 101.0% |
| Pleasant Plains | $605,066 | 7.3% | 30 | -11.8% | 17 | 30.8% | 31 | 13 | 100.9% |
| Rockville | $559,950 | 24.2% | 198 | 78.4% | 444 | -12.3% | 200 | 31 | 98.5% |
| Silver Spring | $383,000 | 5.7% | 333 | 101.8% | 528 | -30.6% | 248 | 25 | 99.0% |
| Southwest / Waterfront | $360,000 | 16.1% | 51 | -23.9% | 21 | -19.2% | 51 | 19 | 99.3% |
| Stanton Park | $720,000 | 2.0% | 121 | 13.1% | 33 | -26.7% | 92 | 9 | 100.2% |
| Takoma | $494,750 | 26.9% | 12 | 9.1% | 4 | 300.0% | 12 | 7 | 101.0% |
| Trinidad / Arboretum / Ivy City | $460,000 | 10.6% | 63 | -12.5% | 45 | 36.4% | 72 | 25 | 99.9% |
| Truxton Circle | $640,000 | -12.9% | 21 | 90.9% | 4 | -71.4% | 12 | 37 | 96.7% |
| Union Station / Kingman Park / Stanton Park | $642,000 | 3.5% | 170 | 11.1% | 64 | -13.5% | 152 | 9 | 100.4% |
| Van Ness / Forest Hills / Wakefield | $500,000 | 3.1% | 44 | -10.2% | 15 | -31.8% | 37 | 17 | 99.6% |
| Woodley Park | $854,500 | 42.5% | 26 | 23.8% | 8 | -20.0% | 20 | 10 | 100.1% |
| Woodridge | $525,000 | NA | 1 | NA | NA | NA | NA | 278 | 100.0% |
| Woodridge-Fort Lincoln | $522,500 | 20.1% | 26 | 13.0% | 17 | -10.5% | 32 | 22 | 98.1% |
| Washington, DC | $576,500 | 9.8% | 946 | 24.8% | 1,232 | -13.4% | 688 | 18 | 99.5% |
NOTE: Not all neighborhoods are listed, but totals for Washington, D.C., encompass entire city. Data is based on listing information and might not reflect all real estate activity in the market. Neighborhood-specific data is measured over the three months ended August 31. Inventory measures listings active as of August 31.
For more information, contact Redfin jouralist services:
Phone: 206-588-6863
Email: press@redfin.com
See Redfin’s data center to find out what’s happening in other cities.
To be added to Redfin’s press release distribution list, subscribe here.


