
Home sales in September were up 3.2 percent from a year ago. Year-to-date homes sales were up 4 percent compared the same period last year.
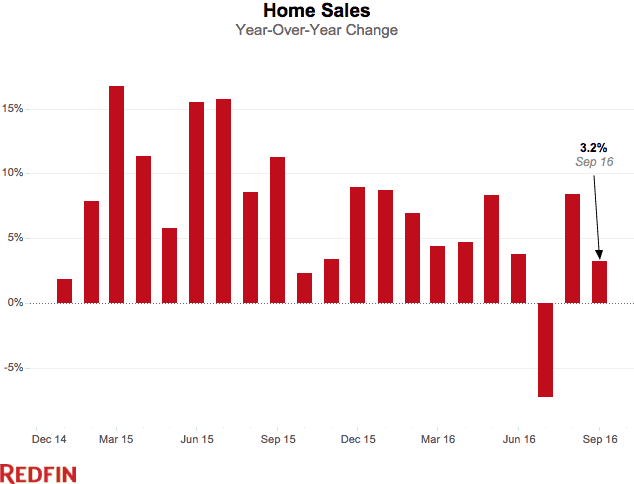
Strong buyer demand this fall has kept the market moving at a fast pace. The typical home sold in 46 days, four days faster than last year. About one in five homes sold in two weeks or less last month compared to one in six in 2015. In Denver, Seattle and Tacoma more than 50 percent of homes were under contract in two weeks.
| Market Summary | September 2016 | Month-Over-Month | Year-Over-Year |
|---|---|---|---|
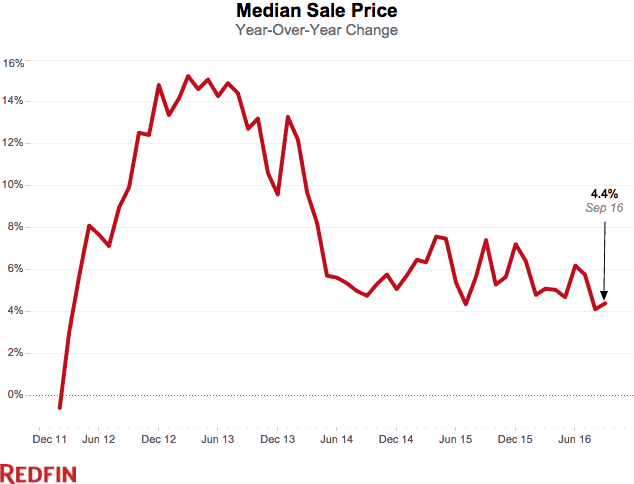
| Median sale price | $267,500 | -1.4% | 4.4% |
| Homes sold | 253,400 | -11.8% | 3.2% |
| New listings | 282,100 | -7.8% | 0.8% |
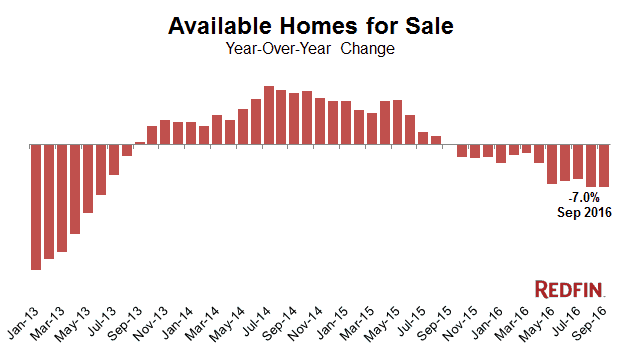
| All Homes for sale | 834,900 | -1.5% | -7.0% |
| Median days on market | 46 | 2 | -4 |
| Months of supply | 3.3 | 0.3 | -0.7 |
| Sold above list | 21.0% | -1.3% | 2.3% |
| Average Sale-to-list | 93.6% | -0.1% | -0.6% |
Median sale prices were up 4.4 percent year over year for the second month in a row. In a market with such a limited supply of inventory, this moderate price growth has given buyers some relief. The national median sale price fell slightly month over month to $267,500 in September. Compared to August, 11.8 percent fewer homes sold and 7.8 percent fewer homes were listed for sale, in line with a seasonal slowdown in housing activity heading into the last three months of the year.
“Here in Southern Florida, especially in the Southwest portion of Miami-Dade county, single family homes that are priced right are selling very quickly thanks to strong buyer demand,” said Redfin real estate agent in Miami Cecilia Cordova. “There are a lot of first-time homebuyers entering the market right now and they definitely seem to prefer single-family homes to condos. Unfortunately there’s a lack of single family homes for sale in their target price range, so homes that are available and priced below $400,000 usually always have multiple offers. This is causing some price growth for that specific portion of the market, but we aren’t seeing the same competition or price growth for more expensive homes.”
The Outlook for Inventory
New listings were relatively flat in September, up a mere 0.8% from a year earlier. All told, there were 7 percent fewer homes available for sale last month than in September 2015.
New construction has also fallen short of homebuyer demand, but there is some good news on this front. Though housing starts fell 9 percent in September year-over-year, the decline was mainly attributable to a pullback in the construction of apartment buildings. Single-family housing starts were almost 10 percent higher year-to-date in September than last year. However, the majority of building continues to be in the high-end segment. The lack of new construction of starter homes is a big challenge for a market that is fueled by millennial first-time buyers.
Though there is gathering strength for single-family-construction after years of weakness, it is still not enough to offset continued declines in existing inventory. We expect low inventory to be a permanent fixture in the 2017 housing market.
Other September Highlights
Prices
- Deltona, FL had the nation’s highest price growth, rising 17.2% since last year to $169,950.
- 7 cities saw price declines of more than 1% in September. Edison, NJ declined the most since last year falling -8.1 percent to $285,000.
Competition
- Seattle, WA was the fastest market, with half of all homes pending sale in just 12 days, down from 13 days from a year earlier. Denver, CO and Grand Rapids, MI were the next fastest markets, each with 14 median days on market.
- Competitive homes were in San Francisco, CA where 60.6% of homes sold above list price, followed by 56.4% in Oakland, CA and 55.0% in San Jose, CA. In sharp contrast, the sold above list percentage equaled 0.0% in Pittsburgh, PA, Poughkeepsie, NY, Kansas City, MO, and Baton Rouge, LA.
Inventory
- Fresno, CA had the largest decrease in overall inventory, falling 29.2% since last September. Portsmouth, NH (-28.1%), Madison, WI (-27.1%), and Rochester, NH (-26.4%) also continued seeing far fewer homes available on the market than a year ago.
- St. Louis, MO had the highest increase in the number of homes for sale, up 29.9% year over year, followed by Provo, UT (29.7%) and San Francisco, CA (22.3%).
Median Sale Price
| Redfin Metro | Median Sale Price | Month-Over-Month | Year-Over-Year |
|---|---|---|---|
| Atlanta, GA | $200,000 | -2.8% | 5.3% |
| Baltimore, MD | $255,000 | -1.5% | 2.0% |
| Boston, MA | $368,800 | -5.4% | 5.4% |
| Chicago, IL | $219,900 | -4.9% | 6.7% |
| Cleveland, OH | $134,000 | -2.2% | 3.1% |
| Dallas-Fort Worth, TX | $232,000 | -1.3% | 11.5% |
| Denver, CO | $345,000 | -0.3% | 12.9% |
| Detroit, MI | $162,500 | 1.6% | 8.3% |
| Edison, NJ | $285,000 | -1.7% | -8.1% |
| Houston, TX | $216,500 | -3.3% | 5.6% |
| Kansas City, MO | $185,000 | -2.1% | 9.5% |
| Las Vegas, NV | $215,000 | 0.0% | 7.5% |
| Long Island, NY | $403,000 | -2.9% | 5.3% |
| Los Angeles, CA | $530,000 | -2.3% | 6.2% |
| Miami, FL | $265,000 | 3.1% | 11.5% |
| Minneapolis-St. Paul, MN | $235,000 | -2.1% | 4.9% |
| Oakland, CA | $610,000 | -0.9% | 8.0% |
| Orange County, CA | $620,000 | -2.7% | 3.3% |
| Orlando, FL | $205,000 | -1.4% | 12.0% |
| Philadelphia, PA | $232,000 | -5.3% | 3.1% |
| Phoenix, AZ | $233,000 | 1.3% | 8.4% |
| Pittsburgh, PA | $150,000 | 0.0% | 4.2% |
| Portland, OR | $340,000 | -1.2% | 13.3% |
| Riverside-San Bernardino, CA | $320,000 | 0.3% | 7.1% |
| Sacramento, CA | $344,500 | -1.6% | 10.2% |
| San Antonio, TX | $198,000 | -2.5% | 4.2% |
| San Diego, CA | $500,000 | 0.0% | 7.5% |
| Seattle, WA | $450,000 | 0.0% | 12.5% |
| St. Louis, MO | $165,000 | -2.9% | 0.0% |
| Tampa, FL | $189,900 | -1.6% | 15.2% |
| Washington, DC | $360,000 | -4.5% | 2.4% |
| National | $267,500 | -1.4% | 4.4% |
All Homes for Sale
| Redfin Metro | All Homes for Sale | Month-Over-Month | Year-Over-Year |
|---|---|---|---|
| Atlanta, GA | 34,098 | 5.0% | -0.4% |
| Baltimore, MD | 12,290 | -2.2% | -16.8% |
| Boston, MA | 14,050 | 5.1% | -24.2% |
| Chicago, IL | 46,758 | -3.9% | -10.0% |
| Cleveland, OH | 9,835 | -6.1% | -19.5% |
| Dallas-Fort Worth, TX | 16,392 | -10.6% | -16.4% |
| Denver, CO | 7,917 | -0.1% | -17.4% |
| Detroit, MI | 15,067 | -5.8% | -24.4% |
| Edison, NJ | 14,792 | -5.3% | -12.3% |
| Houston, TX | 24,509 | -4.0% | 5.2% |
| Las Vegas, NV | 13,019 | -3.1% | -8.5% |
| Long Island, NY | 12,158 | -4.9% | -21.6% |
| Los Angeles, CA | 18,261 | -1.0% | 8.1% |
| Miami, FL | 17,988 | -0.2% | 6.1% |
| Minneapolis-St. Paul, MN | 13,601 | -2.3% | -12.9% |
| Oakland, CA | 3,765 | -2.6% | -5.9% |
| Orange County, CA | 8,355 | -6.5% | 8.2% |
| Orlando, FL | 10,839 | -4.9% | -17.5% |
| Philadelphia, PA | 16,750 | 1.8% | -18.0% |
| Phoenix, AZ | 21,343 | 0.2% | -1.1% |
| Portland, OR | 7,265 | -3.5% | -2.4% |
| Riverside-San Bernardino, CA | 16,858 | -0.8% | 5.8% |
| Sacramento, CA | 6,163 | -6.8% | -10.2% |
| San Antonio, TX | 7,091 | -10.5% | -10.0% |
| San Diego, CA | 6,595 | -9.6% | -15.4% |
| Seattle, WA | 6,636 | 1.6% | -5.8% |
| St. Louis, MO | 15,172 | 4.3% | 29.9% |
| Tampa, FL | 14,898 | -3.1% | -8.4% |
| Washington, DC | 19,077 | -0.9% | -21.2% |
| National | 834,900 | -1.5% | -7.0% |
New Listings
| Redfin Metro | New Listings | Month-Over-Month | Year-Over-Year |
|---|---|---|---|
| Atlanta, GA | 9,774 | -6.1% | 6.7% |
| Baltimore, MD | 4,133 | -1.0% | -5.2% |
| Boston, MA | 7,837 | 20.7% | -5.4% |
| Chicago, IL | 11,833 | -10.3% | -4.1% |
| Cleveland, OH | 2,631 | -12.3% | -12.2% |
| Dallas-Fort Worth, TX | 8,480 | -12.5% | -1.4% |
| Denver, CO | 5,523 | -8.8% | -0.3% |
| Detroit, MI | 6,109 | -17.8% | -5.7% |
| Edison, NJ | 3,408 | -7.0% | -3.6% |
| Houston, TX | 8,022 | -11.3% | -3.3% |
| Kansas City, MO | 3,291 | -6.6% | 20.3% |
| Las Vegas, NV | 3,827 | -8.5% | -3.0% |
| Long Island, NY | 2,817 | -4.0% | -9.1% |
| Los Angeles, CA | 8,984 | -4.3% | 14.5% |
| Miami, FL | 4,384 | 3.0% | 3.5% |
| Minneapolis-St. Paul, MN | 5,606 | -9.7% | 6.6% |
| Oakland, CA | 2,856 | -0.6% | -4.1% |
| Orange County, CA | 3,260 | -12.1% | 10.2% |
| Orlando, FL | 3,914 | -9.2% | 0.1% |
| Philadelphia, PA | 5,039 | 4.1% | -2.6% |
| Phoenix, AZ | 8,889 | 7.0% | 3.6% |
| Pittsburgh, PA | 2,044 | -15.0% | -2.2% |
| Portland, OR | 3,999 | -18.2% | 2.7% |
| Riverside-San Bernardino, CA | 6,773 | -5.8% | 15.2% |
| Sacramento, CA | 3,275 | -10.7% | 5.3% |
| San Antonio, TX | 2,437 | -17.1% | -3.9% |
| San Diego, CA | 3,349 | -15.0% | -2.3% |
| Seattle, WA | 5,148 | -2.6% | 17.6% |
| St. Louis, MO | 3,999 | -9.8% | 15.2% |
| Tampa, FL | 5,401 | -7.8% | 3.4% |
| Washington, DC | 8,599 | 7.2% | -3.7% |
| National | 282,100 | -7.8% | 0.8% |
Homes Sold
| Redfin Metro | Homes Sold | Month-Over-Month | Year-Over-Year |
|---|---|---|---|
| Atlanta, GA | 9,801 | -9.5% | 5.2% |
| Baltimore, MD | 3,335 | -15.0% | 5.9% |
| Boston, MA | 5,979 | -20.7% | 1.9% |
| Chicago, IL | 10,824 | -26.2% | 0.0% |
| Cleveland, OH | 2,404 | -11.3% | -0.5% |
| Dallas-Fort Worth, TX | 7,932 | -14.0% | -1.7% |
| Denver, CO | 5,825 | 3.0% | -0.4% |
| Detroit, MI | 6,206 | -20.7% | -3.5% |
| Edison, NJ | 2,730 | -24.0% | 11.6% |
| Houston, TX | 6,823 | -17.4% | -2.3% |
| Kansas City, MO | 3,130 | -8.9% | 17.9% |
| Las Vegas, NV | 3,403 | -7.1% | 9.0% |
| Long Island, NY | 2,443 | -25.0% | -0.6% |
| Los Angeles, CA | 6,821 | -4.1% | 2.9% |
| Miami, FL | 2,597 | -12.1% | -12.9% |
| Minneapolis-St. Paul, MN | 6,944 | -6.7% | 6.1% |
| Oakland, CA | 2,580 | -7.5% | -2.1% |
| Orange County, CA | 2,741 | -9.7% | 2.3% |
| Orlando, FL | 3,787 | -16.8% | -0.4% |
| Philadelphia, PA | 4,057 | -17.3% | 7.6% |
| Phoenix, AZ | 7,360 | -7.1% | 6.4% |
| Pittsburgh, PA | 1,987 | -8.3% | 6.5% |
| Portland, OR | 3,688 | -10.0% | -3.2% |
| Riverside-San Bernardino, CA | 5,019 | -4.6% | 9.8% |
| Sacramento, CA | 2,925 | -11.3% | 0.6% |
| San Antonio, TX | 2,323 | -13.6% | 7.2% |
| San Diego, CA | 3,294 | -8.7% | 3.8% |
| Seattle, WA | 4,735 | -9.8% | 7.7% |
| St. Louis, MO | 3,644 | -18.4% | 30.5% |
| Tampa, FL | 5,841 | 3.2% | 1.8% |
| Washington, DC | 7,013 | -16.9% | 2.5% |
| National | 253,400 | -11.8% | 3.2% |


