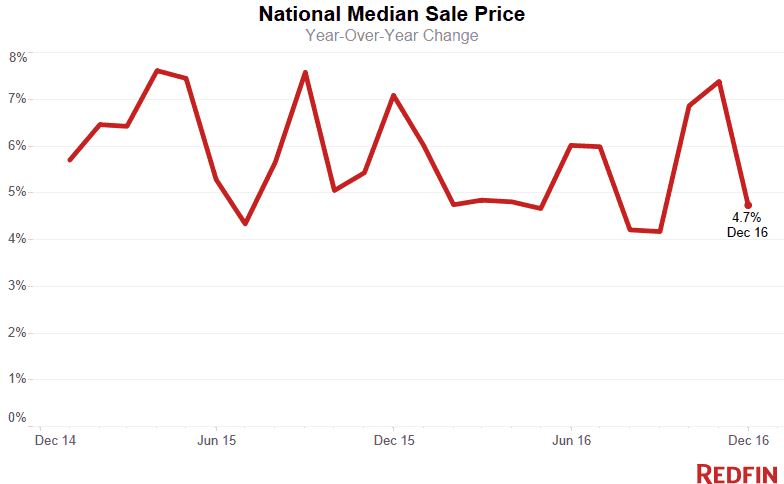
The median home sale price rose 4.7 percent to $267,600 in December, continuing a steady trend of growth that we expect to continue this year. Home sales were essentially flat compared to last December, increasing 0.5 percent, while inventory posted its largest year-over-year decline since April 2013, falling 12.7 percent.
December is typically a slow month for new listings, and 2016 was no exception. The number of new homes for sale added to the market fell 5.0 percent compared to 2015 and declined 26.8 percent from the month prior. Following an extraordinarily strong November for home sales, there were very few homes left to choose from in December, leaving the total number of homes for sale in the markets Redfin tracks the lowest it has been in three years.
“Prospective sellers were hesitant to list last month,” said Redfin chief economist Nela Richardson. “Many of them are also buyers, and two transactions are much harder to pull off in a fast-paced, low-inventory environment than one. We expect sellers to list early in 2017, not only to make top dollar from eager buyers, but also to be in a position to act quickly when it comes time to make their next home purchase.”
| Market Summary | December 2017 | Month-Over-Month | Year-Over-Year |
|---|---|---|---|
| Median sale price | $267,600 | -1.2% | 4.7% |
| Homes sold | 228,800 | 3.6% | 0.5% |
| New listings | 151,400 | -26.7% | -5.0% |
| All Homes for sale | 657,800 | -12.8% | -12.7% |
| Median days on market | 54 | 3 | -5 |
| Months of supply | 2.9 | -0.5 | -0.4 |
| Sold above list | 18.6% | -1.3% | 0.3% |
| Average Sale-to-list | 93.4% | -1.2% | -0.6% |
While home sales were tepid, the extreme lack of inventory kept the market moving quickly. The typical home went under contract in 54 days — five days faster than December 2015 and the fastest December on record since Redfin began tracking this data in 2010.
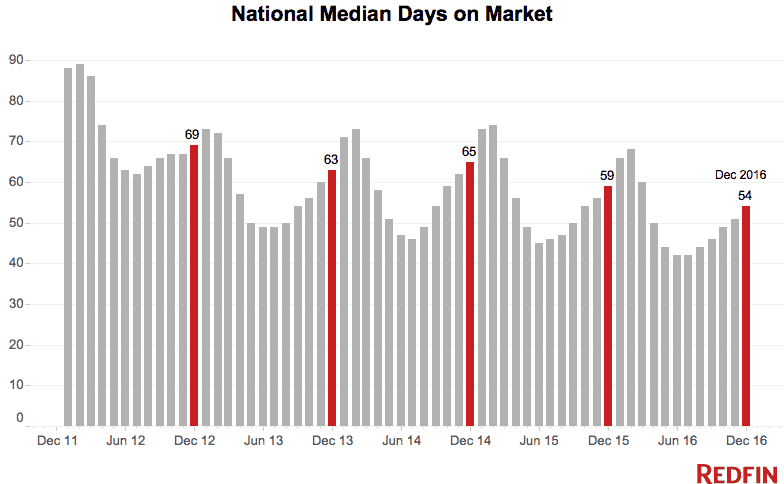
Among homes that sold in December, just shy of one-third (32.7%) went under contract within two weeks — the largest reduction in inventory in any single month on record.
“We’ve never before seen homes turn over so quickly at a national level,” said Redfin Chief Economist Nela Richardson. “This tells us that buyers are not deterred by low inventory, election uncertainty and slightly higher mortgage rates. If anything, these headwinds are motivating them to act sooner rather than later.”
The increased speed of the market was also felt locally as well, especially in the nation’s most competitive markets, such as Seattle, Washington. As inventory continues to tighten, Redfin agents are seeing a change in the way clients are approaching the homebuying process.
“Homebuyers acted with a great deal of speed and purpose this December,” said Redfin Seattle real estate agent Paul Bettinson. “In years past, buyers who didn’t find a home by December typically went into hibernation for the winter, holding off until the spring selling season. Now everyone is taking a second look at the homes that may need a little TLC. In general, today’s buyers are well-equipped to move quickly — they’ve done their research, know the market and are very motivated to make it happen.”
Other December Highlights
Competition
- Seattle, WA was the fastest market, with half of all homes pending sale in just 19 days, down from 24 days from a year earlier. Oakland, CA and Denver, CO were the next fastest markets, both posting a median of 22 days on market, followed by Grand Rapids, MI (23) and Boston, MA (26).
- The most competition was seen in San Francisco, CA, where 52.0% of homes sold above list price, followed by 51.7% in Oakland, CA, 50.1% in San Jose, CA, 38.4% in Seattle, WA, and 36.6% in Tacoma, WA.
Prices
- Seattle, WA had the nation’s highest price growth, rising 14.8% since 2015 to $459,975.
- Tampa, FL had the second highest growth, up 14.0% year over year, followed by Jacksonville, FL (13.6%), Nashville, TN (13.0%) and Lakeland, FL (12.8%).
- Six metros saw price declines in December. Baton Rouge, LA saw its home prices decline the most since 2015, falling 7.7 percent to $175,370.
Sales
- 13 out of 90 metros saw sales increase by double digits from 2015. Poughkeepsie, NY led the nation in year-over-year sales growth, up 57.9%, followed by Madison, WI, up 32.0%. Detroit, MI rounded out the top three with sales up 30.8% from a year ago.
- Santa Rosa, CA saw the largest decline in sales since 2015, falling 25.5%. Home sales in Columbia, SC and San Jose, CA declined by 24.0% and 16.8%, respectively.
Inventory
- Detroit, MI had the largest decrease in overall inventory, falling 31.2% since December 2015. Rochester, NH (-30.7%), Portsmouth, NH (-29.4%) and Rochester, NY (-28.7%) also saw far fewer homes available on the market than a year ago.
- Austin, TX, North Port, FL and Los Angeles, CA, all posted the biggest year-over-year increases, up 6.3% in each metro area, followed by Miami, FL (5.1%) and Provo, UT (4.8%).
Below are market-by-market breakdowns for prices, inventory, new listings and sales for markets with populations of 1.5 million or more. For downloadable data on all of the markets Redfin tracks, visit the Redfin Data Center.
Median Sale Price
| Redfin Metro | Median Sale Price | Month-Over-Month | Year-Over-Year |
|---|---|---|---|
| Atlanta, GA | $201,000 | 0.5% | 5.8% |
| Austin, TX | $287,000 | -1.0% | 4.4% |
| Baltimore, MD | $246,400 | 1.6% | 2.7% |
| Boston, MA | $370,000 | -1.3% | 5.7% |
| Charlotte, NC | $210,000 | -0.2% | 12.3% |
| Chicago, IL | $215,000 | 0.5% | 7.6% |
| Cincinnati, OH | $150,000 | -3.2% | 2.0% |
| Cleveland, OH | $127,500 | 2.0% | 6.3% |
| Columbus, OH | $169,900 | -2.9% | 8.2% |
| Dallas-Fort Worth, TX | $242,000 | 0.9% | 11.5% |
| Denver, CO | $345,000 | -0.3% | 11.3% |
| Detroit, MI | $157,600 | 3.0% | 8.7% |
| Edison, NJ | $278,000 | -2.5% | 1.1% |
| Fort Lauderdale, FL | $225,000 | 0.0% | 8.7% |
| Hampton Roads, VA | $214,500 | -0.2% | -0.2% |
| Houston, TX | $226,000 | 0.4% | 4.4% |
| Indianapolis, IN | $156,000 | 0.6% | 7.6% |
| Kansas City, MO | $175,000 | 0.0% | 1.7% |
| Las Vegas, NV | $215,000 | -2.3% | 7.5% |
| Long Island, NY | $409,000 | 2.8% | 7.6% |
| Los Angeles, CA | $533,000 | -1.3% | 5.0% |
| Miami, FL | $255,000 | -1.9% | 4.1% |
| Milwaukee, WI | $173,400 | -3.7% | 1.0% |
| Minneapolis-St. Paul, MN | $230,000 | -0.7% | 4.6% |
| Nashville, TN | $259,900 | 5.6% | 13.0% |
| Oakland, CA | $604,000 | -4.9% | 6.9% |
| Orange County, CA | $630,000 | -0.8% | 5.0% |
| Orlando, FL | $208,000 | 1.5% | 12.4% |
| Philadelphia, PA | $229,000 | -0.4% | 4.1% |
| Phoenix, AZ | $228,900 | -0.4% | 4.8% |
| Pittsburgh, PA | $144,900 | -0.2% | 3.5% |
| Portland, OR | $335,000 | -1.5% | 8.1% |
| Riverside-San Bernardino, CA | $325,000 | 1.6% | 6.6% |
| Sacramento, CA | $337,000 | -2.3% | 5.6% |
| San Antonio, TX | $201,500 | 3.3% | 5.2% |
| San Diego, CA | $507,500 | 2.1% | 8.0% |
| San Francisco, CA | $1,100,500 | 0.0% | 4.8% |
| San Jose, CA | $838,500 | -4.2% | 2.3% |
| Seattle, WA | $460,000 | 1.1% | 14.8% |
| St. Louis, MO | $164,000 | 2.5% | 4.0% |
| Tampa, FL | $196,000 | 3.2% | 14.0% |
| Washington, DC | $375,000 | 1.4% | 3.4% |
| National | $267,600 | -1.2% | 4.7% |
Homes Sold
| Redfin Metro | Homes Sold | Month-Over-Month | Year-Over-Year |
|---|---|---|---|
| Atlanta, GA | 8,916 | 3.8% | 3.2% |
| Austin, TX | 2,438 | 11.1% | -1.0% |
| Baltimore, MD | 3,334 | 10.1% | 4.5% |
| Boston, MA | 5,679 | 0.2% | -4.1% |
| Charlotte, NC | 2,665 | 7.9% | 3.6% |
| Chicago, IL | 8,777 | 0.6% | -2.9% |
| Cincinnati, OH | 1,878 | 2.0% | 1.2% |
| Cleveland, OH | 2,123 | 0.4% | -1.5% |
| Columbus, OH | 2,190 | -1.6% | -0.1% |
| Dallas-Fort Worth, TX | 7,005 | 2.1% | -9.4% |
| Denver, CO | 4,730 | 2.3% | -2.9% |
| Detroit, MI | 5,839 | -2.3% | 30.8% |
| Edison, NJ | 3,056 | 14.0% | 22.5% |
| Fort Lauderdale, FL | 3,162 | 15.2% | -9.6% |
| Hampton Roads, VA | 1,811 | 13.4% | 0.6% |
| Houston, TX | 6,722 | 12.6% | 0.8% |
| Indianapolis, IN | 2,341 | 4.7% | -0.4% |
| Kansas City, MO | 2,534 | -1.0% | 8.4% |
| Las Vegas, NV | 3,381 | 6.0% | 2.4% |
| Long Island, NY | 2,493 | -12.5% | 13.1% |
| Los Angeles, CA | 6,368 | 4.9% | -4.5% |
| Miami, FL | 2,761 | 20.4% | -7.6% |
| Milwaukee, WI | 1,462 | -3.4% | -0.8% |
| Minneapolis-St. Paul, MN | 4,968 | -1.4% | 9.5% |
| Nashville, TN | 3,033 | 6.1% | 3.3% |
| Oakland, CA | 2,112 | -13.4% | -15.5% |
| Orange County, CA | 2,452 | -0.6% | -2.8% |
| Orlando, FL | 3,904 | 32.2% | 8.2% |
| Philadelphia, PA | 4,405 | 9.9% | 11.6% |
| Phoenix, AZ | 7,087 | 4.9% | 6.2% |
| Pittsburgh, PA | 1,848 | -4.6% | -4.7% |
| Portland, OR | 3,527 | 5.2% | -2.0% |
| Riverside-San Bernardino, CA | 4,611 | 0.3% | -1.2% |
| Sacramento, CA | 2,662 | 0.6% | -4.3% |
| San Antonio, TX | 2,122 | 7.4% | -1.1% |
| San Diego, CA | 2,892 | -4.0% | -8.0% |
| San Francisco, CA | 1,060 | -13.4% | -14.5% |
| San Jose, CA | 1,128 | -14.4% | -16.8% |
| Seattle, WA | 3,760 | -8.6% | -2.8% |
| St. Louis, MO | 3,218 | 7.2% | 22.8% |
| Tampa, FL | 5,401 | 16.9% | 5.1% |
| Washington, DC | 6,939 | 9.6% | -3.4% |
| National | 228,800 | 3.6% | 0.5% |
All Homes for Sale
| Redfin Metro | All Homes for Sale | Month-Over-Month | Year-Over-Year |
|---|---|---|---|
| Atlanta, GA | 27,609 | -12.1% | -11.7% |
| Austin, TX | 5,282 | -12.4% | 6.3% |
| Baltimore, MD | 9,440 | -14.0% | -21.2% |
| Boston, MA | 8,695 | -23.2% | -28.1% |
| Charlotte, NC | 7,760 | -15.2% | -13.2% |
| Chicago, IL | 33,688 | -16.1% | -13.8% |
| Cincinnati, OH | 6,683 | -16.2% | -17.3% |
| Cleveland, OH | 7,731 | -14.5% | -22.3% |
| Columbus, OH | 5,439 | -18.4% | -13.4% |
| Dallas-Fort Worth, TX | 13,135 | -20.8% | -13.8% |
| Denver, CO | 4,637 | -23.6% | -23.0% |
| Detroit, MI | 11,130 | -14.8% | -31.2% |
| Edison, NJ | 11,381 | -12.4% | -12.9% |
| Fort Lauderdale, FL | 13,115 | -3.0% | -10.4% |
| Hampton Roads, VA | 6,919 | -10.6% | -11.4% |
| Houston, TX | 21,244 | -9.7% | 0.9% |
| Indianapolis, IN | 6,336 | -15.6% | -20.1% |
| Las Vegas, NV | 10,405 | -12.5% | -19.3% |
| Long Island, NY | 9,499 | -11.9% | -23.9% |
| Los Angeles, CA | 13,415 | -21.0% | 6.3% |
| Miami, FL | 18,123 | -2.0% | 5.1% |
| Milwaukee, WI | 4,940 | -16.6% | -18.0% |
| Minneapolis-St. Paul, MN | 8,129 | -22.9% | -21.3% |
| Nashville, TN | 7,610 | -11.7% | 4.2% |
| Oakland, CA | 1,720 | -35.4% | -7.3% |
| Orange County, CA | 5,505 | -23.0% | 3.4% |
| Orlando, FL | 9,454 | -10.5% | -22.3% |
| Philadelphia, PA | 12,857 | -12.8% | -21.5% |
| Phoenix, AZ | 20,152 | -10.4% | -7.7% |
| Pittsburgh, PA | 7,894 | -10.7% | -16.1% |
| Portland, OR | 4,715 | -18.9% | -3.3% |
| Riverside-San Bernardino, CA | 14,697 | -13.6% | -1.3% |
| Sacramento, CA | 3,698 | -23.5% | -18.3% |
| San Antonio, TX | 6,228 | -13.5% | -14.2% |
| San Diego, CA | 4,621 | -20.5% | -20.4% |
| San Francisco, CA | 1,070 | -42.5% | 1.7% |
| San Jose, CA | 1,072 | -40.7% | -3.9% |
| Seattle, WA | 3,145 | -29.5% | -23.1% |
| St. Louis, MO | 10,235 | -17.2% | 3.1% |
| Tampa, FL | 12,700 | -8.4% | -18.3% |
| Washington, DC | 13,304 | -18.2% | -22.7% |
| National | 657,800 | -12.8% | -12.7% |
New Listings
| Redfin Metro | New Listings | Month-Over-Month | Year-Over-Year |
|---|---|---|---|
| Atlanta, GA | 5,477 | -24.5% | -5.2% |
| Austin, TX | 1,603 | -22.9% | 6.6% |
| Baltimore, MD | 2,331 | -23.2% | -4.7% |
| Boston, MA | 2,467 | -42.2% | -12.5% |
| Charlotte, NC | 1,624 | -25.2% | 6.5% |
| Chicago, IL | 5,098 | -31.2% | -16.1% |
| Cincinnati, OH | 1,128 | -31.5% | -10.4% |
| Cleveland, OH | 1,384 | -32.4% | -11.3% |
| Columbus, OH | 1,346 | -32.4% | 7.7% |
| Dallas-Fort Worth, TX | 5,004 | -25.8% | -3.2% |
| Denver, CO | 2,264 | -33.9% | 6.0% |
| Detroit, MI | 3,175 | -29.1% | -13.8% |
| Edison, NJ | 1,880 | -24.2% | 8.4% |
| Fort Lauderdale, FL | 3,203 | -14.4% | -5.9% |
| Hampton Roads, VA | 1,281 | -28.1% | -8.7% |
| Houston, TX | 5,059 | -22.5% | -3.4% |
| Indianapolis, IN | 1,439 | -28.9% | -2.1% |
| Kansas City, MO | 1,529 | -35.2% | -1.5% |
| Las Vegas, NV | 2,463 | -19.6% | -4.9% |
| Long Island, NY | 1,428 | -32.0% | -13.5% |
| Los Angeles, CA | 3,813 | -32.7% | -12.5% |
| Miami, FL | 3,425 | -13.0% | -2.9% |
| Milwaukee, WI | 672 | -36.6% | -22.7% |
| Minneapolis-St. Paul, MN | 1,929 | -37.5% | -10.7% |
| Nashville, TN | 1,960 | -29.1% | -5.7% |
| Oakland, CA | 1,003 | -40.0% | -2.1% |
| Orange County, CA | 1,364 | -31.7% | -15.2% |
| Orlando, FL | 2,743 | -21.4% | -11.1% |
| Philadelphia, PA | 2,513 | -28.7% | -10.2% |
| Phoenix, AZ | 5,714 | -24.6% | 3.5% |
| Pittsburgh, PA | 982 | -33.1% | 6.2% |
| Portland, OR | 1,615 | -31.0% | -14.2% |
| Riverside-San Bernardino, CA | 3,407 | -30.6% | -14.2% |
| Sacramento, CA | 1,446 | -29.9% | -6.8% |
| San Antonio, TX | 1,728 | -17.4% | 1.1% |
| San Diego, CA | 1,734 | -29.7% | -7.6% |
| San Francisco, CA | 343 | -51.8% | -19.5% |
| San Jose, CA | 433 | -48.9% | -23.6% |
| Seattle, WA | 1,758 | -33.0% | -6.0% |
| St. Louis, MO | 2,117 | -25.8% | 9.3% |
| Tampa, FL | 4,220 | -17.8% | -1.6% |
| Washington, DC | 4,353 | -24.4% | -1.0% |
| National | 151,400 | -26.7% | -5.0% |
 United States
 Canada