
In an analysis of a sample of nearly one million Redfin.com users searching for homes across 75 metro areas in the first three months of 2017, we found that one in five (19.8%) searched mostly1 for homes outside their home metro2. Among them, about half searched exclusively in other metros. Three trends dominated the migration patterns seen in Redfin.com user searches last quarter:
- Movement of Bay Area residents to more affordable metro areas dominated the nation’s migration patterns in the first quarter.
- Metro areas in the South attracted migrants from the coasts.
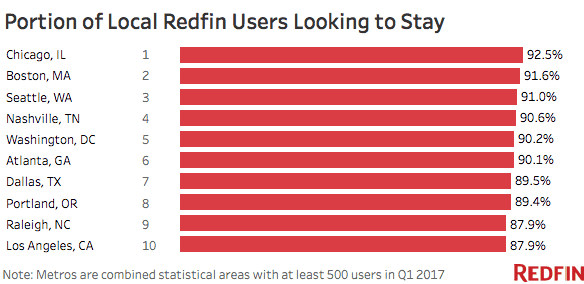
- Chicago, Boston and Seattle had perhaps the most dedicated residents, with more than nine out of 10 local users planning to stay in the area.
Trend #1: California Leavin’
We found that some of the most expensive metros had the largest net outflow—the number of local users searching for a home in a different metro minus the number of users from another metro searching for a home in the subject metro. The San Francisco Bay Area topped the list of places with the largest net outflow, followed by New York and Los Angeles.
| Table: Top 10 Metros by Net Outflow of Users and Their Top Destinations | |||||
| Rank | Metro* | Net Outflow† | Portion of Local Users Searching Elsewhere | Top Destination | Top Out-of-State Destination |
|---|---|---|---|---|---|
| 1 | San Francisco, CA | -15,087 | 19.4% | Sacramento, CA | Seattle, WA |
| 2 | New York, NY | -7,137 | 23.3% | Philadelphia, PA | Philadelphia, PA |
| 3 | Los Angeles, CA | -5,367 | 12.1% | San Diego, CA | Las Vegas, NV |
| 4 | Washington, DC | -4,054 | 9.8% | Philadelphia, PA | Philadelphia, PA |
| 5 | Chicago, IL | -2,687 | 7.5% | Los Angeles, CA | Los Angeles, CA |
| 6 | Houston, TX | -823 | 25.4% | Austin, TX | Los Angeles, CA |
| 7 | Boston, MA | -710 | 8.4% | Portland, ME | Portland, ME |
| 8 | Dayton, OH | -97 | 51.8% | Cincinnati, OH | Chicago, IL |
| 9 | St. Louis, MO | -39 | 22.1% | Chicago, IL | Chicago, IL |
| 10 | Buffalo, NY | -34 | 29.7% | Rochester, NY | Washington, DC |
| *Combined statistical areas with at least 500 users in Q1 2017 †Among the one million users sampled for this analysis only |
|||||
The results correlated closely to actual purchases of Redfin home-buying customers made within and across metros.3 We have been tracking the migration of Bay Area residents for six years. As the price of the typical home in the Bay Area has surged to over a million dollars, residents are increasingly likely to seek more affordable places to live. But this trend isn’t unique to Silicon Valley—it is happening in many other expensive metros as well.
Nearby and much more affordable Sacramento, CA, was the most popular search destination for Bay Area residents looking to leave, with 22.4 percent of users based in the Bay Area searching for homes in Sacramento. New Yorkers followed suit in looking to a cheaper market by searching in Philadelphia—the destination of choice for one in eight of those looking to leave the New York area.
Philadelphia was also the most popular destination among people looking to leave the Washington, D.C. metro area, which ranked fourth in net outflow overall. Median home prices in Philadelphia were just 59 percent of the $375,000 paid for a typical home in D.C. in March.
At the state level, California had the largest net outflow of users last quarter.4 As the Bay Area residents of Northern California looked north to the booming tech hubs of Seattle and Portland, Southern Californians went east to the more affordable places in the Southwest, like Las Vegas and Phoenix—which saw their populations grow immensely in 2016. These and other southern metros took in large inflows of people from the East Coast as well.
Trend #2: A Movement to the South
| Table: Top 10 Metros by Net Inflow of Users and Their Top Origins | |||||
| Rank | Metro* | Net Inflow† | Portion of Searches from Users Outside the Metro | Top Origin | Top Out-of-State Origin |
|---|---|---|---|---|---|
| 1 | Sacramento, CA | 4,032 | 35.4% | San Francisco, CA | Seattle, WA |
| 2 | Phoenix, AZ | 2,779 | 27.9% | Los Angeles, CA | Los Angeles, CA |
| 3 | Las Vegas, NV | 2,581 | 35.9% | Los Angeles, CA | Los Angeles, CA |
| 4 | Dallas, TX | 2,115 | 22.5% | Los Angeles, CA | Los Angeles, CA |
| 5 | Atlanta, GA | 1,600 | 20.0% | Washington, DC | Washington, DC |
| 6 | Portland, OR | 1,555 | 15.1% | San Francisco, CA | San Francisco, CA |
| 7 | Tampa, FL | 1,293 | 52.4% | Washington, DC | Washington, DC |
| 8 | Miami, FL | 1,282 | 23.1% | New York, NY | New York, NY |
| 9 | Austin, TX | 1,128 | 22.2% | San Francisco, CA | San Francisco, CA |
| 10 | San Diego, CA | 1,079 | 21.8% | Los Angeles, CA | Seattle, WA |
| *Combined statistical areas with at least 500 users in Q1 2017 †Among the one million users sampled for this analysis only |
|||||
Solidifying the predominance of the Bay Area migration trend, Sacramento was the most popular destination for people looking to migrate away from their home metro last quarter, with the largest share of migrants coming from the San Francisco area. Tampa and Miami each made the top 10 list of metros by net inflow. Indeed, more than half (52.4%) of searches for homes in Tampa were made by people in another metro, with 14.9 percent of those from the D.C. metro alone. At the same time, 22.1 percent of searches in Miami from the outside were from New York.
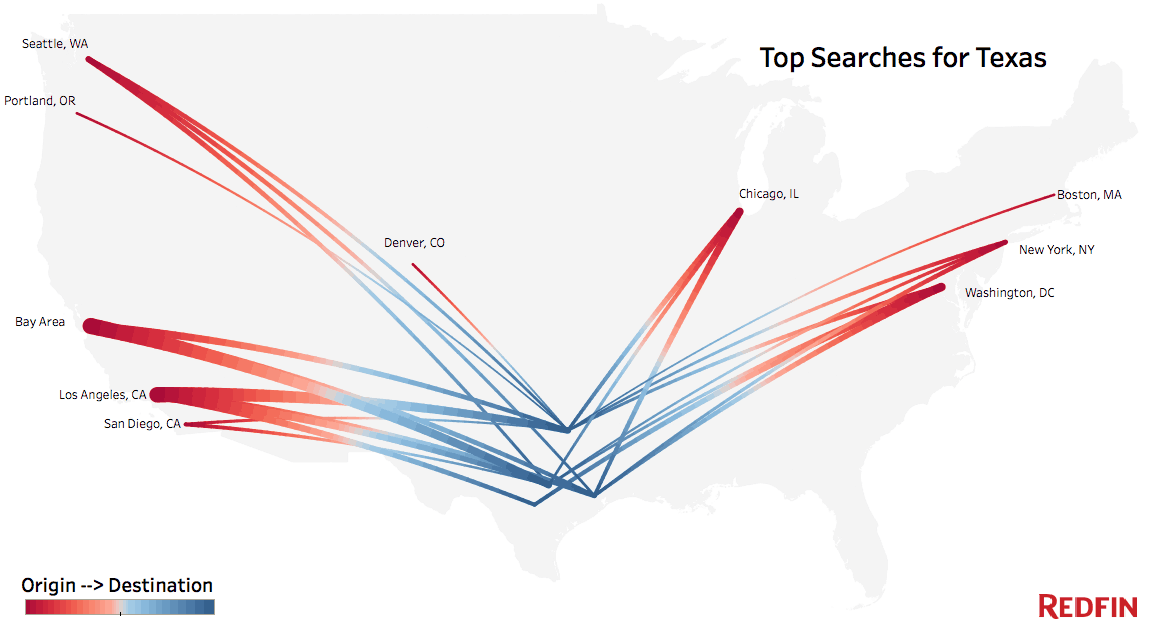
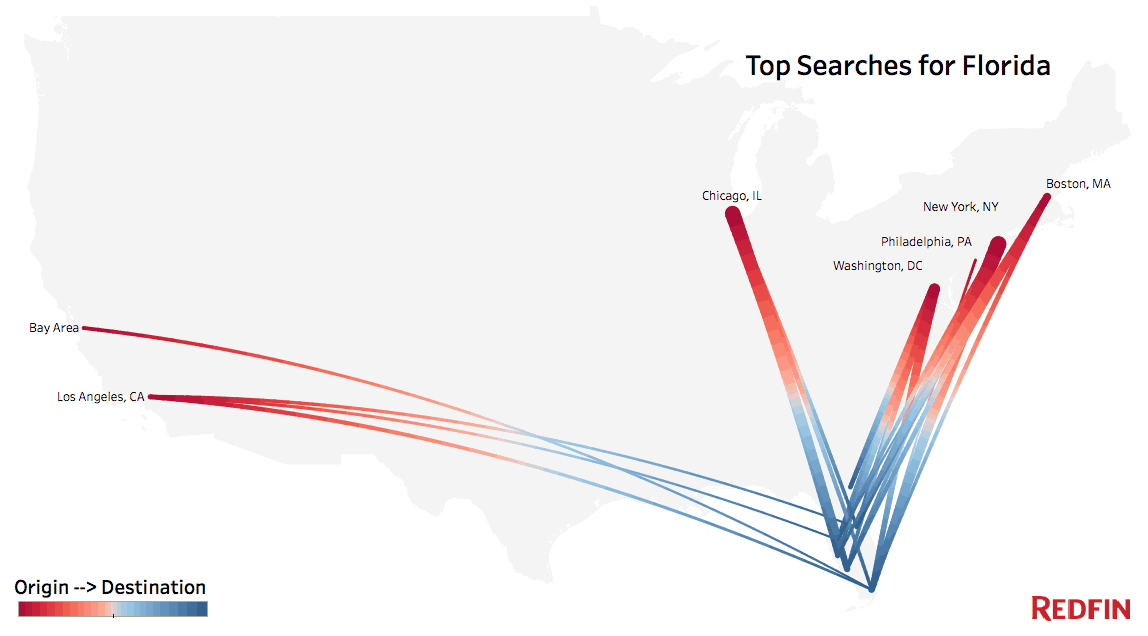
A clear trend from the data is that among states, Florida and Texas were the most popular destinations for those people looking to migrate away from their home metro last quarter. These states have an attractive combination of relative affordability, especially when compared with the most common user origins, and strong local economies and jobs markets.
Austin had a large net inflow of users, most commonly (one in six) from the Bay Area.
“Austin is the gold standard of healthy migration, driven by its booming jobs market and a vibrant housing market,” said Redfin chief economist Nela Richardson. “In order for cities to attract and keep a talented workforce, win corporate investment and generate tax revenues, they have to prioritize the basics for their residents—ensuring an adequate supply of homes that are affordable to live in.”
Trend #3: Here to Stay
Across the 75 metropolitan areas included in our analysis, four out of five people were looking primarily within their home metro. Chicago topped the list of places where people prefer to stay close to home, with a whopping 92.5 percent of local users searching only in the Chicago area. Likewise, more than nine out of 10 homebuyers in Boston, Seattle and Nashville searched for houses close to home.
Home searchers in these metros are not unique. We move to start new families, to get new jobs and to find better homes. In the U.S., people move long distances at nearly double the rate of people in most other countries—with one in four American adults moving cities every five years, according to Gallup. In 2016 alone, more than 12 million people—3.9 percent of the U.S. population—changed counties,5 according to the latest Census data. Still, Americans today are much more likely to stay put than they were decades ago. Domestic migration has been steadily declining since 1948 when 6.4 percent of the U.S. population changed counties.6
As factors influencing people’s decisions regarding where to live evolve, Redfin search data reveal emerging patterns of migration with home seekers shifting their search to lower-cost, second-tier markets and away from super-star cities. We will continue to track migration using Redfin’s proprietary user dataset each quarter.
Find your Metro: On the below interactive map, select only one metro area origin (or destination) to see the top 10 destinations (or origins) for that metro.
Methodology
Users must have viewed at least 10 listings during the quarter. We also excluded locations that in aggregate represented less than 20 percent of a user’s searches. We determined the home metro by mapping the user’s IP address of the most common location they searched from. If a user was searching in more than one metro, we accounted for the share of searches in each metro. Combined Statistical Areas (as defined here) must have had at least 500 users either searching from or in that metro during the first quarter.
1. We excluded locations that in aggregate represented less than 20 percent of a user’s searches.↩
2. The combined metropolitan area in which more than half of their listing searches were performed from↩
3. Pearson’s correlation: 0.911↩
4. In spite of California experiencing negative domestic migration in 2016, the country’s most populous state is still experiencing positive population growth due to international migration.↩
5. Between July 1, 2015 and July 1, 2016↩
6. A recent paper by Yale Law Professor David Schleicher, suggests that declining mobility in the U.S. may be attributable to certain government policies.↩


