
Twenty-one percent of Redfin.com users in the second quarter of 2017 searched for homes outside the metro where they reside, up slightly from nearly 20 percent in the first quarter. The Redfin Migration Report analyzed a sample of more than one million Redfin.com users searching for homes across 75 metro areas from April through June.
Many of the migratory trends observed in the first quarter continued in the second quarter, including a trend of people leaving large, expensive cities for more affordable, mid-tier cities.
- There continued to be significant migration within the state of California, as buyers looked to leave the Bay Area and Los Angeles, heading to Sacramento and San Diego.
- Several Rust Belt metros saw residents looking for homes in Chicago.
- Metros in the South and the Sunbelt attracted migrants from expensive coastal cities.
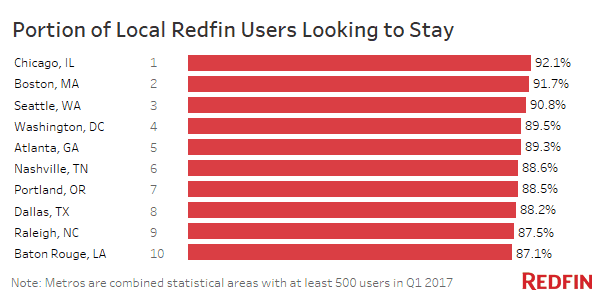
- Chicago, Boston and Seattle again had the highest share of residents looking to stay in their current metros.
“Home searches are early indicators of home sales. The migration patterns presented here closely correlate to actual purchases made by Redfin home-buying customers within and across metros,” said Taylor Marr, a Redfin data scientist who conducted the underlying research.
“Buyers who can’t afford a home in their current city are exploring what is available elsewhere. We are already seeing strong buyer demand and competition in mid-tier cities like Sacramento, Phoenix and Atlanta. As home searches evolve into purchase offers and home sales, we anticipate prices and competition will continue to grow in those markets.”
Moving Out – Metros with the Highest Net Outflow of Users
The Bay Area ranked highest for net outflow for the second quarter in a row, which means the number of people in the Bay Area searching for homes in another metro was greater than the number of people in other metros searching for homes in the Bay Area.
For prospective buyers in the Bay Area the most frequent search destination was Sacramento, where the median sale price was $376,000 in June. For comparison, the median sale price in San Francisco was $1.25 million. The top out-of-state destination was Seattle.
New York and Los Angeles ranked second and third for largest net outflow for the second quarter in a row. Boston usurped Philadelphia as the most popular destination among people looking to leave New York. Like San Franciscans, Angelenos were also making intrastate moves. Of the people in Los Angeles looking outside the area, more than a quarter searched in San Diego.
Three Rust Belt cities made the list of metros with the largest net outflow: Detroit, Milwaukee and Dayton. In all three, more than a quarter of people searching on Redfin.com were searching outside their current metro. Chicago was the most popular destination for Rust Belt users.
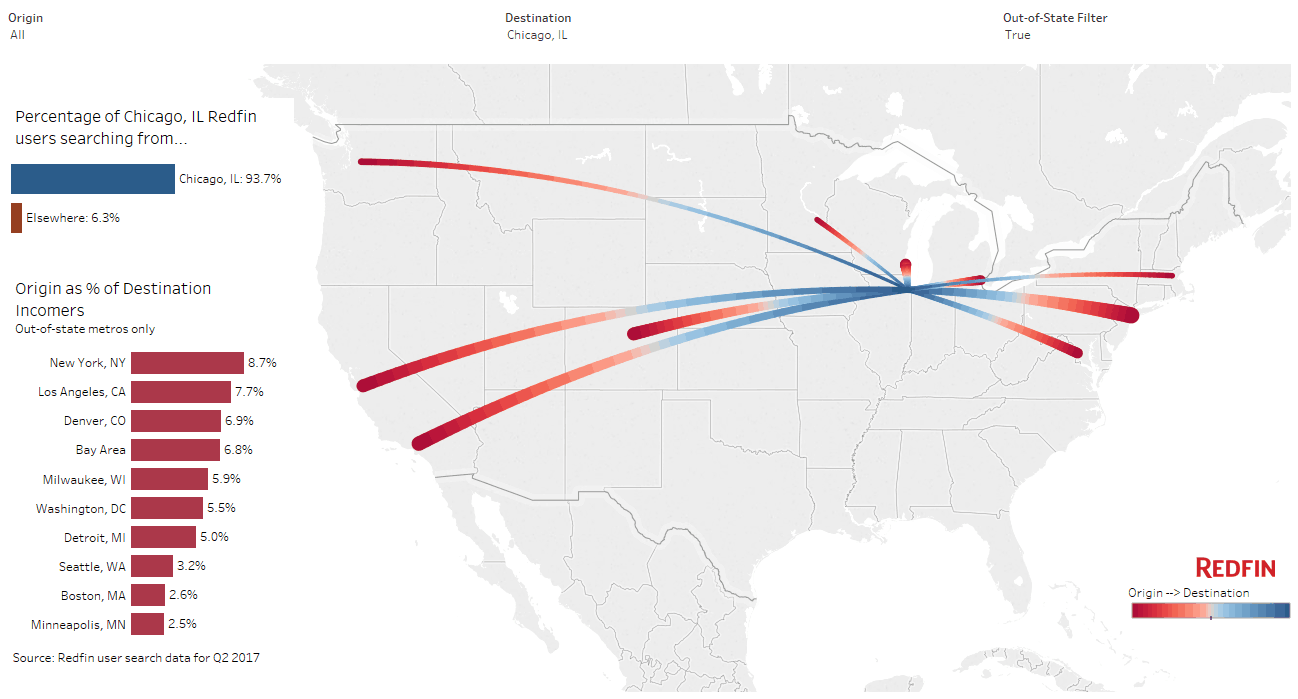
“Chicago is the hub of the Midwest,” explains Lamar Austin, a Redfin agent in Chicago. “Many doctors, engineers and professionals from graduate and residency programs move here to take the next step. While homes are more expensive in Chicago than cities like Detroit, salaries tend to be higher and there are more opportunities to move up the career ladder in a big, international city with many corporate headquarters and a flourishing tech industry. People moving here are often interested in buying right away because it’s often cheaper to own than rent, given how high rents are right now.”
Milwaukee, WI
| Top 10 Metros by Net Outflow of Users and Their Top Destinations | |||||
| Rank | Metro* | Net Outflow† | Portion of Local Users Searching Elsewhere | Top Destination | Top Out-of-State Destination |
|---|---|---|---|---|---|
| 1 | San Francisco, CA | -16,913 | 18.8% | Sacramento, CA | Seattle, WA |
| 2 | New York, NY | -15,790 | 34.6% | Boston, MA | Boston, MA |
| 3 | Los Angeles, CA | -13,177 | 14.7% | San Diego, CA | Las Vegas, NV |
| 4 | Washington, DC | -5,571 | 10.5% | Philadelphia, PA | Philadelphia, PA |
| 5 | Chicago, IL | -2,631 | 7.9% | Los Angeles, CA | Los Angeles, CA |
| 6 | Denver, CO | -368 | 17.9% | Chicago, IL | Chicago, IL |
| 7 | Houston, TX | -354 | 24.2% | Austin, TX | Los Angeles, CA |
| 8 | Detroit, MI | -338 | 25.3% | Chicago, IL | Chicago, IL |
| 9 | Milwaukee, WI | -246 | 36.8% | Chicago, IL | Chicago, IL |
| 10 | Dayton, OH | -34 | 37.3% | Cincinnati, OH | Chicago, IL |
| *Combined statistical areas with at least 500 users in Q2 2017 †Among the one million users sampled for this analysis only |
|||||
Moving In – Metros with the Highest Net Inflow of Users
San Diego and Sacramento ranked first and second by net inflow, with the biggest share of searchers coming from Los Angeles and the Bay Area, respectively.
Beyond California, metros in the Sun Belt (Phoenix and Las Vegas) and the South (Atlanta, Dallas, Tampa, Miami and Austin) were top destinations for home searchers. The largest share of incomers came from high-priced coastal cities, including Los Angeles, New York and Washington, D.C.
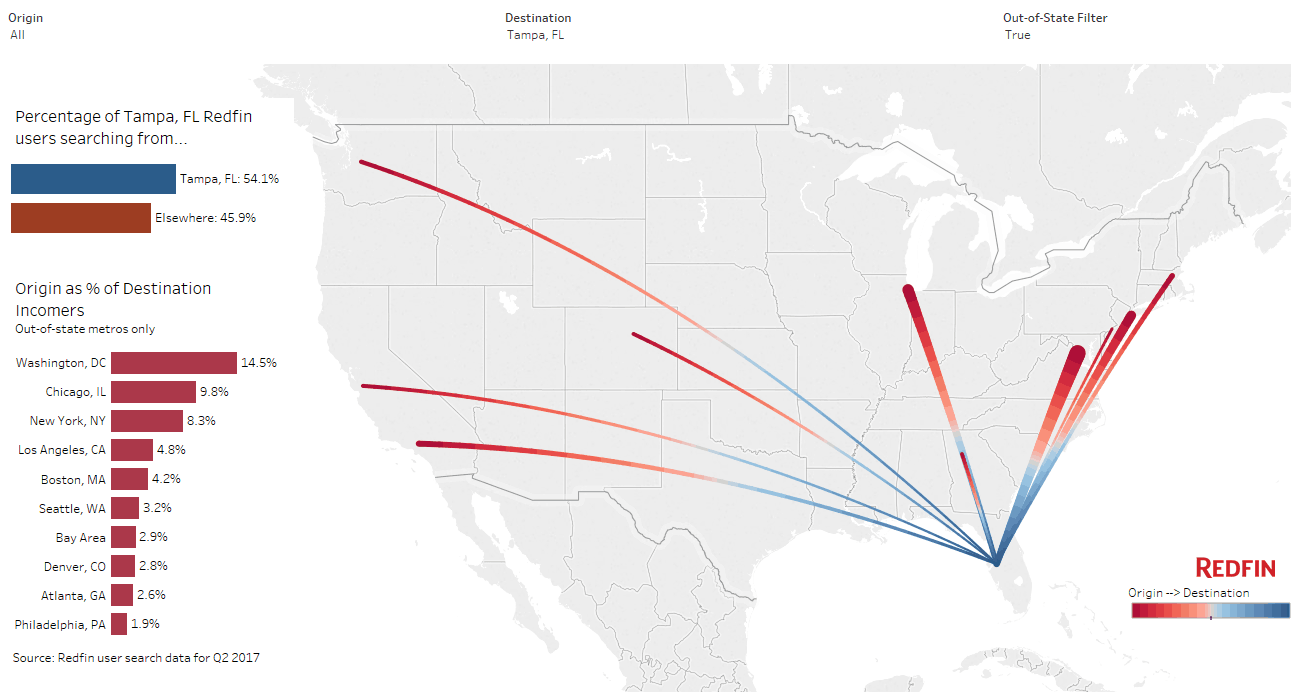
Tampa had the largest share of outside searchers– approximately 46 percent of people searching in Tampa were from outside the area. Wendy Peterson, a Redfin agent in Tampa, was not surprised that transplants were most commonly coming from Washington, D.C.
“We work with a lot of people moving here from D.C. and Maryland, and a good number from Chicago and the West Coast as well,” said Wendy. “Tampa is a rapidly growing city. From the new medical center to the military base to the sports and entertainment venues, there is a lot going on and many employment opportunities. Business leaders like Jeff Vinik, who owns the Tampa Bay Lightning, and the city government have put a lot of effort into revitalizing the downtown. The new Tampa Downtown Market rivals the famous Pike Place Market in Seattle. With the low cost of living and great weather, the area is a magnet for young professionals and families.”
| Top 10 Metros by Net Inflow of Users and Their Top Origins | |||||
| Rank | Metro* | Net Inflow† | Portion of Searches from Users Outside the Metro | Top Origin | Top Out-of-State Origin |
|---|---|---|---|---|---|
| 1 | San Diego, CA | 5,233 | 29.4% | Los Angeles, CA | Seattle, WA |
| 2 | Sacramento, CA | 4,831 | 35.3% | San Francisco, CA | Seattle, WA |
| 3 | Phoenix, AZ | 3,975 | 31.4% | Los Angeles, CA | Los Angeles, CA |
| 4 | Las Vegas, NV | 3,660 | 42.0% | Los Angeles, CA | Los Angeles, CA |
| 5 | Atlanta, GA | 2,914 | 24.3% | New York, NY | New York, NY |
| 6 | Dallas, TX | 2,112 | 21.1% | Los Angeles, CA | Los Angeles, CA |
| 7 | Tampa, FL | 1,899 | 45.9% | Washington, DC | Washington, DC |
| 8 | Miami, FL | 1,861 | 22.0% | New York, NY | New York, NY |
| 9 | Boston, MA | 1,707 | 12.3% | New York, NY | New York, NY |
| 10 | Austin, TX | 1,601 | 23.2% | San Francisco, CA | San Francisco, CA |
| *Combined statistical areas with at least 500 users in Q2 2017 †Among the one million users sampled for this analysis only |
|||||
Staying Put
Across the 75 metro areas in the analysis, 79 percent of Redfin.com users looked for homes primarily within their home metro. Chicago, Boston and Seattle had the most loyal residents for the second quarter. More than 9 in 10 looked to put down roots by searching for a home in their current location.
As factors influencing people’s decisions regarding where to live evolve, Redfin search data reveal emerging migration patterns with home seekers shifting their search to lower-cost, second-tier markets and away from expensive coastal cities. We will continue to track migration using Redfin’s proprietary user dataset each quarter.
Find your Metro: On the below interactive map, select one metro area origin (or destination) to see the top 10 destinations (or origins) for that metro.
If you’d like more information about this analysis or its underlying data, please email press@redfin.com.
Methodology
Redfin analyzed a sample of more than one million Redfin.com users searching for homes across 75 metro areas from April through June. Users must have viewed at least 10 listings during the quarter. We also excluded locations that in aggregate represented less than 20 percent of a user’s searches. We determined the home metro by mapping the user’s IP address of the most common location they searched from. If a user was searching in more than one metro, we accounted for the share of searches in each metro. Combined Statistical Areas (as defined here) must have had at least 500 users either searching from or in that metro during the first quarter.
It’s worth noting that net inflow and outflow data does not account for Redfin’s market share or the population of metro areas. In metros where Redfin has a larger number of website visitors, we may have a higher volume of inbound and outbound searches than in metros that are smaller or where Redfin has a smaller user base. The U.S. Census Bureau measures net migration flows, which is a common practice when analyzing migratory patterns.


