
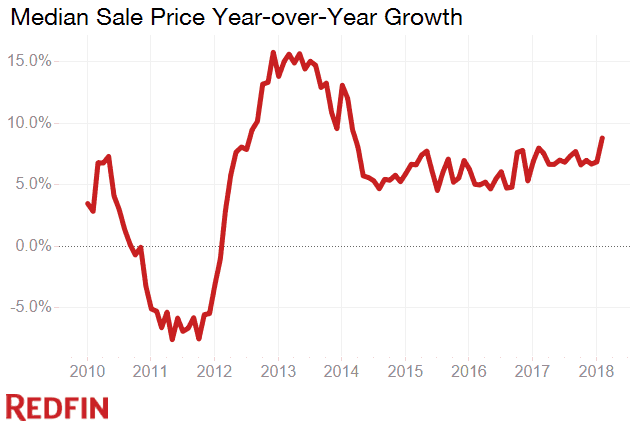
Home prices in February increased 8.8 percent from a year earlier to a median sale price of $285,700 across the markets Redfin tracks. This was the strongest price appreciation since March 2014. February also marks six years, or 72 consecutive months, of year-over-year price increases since the market bottomed out and began to recover.
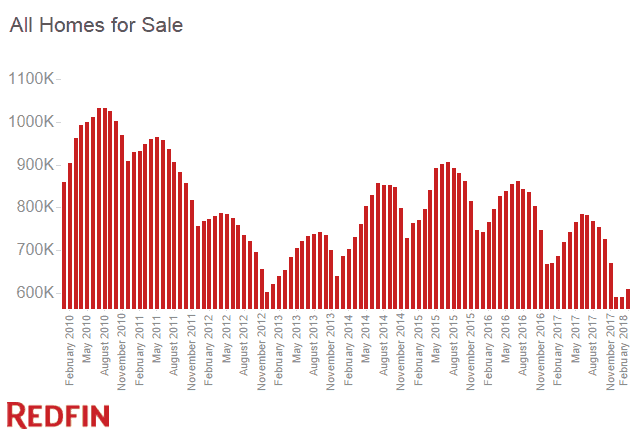
Constrained by a lack of supply, February home sales were nearly flat, up just 0.4 percent compared to last year. February saw an 11.4 percent decline in the overall number of homes for sale, marking the 29th consecutive month of year-over-year supply declines.
Notwithstanding affordability concerns and low inventory, buyer demand remained strong and market speed continued to increase. The typical home that sold last month went under contract in 53 days, a week faster than one year prior. More than one in five (21.1%) homes that sold last month went for more than their list price, up from 19.6 percent last February. Of the offers Redfin agents wrote for their clients in February, 56 percent encountered competition compared to 58 percent last February.
“Mortgage rates pushed upwards in February to the highest levels in nearly three years as home prices increased by their fastest pace in nearly four years,” said Redfin chief economist Nela Richardson. “A growing economy, healthy buyer demand and low inventory drove the ramp up in prices last month. Combining even slightly higher rates with price growth this strong will make it even more challenging for first-time buyers to find affordable homes to buy this year. The good news for sellers is modest rate increases are unlikely to curtail buyer demand. Just 6 percent of respondents to a survey commissioned by Redfin said they would cancel their home buying plans if rates rose above 5 percent.”
The median value of off-market homes was $283,300, as measured by the Redfin Estimate, up 8.9 percent from last year. 58.1 percent of homes on the market in February were priced above their Redfin Estimate value, with a Redfin-List-to-Estimate Ratio of 100.3 percent, indicating that sellers are slightly overpricing their homes.
| Market Summary | February 2018 | Month-Over-Month | Year-Over-Year |
|---|---|---|---|
| Median sale price | $285,700 | 2.7% | 8.8% |
| Homes sold | 166,100 | -0.8% | 0.4% |
| New listings | 254,700 | 9.1% | -1.2% |
| All homes for sale | 607,800 | 2.9% | -11.4% |
| Median days on market | 53 | 0 | -7 |
| Months of supply | 3.7 | 0.2 | -0.4 |
| Sold above list | 21.1% | 1.8% | 1.5% |
| Median off-market Redfin Estimate | $283,300 | 0.8% | 8.9% |
| Average sale-to-list | 97.8% | 0.2% | -0.1% |
Other February Highlights
Competition
- Seattle, WA was the fastest market, with half of all homes pending sale in just 8 days, down from 12 days from a year earlier. Denver, CO and San Jose, CA were the next fastest markets with 9 and 10 median days on market, followed by Oakland, CA (13) and San Francisco, CA (14).
- The most competitive market in February was San Jose, CA where 83.1% of homes sold above list price, followed by 74.4% in San Francisco, CA, 67.5% in Oakland, CA, 54.8% in Seattle, WA, and 44.4% in Tacoma, WA.
Prices
- San Jose, CA had the nation’s highest price growth, rising 34.1% since last year to $1,180,000. Detroit, MI had the second highest growth at 19.8% year-over-year price growth, followed by Fresno, CA (19.5%), Tacoma, WA (17.9%), and New Orleans, LA (17.7%).
- No metros saw price declines in February.
Sales
- Long Island, NY saw the largest decline in sales since last year, falling 32.6%. Home sales in Minneapolis, MN and Miami, FL declined by 13.0% and 12.9%, respectively.
- 6 out of 73 metros saw sales surge by double digits from last year. Louisville, KY led the nation in year-over-year sales growth, up 24.7%, followed by Greenville, SC, up 18.4%. Oklahoma City, OK rounded out the top three with sales up 15.8% from a year ago.
Inventory
- Rochester, NY had the largest decrease in overall inventory, falling 40% since last February. Buffalo, NY (-39.6%), Atlanta, GA (-33.1%), and Albany, NY (-30.7%) also saw far fewer homes available on the market than a year ago.
- Salt Lake City, UT had the highest increase in the number of homes for sale, up 49.9% year over year, followed by Baton Rouge, LA (31.8%) and Washington, DC (13.9%).
Redfin Estimate
- The median list price-to-Redfin Estimate ratio was 93.3% in San Francisco, CA, the lowest of any market. This indicates the typical home for sale in February was listed at a price 6.7% below its estimated value. Only 8.1% of homes in San Francisco, CA were listed for more than their Redfin Estimate.
- Conversely, the median list price-to-Redfin Estimate ratio was 102.6% in Miami, FL and 102.3% in West Palm Beach, FL, which means sellers are listing their homes for more than the estimated value in those metro areas. In Miami, FL, 86.4% of homes were listed above their Redfin Estimate, the highest percentage of any metro.
Below are market-by-market breakdowns for prices, inventory, new listings and sales for markets with populations of 750 thousand or more. For downloadable data on all of the markets Redfin tracks, visit the Redfin Data Center.
Median Sale Price
| Redfin Metro | Median Sale Price | Month-Over-Month | Year-Over-Year |
|---|---|---|---|
| Albany, NY | $193,100 | 4.1% | 7.8% |
| Allentown, PA | $175,000 | -5.1% | 4.9% |
| Atlanta, GA | $219,000 | 1.9% | 9.6% |
| Austin, TX | $299,900 | 3.4% | 4.1% |
| Bakersfield, CA | $225,000 | 4.7% | 9.2% |
| Baltimore, MD | $245,000 | 3.9% | 5.6% |
| Baton Rouge, LA | $199,900 | 2.5% | 11.1% |
| Birmingham, AL | $192,000 | 9.5% | 16.4% |
| Boston, MA | $436,200 | -3.1% | 8.8% |
| Buffalo, NY | $132,200 | -2.0% | 13.0% |
| Camden, NJ | $160,000 | 6.0% | 6.7% |
| Charlotte, NC | $225,000 | 2.5% | 7.1% |
| Chicago, IL | $225,000 | 2.7% | 10.8% |
| Cincinnati, OH | $158,000 | 1.9% | 14.9% |
| Cleveland, OH | $135,000 | 7.1% | 13.9% |
| Columbus, OH | $181,500 | 2.0% | 10.1% |
| Dallas, TX | $285,000 | 7.2% | 5.6% |
| Denver, CO | $397,200 | 5.7% | 12.9% |
| Detroit, MI | $115,000 | 1.3% | 19.8% |
| Fort Lauderdale, FL | $240,000 | -1.0% | 11.6% |
| Fort Worth, TX | $225,000 | 4.7% | 6.2% |
| Fresno, CA | $263,500 | 9.1% | 19.5% |
| Grand Rapids, MI | $179,700 | 2.7% | 10.4% |
| Greenville, SC | $189,000 | -0.5% | 8.0% |
| Hampton Roads, VA | $215,000 | -1.7% | 2.0% |
| Honolulu, HI | $550,000 | -2.7% | 5.8% |
| Houston, TX | $225,000 | 3.3% | 1.0% |
| Indianapolis, IN | $165,000 | 5.1% | 9.9% |
| Jacksonville, FL | $219,900 | 6.2% | 12.8% |
| Kansas City, MO | $189,900 | -1.0% | 5.5% |
| Knoxville, TN | $187,000 | 6.9% | 15.9% |
| Las Vegas, NV | $256,000 | 2.4% | 15.8% |
| Long Island, NY | $415,000 | -0.6% | 5.1% |
| Los Angeles, CA | $590,000 | 2.5% | 9.3% |
| Louisville, KY | $169,500 | -3.2% | 5.9% |
| Memphis, TN | $160,000 | 0.0% | 6.7% |
| Miami, FL | $277,500 | -2.5% | 4.7% |
| Milwaukee, WI | $178,400 | -3.5% | 11.5% |
| Minneapolis, MN | $250,000 | 2.9% | 12.4% |
| Montgomery County, PA | $279,900 | -1.8% | 3.7% |
| Nashville, TN | $275,300 | 1.8% | 10.1% |
| New Orleans, LA | $210,000 | 8.8% | 17.7% |
| Oakland, CA | $669,000 | 2.9% | 10.6% |
| Oklahoma City, OK | $164,200 | 5.1% | 2.7% |
| Omaha, NE | $176,800 | -6.4% | 14.0% |
| Orange County, CA | $695,000 | 3.7% | 11.2% |
| Orlando, FL | $231,500 | -1.5% | 11.7% |
| Oxnard, CA | $574,000 | -4.3% | 5.9% |
| Philadelphia, PA | $178,000 | -2.5% | 11.9% |
| Phoenix, AZ | $255,000 | 2.6% | 9.8% |
| Pittsburgh, PA | $150,000 | 0.0% | 15.8% |
| Portland, OR | $380,000 | -1.7% | 10.1% |
| Providence, RI | $247,000 | 0.8% | 9.8% |
| Raleigh, NC | $275,000 | 2.6% | 10.0% |
| Richmond, VA | $226,000 | 2.7% | 5.2% |
| Riverside, CA | $354,500 | 1.3% | 9.4% |
| Rochester, NY | $125,000 | -1.6% | 4.3% |
| Sacramento, CA | $373,000 | 2.2% | 9.7% |
| Salt Lake City, UT | $300,000 | 2.7% | 15.4% |
| San Antonio, TX | $209,000 | 2.0% | 4.5% |
| San Diego, CA | $547,000 | 2.2% | 8.3% |
| San Francisco, CA | $1,369,400 | 5.3% | 10.9% |
| San Jose, CA | $1,180,000 | 18.6% | 34.1% |
| Seattle, WA | $530,000 | 3.8% | 15.2% |
| St. Louis, MO | $165,000 | 5.4% | 11.5% |
| Tacoma, WA | $330,000 | 6.5% | 17.9% |
| Tampa, FL | $215,000 | 6.5% | 10.8% |
| Tucson, AZ | $210,000 | 5.1% | 9.4% |
| Tulsa, OK | $158,900 | 0.2% | 8.8% |
| Warren, MI | $185,000 | 0.0% | 9.8% |
| Washington, DC | $370,500 | 1.2% | 4.4% |
| West Palm Beach, FL | $270,000 | 5.3% | 12.8% |
| Worcester, MA | $247,000 | -1.2% | 9.8% |
| National | $285,700 | 2.7% | 8.8% |
Homes Sold
| Redfin Metro | Homes Sold | Month-Over-Month | Year-Over-Year |
|---|---|---|---|
| Albany, NY | 542 | -25.3% | -6.1% |
| Allentown, PA | 451 | -22.6% | -5.3% |
| Atlanta, GA | 6,710 | 6.7% | 5.5% |
| Austin, TX | 2,038 | 16.9% | 1.3% |
| Bakersfield, CA | 524 | -6.4% | -7.1% |
| Baltimore, MD | 2,441 | -4.2% | -1.4% |
| Baton Rouge, LA | 661 | 13.6% | -9.8% |
| Birmingham, AL | 1,019 | 29.0% | 7.7% |
| Boston, MA | 2,052 | -31.3% | -7.8% |
| Buffalo, NY | 656 | -14.7% | -5.7% |
| Camden, NJ | 1,132 | -13.6% | 3.8% |
| Charlotte, NC | 2,396 | 4.3% | -0.2% |
| Chicago, IL | 6,339 | -3.5% | 12.6% |
| Cincinnati, OH | 1,423 | -13.3% | 9.9% |
| Cleveland, OH | 1,383 | -11.5% | -12.4% |
| Columbus, OH | 1,648 | -19.3% | -2.9% |
| Dallas, TX | 3,909 | 16.3% | -1.2% |
| Denver, CO | 3,158 | 1.3% | 5.1% |
| Detroit, MI | 1,237 | -11.7% | -5.1% |
| Fort Lauderdale, FL | 2,349 | -5.7% | 3.9% |
| Fort Worth, TX | 2,089 | 12.9% | -2.8% |
| Fresno, CA | 605 | 5.4% | 4.9% |
| Grand Rapids, MI | 760 | -15.3% | -10.1% |
| Greenville, SC | 809 | 10.4% | 18.4% |
| Hampton Roads, VA | 1,461 | 8.9% | 9.4% |
| Honolulu, HI | 592 | -5.3% | 2.4% |
| Houston, TX | 5,459 | 19.7% | 3.4% |
| Indianapolis, IN | 1,941 | 8.9% | 5.4% |
| Jacksonville, FL | 1,581 | 7.3% | 0.1% |
| Kansas City, MO | 1,945 | -0.7% | 4.4% |
| Knoxville, TN | 923 | 16.2% | 15.7% |
| Las Vegas, NV | 2,659 | -4.6% | -6.0% |
| Long Island, NY | 1,576 | -28.9% | -32.6% |
| Los Angeles, CA | 4,273 | -3.5% | -5.3% |
| Louisville, KY | 1,070 | 22.7% | 24.7% |
| Memphis, TN | 803 | -2.0% | 1.6% |
| Miami, FL | 1,819 | -31.1% | -12.9% |
| Milwaukee, WI | 985 | 0.0% | 7.7% |
| Minneapolis, MN | 2,664 | -4.9% | -13.0% |
| Montgomery County, PA | 1,279 | -20.9% | 2.3% |
| Nashville, TN | 2,229 | 7.8% | -2.8% |
| New Orleans, LA | 891 | -0.2% | 1.5% |
| Oakland, CA | 1,389 | 1.2% | -4.8% |
| Oklahoma City, OK | 1,294 | 14.3% | 15.8% |
| Omaha, NE | 674 | -4.7% | -2.2% |
| Orange County, CA | 1,825 | 0.8% | -4.9% |
| Orlando, FL | 2,934 | -7.2% | 6.8% |
| Oxnard, CA | 475 | -6.5% | 0.2% |
| Philadelphia, PA | 1,435 | -17.1% | 3.5% |
| Phoenix, AZ | 6,805 | 11.2% | 5.9% |
| Pittsburgh, PA | 1,191 | -11.3% | -6.7% |
| Portland, OR | 2,271 | 6.6% | 3.0% |
| Providence, RI | 1,032 | -13.6% | -2.3% |
| Raleigh, NC | 1,447 | 3.1% | -3.7% |
| Richmond, VA | 1,037 | 3.2% | 11.0% |
| Riverside, CA | 3,665 | -4.4% | -3.0% |
| Rochester, NY | 558 | -27.0% | -11.6% |
| Sacramento, CA | 1,803 | -5.8% | -2.0% |
| Salt Lake City, UT | 1,176 | 1.3% | 9.5% |
| San Antonio, TX | 1,731 | 11.9% | -5.9% |
| San Diego, CA | 2,221 | 3.1% | -3.3% |
| San Francisco, CA | 610 | 27.9% | 8.0% |
| San Jose, CA | 816 | 17.4% | -1.0% |
| Seattle, WA | 2,768 | 12.2% | -2.8% |
| St. Louis, MO | 2,227 | -0.7% | -5.6% |
| Tacoma, WA | 1,053 | 6.6% | 4.7% |
| Tampa, FL | 4,152 | 11.7% | 4.6% |
| Tucson, AZ | 1,129 | 16.2% | -5.6% |
| Tulsa, OK | 811 | 14.9% | 7.8% |
| Warren, MI | 2,352 | -16.4% | -0.4% |
| Washington, DC | 5,123 | 2.6% | -6.5% |
| West Palm Beach, FL | 2,153 | -4.4% | -0.6% |
| Worcester, MA | 470 | -30.7% | -10.6% |
| National | 166,100 | -0.8% | 0.4% |
New Listings
| Redfin Metro | New Listings | Month-Over-Month | Year-Over-Year |
|---|---|---|---|
| Albany, NY | 724 | 5.7% | -10.7% |
| Albuquerque, NM | 1,201 | 8.3% | 1.7% |
| Allentown, PA | 845 | 14.7% | -7.2% |
| Atlanta, GA | 9,617 | 16.9% | 13.9% |
| Austin, TX | 3,146 | 26.5% | 4.7% |
| Bakersfield, CA | 926 | 2.7% | 8.6% |
| Baltimore, MD | 3,734 | 21.2% | -0.6% |
| Baton Rouge, LA | 1,139 | 20.1% | 14.4% |
| Birmingham, AL | 1,392 | 12.4% | -15.1% |
| Boston, MA | 4,008 | 41.2% | 13.4% |
| Buffalo, NY | 791 | 11.3% | -3.3% |
| Camden, NJ | 2,044 | 8.3% | -3.5% |
| Charlotte, NC | 3,640 | 22.2% | -7.3% |
| Chicago, IL | 11,170 | 26.8% | -10.4% |
| Cincinnati, OH | 2,060 | 21.7% | -6.5% |
| Cleveland, OH | 2,300 | 6.4% | -8.2% |
| Columbus, OH | 2,114 | 18.8% | -8.3% |
| Dallas, TX | 5,612 | 2.7% | -3.1% |
| Denver, CO | 4,215 | 12.8% | -1.4% |
| Detroit, MI | 1,577 | -6.2% | -14.7% |
| Fort Lauderdale, FL | 4,259 | -4.7% | 4.3% |
| Fort Worth, TX | 2,717 | 0.5% | -6.3% |
| Fresno, CA | 854 | 0.6% | 5.7% |
| Grand Rapids, MI | 1,063 | 13.6% | -4.4% |
| Greenville, SC | 1,105 | 7.4% | -4.8% |
| Hampton Roads, VA | 2,151 | 16.9% | -2.0% |
| Honolulu, HI | 952 | -6.7% | 7.0% |
| Houston, TX | 8,292 | 7.6% | -4.5% |
| Indianapolis, IN | 2,298 | 17.1% | -11.2% |
| Jacksonville, FL | 2,585 | 13.3% | 8.7% |
| Kansas City, MO | 2,682 | 14.5% | -5.1% |
| Knoxville, TN | 1,129 | 10.0% | 7.7% |
| Las Vegas, NV | 3,703 | 2.2% | -0.6% |
| Long Island, NY | 3,001 | 14.9% | -0.5% |
| Los Angeles, CA | 7,268 | 5.3% | 10.0% |
| Louisville, KY | 1,205 | 7.2% | -2.5% |
| Memphis, TN | 1,134 | 17.5% | -4.5% |
| Miami, FL | 4,296 | -8.8% | 2.9% |
| Milwaukee, WI | 1,438 | 15.7% | -12.5% |
| Minneapolis, MN | 4,566 | 40.1% | -9.3% |
| Montgomery County, PA | 2,385 | 30.0% | -11.1% |
| Nashville, TN | 3,365 | 14.0% | 0.8% |
| New Orleans, LA | 1,328 | 2.4% | 7.4% |
| Oakland, CA | 2,364 | 18.9% | 8.6% |
| Oklahoma City, OK | 1,698 | 0.9% | -12.2% |
| Omaha, NE | 916 | 21.6% | -12.8% |
| Orange County, CA | 3,058 | 13.6% | 7.3% |
| Orlando, FL | 4,220 | 0.4% | -1.2% |
| Oxnard, CA | 796 | 15.4% | 13.6% |
| Philadelphia, PA | 2,555 | 22.1% | -3.4% |
| Phoenix, AZ | 8,841 | -5.4% | -3.4% |
| Pittsburgh, PA | 1,863 | 12.8% | -8.1% |
| Portland, OR | 2,566 | 12.1% | -1.3% |
| Providence, RI | 1,620 | 23.4% | 12.6% |
| Raleigh, NC | 2,289 | 13.1% | -6.8% |
| Richmond, VA | 1,590 | 23.4% | -10.0% |
| Riverside, CA | 5,827 | 1.0% | 6.1% |
| Rochester, NY | 864 | 25.8% | -11.3% |
| Sacramento, CA | 2,791 | 12.2% | 18.5% |
| Salt Lake City, UT | 1,515 | 4.0% | -0.3% |
| San Antonio, TX | 2,558 | -0.5% | -0.5% |
| San Diego, CA | 3,282 | -0.5% | 1.7% |
| San Francisco, CA | 1,011 | 15.5% | 13.6% |
| San Jose, CA | 1,283 | 26.3% | 7.1% |
| Seattle, WA | 3,420 | 10.3% | 2.2% |
| St. Louis, MO | 3,673 | 24.9% | -6.4% |
| Tacoma, WA | 1,151 | -0.1% | -0.1% |
| Tampa, FL | 5,843 | -7.2% | -0.9% |
| Tucson, AZ | 1,593 | -4.3% | -2.5% |
| Tulsa, OK | 1,114 | 2.7% | -4.0% |
| Warren, MI | 2,778 | 5.9% | -14.2% |
| Washington, DC | 8,065 | 29.3% | -5.4% |
| West Palm Beach, FL | 4,104 | -10.0% | 5.0% |
| Worcester, MA | 760 | 27.9% | 7.0% |
| National | 254,700 | 9.1% | -1.2% |
All Homes for Sale
| Redfin Metro | All Homes for Sale | Month-Over-Month | Year-Over-Year |
|---|---|---|---|
| Albany, NY | 2,125 | -7.0% | -30.7% |
| Albuquerque, NM | 4,022 | 11.8% | -6.3% |
| Allentown, PA | 2,091 | -4.8% | -21.1% |
| Atlanta, GA | 20,455 | -0.1% | -33.1% |
| Austin, TX | 5,756 | 1.1% | -1.9% |
| Bakersfield, CA | 1,782 | -3.3% | -10.0% |
| Baltimore, MD | 9,286 | 6.5% | -1.6% |
| Baton Rouge, LA | 3,529 | 6.0% | 31.8% |
| Birmingham, AL | 4,492 | 0.1% | -18.4% |
| Boston, MA | 4,918 | 5.4% | -19.3% |
| Buffalo, NY | 1,475 | -4.7% | -39.6% |
| Camden, NJ | 7,115 | 4.1% | -3.7% |
| Charlotte, NC | 8,788 | 1.4% | -26.6% |
| Chicago, IL | 30,702 | 8.8% | -16.3% |
| Cincinnati, OH | 6,272 | 7.9% | -12.3% |
| Cleveland, OH | 6,927 | -1.3% | -17.0% |
| Columbus, OH | 4,619 | 3.9% | -20.3% |
| Dallas, TX | 10,371 | -5.3% | -5.7% |
| Denver, CO | 4,154 | 2.5% | -7.6% |
| Detroit, MI | 3,543 | -8.8% | -11.2% |
| Fort Lauderdale, FL | 14,356 | 7.4% | -0.9% |
| Fort Worth, TX | 4,587 | -10.2% | -17.3% |
| Fresno, CA | 1,306 | -3.5% | -12.5% |
| Grand Rapids, MI | 1,686 | -5.8% | -9.0% |
| Greenville, SC | 3,611 | 6.3% | -6.4% |
| Hampton Roads, VA | 6,412 | -2.2% | -14.3% |
| Honolulu, HI | 3,010 | 5.0% | 9.5% |
| Houston, TX | 21,285 | -2.5% | -7.6% |
| Indianapolis, IN | 4,856 | -6.1% | -27.8% |
| Jacksonville, FL | 5,997 | 2.6% | -9.6% |
| Knoxville, TN | 4,003 | 0.6% | -13.9% |
| Las Vegas, NV | 8,670 | 4.7% | -22.4% |
| Long Island, NY | 8,802 | 4.8% | -13.9% |
| Los Angeles, CA | 13,169 | 4.5% | -13.6% |
| Louisville, KY | 2,344 | -4.8% | -13.4% |
| Memphis, TN | 2,589 | -1.0% | -22.3% |
| Miami, FL | 17,948 | 0.4% | -3.1% |
| Milwaukee, WI | 4,160 | 3.7% | -22.6% |
| Minneapolis, MN | 7,371 | 7.9% | -20.4% |
| Montgomery County, PA | 6,212 | 7.1% | -9.6% |
| Nashville, TN | 8,539 | 5.0% | 0.1% |
| New Orleans, LA | 5,855 | 5.5% | 9.1% |
| Oakland, CA | 1,886 | 16.0% | -13.5% |
| Oklahoma City, OK | 4,943 | -5.1% | -16.8% |
| Omaha, NE | 1,396 | -5.6% | -13.7% |
| Orange County, CA | 5,668 | 8.5% | -14.8% |
| Orlando, FL | 8,491 | -4.2% | -17.3% |
| Oxnard, CA | 1,243 | 5.0% | -5.6% |
| Philadelphia, PA | 6,701 | 7.8% | -7.8% |
| Phoenix, AZ | 18,997 | -1.8% | -16.6% |
| Pittsburgh, PA | 8,153 | 2.1% | -15.9% |
| Portland, OR | 3,874 | -6.9% | -4.2% |
| Providence, RI | 4,054 | 1.4% | -17.4% |
| Raleigh, NC | 5,661 | 2.6% | -7.3% |
| Richmond, VA | 2,505 | -4.5% | -22.1% |
| Riverside, CA | 13,657 | 0.8% | -14.4% |
| Rochester, NY | 1,517 | -0.8% | -40.0% |
| Sacramento, CA | 3,503 | 2.2% | -3.3% |
| Salt Lake City, UT | 3,907 | 25.3% | 49.9% |
| San Antonio, TX | 6,839 | -5.4% | -6.1% |
| San Diego, CA | 4,674 | 2.9% | -6.1% |
| San Francisco, CA | 974 | 13.0% | -17.2% |
| San Jose, CA | 923 | 24.9% | -30.0% |
| Seattle, WA | 2,283 | -0.5% | -21.7% |
| St. Louis, MO | 11,418 | 15.9% | 3.4% |
| Tacoma, WA | 1,213 | -16.1% | -25.6% |
| Tampa, FL | 11,870 | -3.1% | -14.2% |
| Tucson, AZ | 4,566 | 1.6% | -5.6% |
| Tulsa, OK | 3,407 | -2.4% | -12.0% |
| Warren, MI | 5,128 | -6.9% | -22.8% |
| Washington, DC | 16,587 | 23.6% | 13.9% |
| West Palm Beach, FL | 15,123 | 3.1% | -2.8% |
| Worcester, MA | 1,315 | -4.6% | -29.3% |
| National | 607,800 | 2.9% | -11.4% |
Median Off-Market Redfin Estimate
| Redfin Metro | Estimate | Month-Over-Month | Year-Over-Year |
|---|---|---|---|
| Albany, NY | $206,400 | -0.1% | 4.5% |
| Allentown, PA | $197,200 | -0.1% | 4.5% |
| Atlanta, GA | $198,600 | 0.8% | 10.1% |
| Austin, TX | $288,300 | 0.0% | 1.0% |
| Bakersfield, CA | $201,100 | 0.4% | 5.3% |
| Baltimore, MD | $244,600 | 0.0% | 2.3% |
| Baton Rouge, LA | $147,100 | -0.4% | -2.6% |
| Birmingham, AL | $141,000 | 0.0% | 6.2% |
| Boston, MA | $464,200 | 0.7% | 4.5% |
| Buffalo, NY | $147,400 | 0.1% | 6.7% |
| Camden, NJ | $185,700 | -0.2% | 2.8% |
| Charlotte, NC | $187,000 | 3.1% | 14.8% |
| Chicago, IL | $229,200 | 0.0% | 3.4% |
| Cincinnati, OH | $156,200 | 0.5% | 7.3% |
| Cleveland, OH | $129,500 | -0.1% | 1.6% |
| Columbus, OH | $175,600 | 2.2% | 9.6% |
| Dallas, TX | $243,100 | 0.4% | 10.4% |
| Denver, CO | $385,800 | 1.1% | 9.0% |
| Detroit, MI | $87,100 | 1.0% | 17.6% |
| Fort Lauderdale, FL | $248,900 | 0.2% | 8.4% |
| Fort Worth, TX | $197,500 | 0.5% | 13.9% |
| Fresno, CA | $237,900 | 0.2% | 9.0% |
| Grand Rapids, MI | $148,500 | 0.3% | 8.1% |
| Greenville, SC | $156,600 | 0.4% | 7.0% |
| Hampton Roads, VA | $216,000 | 0.1% | 3.3% |
| Honolulu, HI | $670,000 | 0.0% | 4.5% |
| Houston, TX | $197,000 | 0.1% | 5.5% |
| Indianapolis, IN | $147,600 | 0.3% | 8.3% |
| Jacksonville, FL | $201,000 | 0.8% | 14.2% |
| Kansas City, MO | $174,200 | 0.2% | 9.0% |
| Knoxville, TN | $139,700 | 0.1% | 4.9% |
| Las Vegas, NV | $246,000 | 0.9% | 15.1% |
| Long Island, NY | $422,700 | 0.2% | 6.5% |
| Los Angeles, CA | $591,400 | 0.4% | 7.8% |
| Louisville, KY | $144,300 | 1.2% | -1.7% |
| Memphis, TN | $128,200 | 0.7% | 10.7% |
| Miami, FL | $281,100 | 0.8% | 6.9% |
| Milwaukee, WI | $190,300 | 0.1% | 6.0% |
| Minneapolis, MN | $242,000 | 0.2% | 7.6% |
| Montgomery County, PA | $306,700 | 0.2% | 4.5% |
| Nashville, TN | $231,300 | 0.5% | 12.7% |
| New Orleans, LA | $166,100 | -0.6% | -2.4% |
| Oakland, CA | $725,300 | 0.7% | 9.6% |
| Oklahoma City, OK | $135,200 | 0.2% | 1.0% |
| Omaha, NE | $159,400 | 0.4% | 5.8% |
| Orange County, CA | $687,000 | 0.4% | 5.3% |
| Orlando, FL | $217,100 | 0.8% | 9.1% |
| Oxnard, CA | $580,700 | 0.1% | 5.9% |
| Philadelphia, PA | $191,700 | 1.5% | 10.1% |
| Phoenix, AZ | $250,400 | 0.4% | 6.6% |
| Pittsburgh, PA | $135,200 | 0.1% | 5.3% |
| Portland, OR | $378,200 | 0.4% | 4.7% |
| Providence, RI | $280,700 | 0.1% | 6.7% |
| Raleigh, NC | $248,800 | 0.3% | 6.7% |
| Richmond, VA | $211,200 | 0.1% | 7.5% |
| Riverside, CA | $345,500 | 0.4% | 8.6% |
| Rochester, NY | $135,500 | 0.0% | 4.4% |
| Sacramento, CA | $382,100 | 0.3% | 7.8% |
| Salt Lake City, UT | $299,300 | 0.5% | 9.4% |
| San Antonio, TX | $182,100 | 0.3% | 7.1% |
| San Diego, CA | $566,000 | 0.6% | 7.9% |
| San Francisco, CA | $1,263,200 | 0.5% | 12.3% |
| San Jose, CA | $1,146,500 | 2.1% | 21.1% |
| Seattle, WA | $528,800 | 1.1% | 14.2% |
| St. Louis, MO | $147,400 | 0.0% | 0.9% |
| Tacoma, WA | $320,900 | 0.2% | 12.3% |
| Tampa, FL | $205,300 | 0.6% | 9.8% |
| Tucson, AZ | $193,800 | 0.0% | 6.6% |
| Tulsa, OK | $133,100 | 0.1% | 2.4% |
| Warren, MI | $197,600 | 0.1% | 5.5% |
| Washington, DC | $374,400 | 0.2% | 2.8% |
| West Palm Beach, FL | $256,400 | 1.4% | 3.6% |
| Worcester, MA | $268,500 | 0.9% | 7.2% |
| National | $283,300 | 0.8% | 8.8% |


