
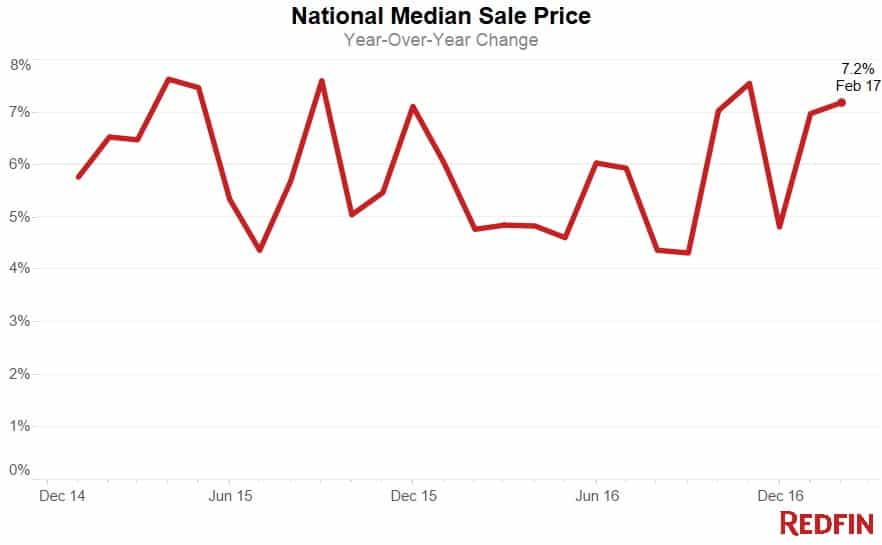
Home prices in February increased 7.2 percent from a year earlier to a median sale price of $260,900. This was the strongest February for price appreciation in three years. Last month also marks five years, or 60 consecutive months, of year-over-year price increases since the market bottomed-out and began to rebound.
“The total level of home equity reached a new peak at the close of 2016, according to recent Fed data,” said Redfin chief economist Nela Richardson. “While great for homeowners, continuously strong price growth across the U.S. since 2012 has posed significant challenges for first-time buyers, especially given such low supply in affordable price-tiers. There is a silver lining on the horizon, however. Rising prices and increased equity may tip the scales for homeowners who have been delaying their decision to move up, which could add much-needed starter-home inventory to the market.”
| Market Summary | February 2017 | Month-Over-Month | Year-Over-Year |
|---|---|---|---|
| Median sale price | $260,900 | 0.0% | 7.2% |
| Homes sold | 170,700 | -2.0% | 1.8% |
| New listings | 259,100 | 10.0% | -6.4% |
| All Homes for sale | 678,200 | 1.0% | -12.9% |
| Median days on market | 60 | 1 | -8 |
| Months of supply | 4 | 0.1 | -0.6 |
| Sold above list | 19.1% | 0.9% | 1.1% |
| Average Sale-to-list | 93.4% | -1.1% | -0.2% |
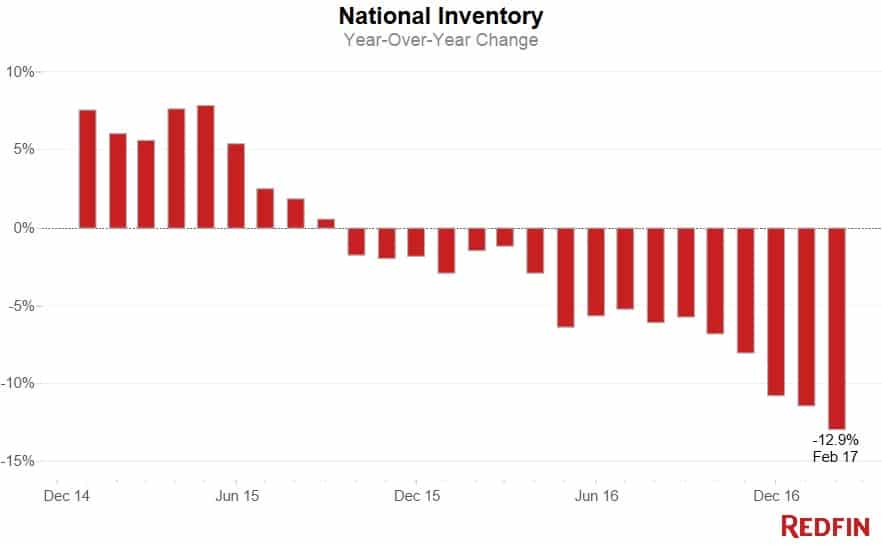
Home sales, constrained by a lack of supply, increased just 1.8 percent over last year. February saw a 6.4 percent decline in new listings and a 12.9 percent decline in the overall number of homes for sale, marking the third month in a row inventory has fallen by double-digits and the 17th consecutive month of year-over-year supply declines.
The supply shortage’s effect on home prices was most pronounced in the affordable segment of the housing market. Homes priced below $240,000, which represents the lowest tercile of prices across metros analyzed by Redfin, saw February prices increase 8.4 percent year over year and by 100 percent since the market troughed in 2012.
In comparison, mid range homes priced between $241,900 and $432,000, experienced 5.5 percent growth from this time last year and 55 percent since 2012. This strong rate of price growth in conjunction with even gently rising rates set up a challenging environment for 2017 first-time buyers.
On Wednesday the Federal Reserve raised the fed funds rate by a quarter of a percentage point, which may lead to a slight increase in mortgage rates this spring. Based upon last month’s median sale price of $260,900 and a 30-year fixed mortgage rate of 4.2 percent, the average mortgage payment was $150 more per month than the same time last year when the the 30-year mortgage rate was 3.6 percent.
In a recent homebuyer survey conducted by Survey Gizmo, a small handful of buyers said they would stop their home search if mortgage rates exceeded four percent. However, one in four said they would either search in a different neighborhood or purchase a smaller home.
Notwithstanding affordability concerns and low inventory, February still proved to be a strong month for buyer demand. Market speed increased again, making for the fastest February Redfin has on record since 2010. The typical home that sold last month went under contract in 60 days, eight days faster than one year prior. Nearly 15 percent of all homes listed for sale in February were off the market within two weeks, up from 11.7 percent last year.
“Despite strong buyer demand, many sellers are suffering from analysis paralysis right now,” said Redfin Sacramento real estate agent Chris Medina. “Prospective sellers greatest fear is they will not find another home to buy. But low inventory is precisely why they have so much power, especially if they list early in the season. The fewer homes that are on the market, the less competition they have from other sellers. Selling before you buy also makes your offer on your replacement home stronger since you’ll have cash in hand. I have not had a single buyer push back when my seller negotiates the option to lease the home back from the buyer for 60 days in order to have time to find their next home. On the contrary, they usually ask, ‘how much time do you need?’”
Other February Highlights
Competition
- Seattle, WA was the fastest market, with nearly half of all homes pending sale in just 12 days, down from 13 days from a year earlier. Oakland, CA and Denver, CO were the next fastest markets with 15 and 18 median days on market, followed by San Jose, CA (21) and San Francisco, CA (28).
- Competition was fierce in San Jose, CA where 63.1% of homes sold above list price, followed by 62.0% in San Francisco, CA, 59.1% in Oakland, CA, 49.3% in Seattle, WA, and 36.3% in Tacoma, WA. In sharp contrast, 0.0% of homes in Kansas City, MO sold above the list price.
Prices
- Portsmouth, NH had the nation’s highest price growth, rising 21.4% since last year to $285,000. Deltona, FL had the second highest growth at 20.1% year-over-year price growth, followed by Tampa, FL (18.8%), Jacksonville, FL (18.7%), and Ogden, UT (17.2%).
- Prices declined in four metros, including Baton Rouge, LA (-4.2%), Wilmington, DE (-2.5%), Honolulu, HI (-1%), and Pittsburgh, PA (-0.8%).
Sales
- 17 out of 90 metros saw sales surge by double digits from last year. Charleston, SC led the nation in year-over-year sales growth, up 39.2%, followed by St. Louis, MO, up 30%. Fort Myers, FL rounded out the top three with sales up 25.2% from a year ago.
- Albany, NY saw the largest dip in sales since last year, falling 22.5%. Home sales in Portsmouth, NH declined by 22.4% as well.
Inventory
- Rochester, NY had the largest decrease in overall inventory, falling 42.4% since last February. Buffalo, NY (-37.8%), Seattle, WA (-35.3%), and Omaha, NE (-34.7%) also saw far fewer homes available on the market than a year ago.
- Provo, UT had the highest increase in the number of homes for sale, up 30.7% year over year, followed by Knoxville, TN (21.6%) and New Orleans, LA (16.1%).
Below are market-by-market breakdowns for prices, inventory, new listings and sales for markets with populations of 1.5 million or more. For downloadable data on all of the markets Redfin tracks, visit the Redfin Data Center.
Median Sale Price
| Redfin Metro | Median Sale Price | Month-Over-Month | Year-Over-Year |
|---|---|---|---|
| Atlanta, GA | $200,000 | 3.9% | 7.5% |
| Austin, TX | $285,000 | 2.7% | 6.0% |
| Baltimore, MD | $230,000 | -2.1% | 3.1% |
| Boston, MA | $344,000 | -7.0% | 7.5% |
| Charlotte, NC | $200,200 | -2.3% | 10.2% |
| Chicago, IL | $207,000 | -1.4% | 10.7% |
| Cincinnati, OH | $142,000 | -5.3% | 5.2% |
| Cleveland, OH | $120,000 | 0.0% | 11.1% |
| Columbus, OH | $165,000 | 3.1% | 5.2% |
| Dallas-Fort Worth, TX | $245,000 | 6.5% | 14.0% |
| Denver, CO | $353,500 | 2.5% | 8.1% |
| Detroit, MI | $145,000 | -2.7% | 7.4% |
| Edison, NJ | $265,500 | -6.7% | 0.2% |
| Fort Lauderdale, FL | $210,000 | -4.5% | 5.0% |
| Hampton Roads, VA | $210,000 | 2.4% | 6.7% |
| Houston, TX | $220,000 | 4.8% | 9.6% |
| Indianapolis, IN | $154,000 | 7.0% | 10.8% |
| Kansas City, MO | $175,000 | 0.1% | 6.1% |
| Las Vegas, NV | $221,600 | 2.5% | 9.9% |
| Long Island, NY | $385,000 | -7.2% | 4.1% |
| Los Angeles, CA | $540,000 | 0.3% | 7.8% |
| Miami, FL | $265,000 | 1.9% | 10.4% |
| Milwaukee, WI | $163,000 | -11.9% | 3.2% |
| Minneapolis-St. Paul, MN | $224,900 | 0.0% | 4.6% |
| Nashville, TN | $251,900 | 2.8% | 10.2% |
| Oakland, CA | $600,000 | 3.4% | 7.1% |
| Orange County, CA | $620,000 | 0.2% | 5.6% |
| Orlando, FL | $209,600 | 2.1% | 15.8% |
| Philadelphia, PA | $209,900 | -2.4% | 2.4% |
| Phoenix, AZ | $232,000 | 1.4% | 7.9% |
| Pittsburgh, PA | $129,000 | -7.9% | -0.8% |
| Portland, OR | $340,000 | 0.0% | 11.5% |
| Riverside-San Bernardino, CA | $324,000 | 2.9% | 8.0% |
| Sacramento, CA | $340,000 | 3.3% | 6.2% |
| San Antonio, TX | $197,500 | 3.9% | 4.0% |
| San Diego, CA | $505,000 | -1.0% | 8.6% |
| San Francisco, CA | $1,180,500 | 14.6% | 7.3% |
| San Jose, CA | $881,000 | 7.4% | 7.0% |
| Seattle, WA | $455,000 | 3.4% | 12.9% |
| St. Louis, MO | $150,000 | -2.1% | 1.4% |
| Tampa, FL | $196,000 | 5.4% | 18.8% |
| Washington, DC | $360,000 | -2.1% | 1.6% |
| National | $260,900 | 0.0% | 7.2% |
Homes Sold
| Redfin Metro | Homes Sold | Month-Over-Month | Year-Over-Year |
|---|---|---|---|
| Atlanta, GA | 6,842 | 8.4% | 9.2% |
| Austin, TX | 1,855 | 14.7% | -3.7% |
| Baltimore, MD | 2,928 | 8.9% | 12.5% |
| Boston, MA | 3,028 | -26.8% | -8.4% |
| Charlotte, NC | 1,894 | 0.5% | -1.1% |
| Chicago, IL | 6,997 | -11.3% | 5.6% |
| Cincinnati, OH | 1,362 | -2.9% | -1.4% |
| Cleveland, OH | 1,514 | -4.1% | -6.7% |
| Columbus, OH | 1,620 | -20.4% | 13.8% |
| Dallas-Fort Worth, TX | 5,646 | 13.2% | -8.5% |
| Denver, CO | 3,389 | 1.5% | 12.8% |
| Detroit, MI | 3,738 | -25.7% | -8.6% |
| Edison, NJ | 2,031 | -17.4% | 9.7% |
| Fort Lauderdale, FL | 2,401 | 6.4% | -6.0% |
| Hampton Roads, VA | 1,391 | 10.2% | -2.2% |
| Houston, TX | 5,103 | 20.9% | 2.0% |
| Indianapolis, IN | 1,674 | 6.7% | -5.4% |
| Kansas City, MO | 1,751 | 2.4% | 1.4% |
| Las Vegas, NV | 2,744 | 2.5% | 1.9% |
| Long Island, NY | 1,759 | -30.4% | -12.7% |
| Los Angeles, CA | 4,468 | -6.5% | -1.3% |
| Miami, FL | 2,171 | 3.4% | -7.3% |
| Milwaukee, WI | 988 | -13.5% | 1.3% |
| Minneapolis-St. Paul, MN | 3,396 | -1.6% | 21.2% |
| Nashville, TN | 2,188 | 1.9% | 2.7% |
| Oakland, CA | 1,423 | -6.4% | -1.1% |
| Orange County, CA | 1,899 | -2.1% | 0.2% |
| Orlando, FL | 3,376 | 11.9% | 23.1% |
| Philadelphia, PA | 3,109 | -8.0% | 10.3% |
| Phoenix, AZ | 6,455 | 7.0% | 12.9% |
| Pittsburgh, PA | 1,326 | -5.0% | 14.1% |
| Portland, OR | 2,257 | -7.2% | -8.5% |
| Riverside-San Bernardino, CA | 3,737 | -2.8% | 3.8% |
| Sacramento, CA | 1,794 | -7.2% | -10.7% |
| San Antonio, TX | 1,699 | 10.0% | -7.4% |
| San Diego, CA | 2,248 | 3.5% | -2.0% |
| San Francisco, CA | 656 | -2.2% | -10.1% |
| San Jose, CA | 805 | 2.9% | 4.5% |
| Seattle, WA | 2,769 | -2.1% | 1.2% |
| St. Louis, MO | 2,291 | 6.3% | 30.0% |
| Tampa, FL | 4,564 | 8.9% | 16.0% |
| Washington, DC | 5,273 | -7.4% | 2.7% |
| National | 170,700 | -2.0% | 1.8% |
All Homes for Sale
| Redfin Metro | All Homes for Sale | Month-Over-Month | Year-Over-Year |
|---|---|---|---|
| Atlanta, GA | 29,409 | 9.2% | -6.4% |
| Austin, TX | 5,432 | 2.1% | 6.8% |
| Baltimore, MD | 8,761 | -4.5% | -21.1% |
| Boston, MA | 8,346 | -4.4% | -26.2% |
| Charlotte, NC | 8,946 | 13.2% | -6.2% |
| Chicago, IL | 37,726 | 9.9% | -12.6% |
| Cincinnati, OH | 7,327 | 7.9% | -16.1% |
| Cleveland, OH | 7,878 | 1.0% | -20.4% |
| Columbus, OH | 5,694 | 4.8% | -13.1% |
| Dallas-Fort Worth, TX | 13,670 | -6.0% | -13.6% |
| Denver, CO | 4,178 | -6.6% | -30.7% |
| Detroit, MI | 10,025 | -6.4% | -30.1% |
| Edison, NJ | 11,979 | -2.6% | -11.6% |
| Fort Lauderdale, FL | 13,870 | -0.6% | -13.8% |
| Hampton Roads, VA | 7,016 | -1.4% | -13.1% |
| Houston, TX | 21,814 | -0.5% | -2.8% |
| Indianapolis, IN | 5,983 | -2.3% | -22.0% |
| Las Vegas, NV | 10,889 | 1.4% | -22.5% |
| Long Island, NY | 9,803 | 2.4% | -22.5% |
| Los Angeles, CA | 13,887 | -3.1% | -5.0% |
| Miami, FL | 18,385 | -0.8% | -1.8% |
| Milwaukee, WI | 5,283 | 8.3% | -15.8% |
| Minneapolis-St. Paul, MN | 8,672 | 5.4% | -19.8% |
| Nashville, TN | 8,143 | 4.8% | 7.5% |
| Oakland, CA | 2,061 | 3.7% | -12.0% |
| Orange County, CA | 6,051 | 0.3% | -6.9% |
| Orlando, FL | 9,397 | -5.5% | -25.1% |
| Philadelphia, PA | 13,447 | 6.0% | -17.5% |
| Phoenix, AZ | 21,604 | -0.1% | -15.2% |
| Pittsburgh, PA | 8,028 | 2.7% | -14.6% |
| Portland, OR | 4,035 | -9.3% | -10.4% |
| Riverside-San Bernardino, CA | 14,842 | -2.7% | -9.1% |
| Sacramento, CA | 3,372 | -6.9% | -25.4% |
| San Antonio, TX | 6,469 | -4.1% | -15.0% |
| San Diego, CA | 4,520 | -6.4% | -28.3% |
| San Francisco, CA | 1,664 | 13.4% | -5.3% |
| San Jose, CA | 1,589 | 26.9% | -2.0% |
| Seattle, WA | 2,619 | -12.0% | -35.3% |
| St. Louis, MO | 12,426 | 16.6% | 14.8% |
| Tampa, FL | 12,777 | -5.4% | -24.6% |
| Washington, DC | 13,127 | 0.7% | -18.9% |
| National | 678,200 | 1.0% | -12.9% |
New Listings
| Redfin Metro | New Listings | Month-Over-Month | Year-Over-Year |
|---|---|---|---|
| Atlanta, GA | 9,561 | 12.3% | -3.6% |
| Austin, TX | 2,948 | 15.3% | 0.8% |
| Baltimore, MD | 3,690 | 17.0% | 1.1% |
| Boston, MA | 4,617 | 4.6% | -11.3% |
| Charlotte, NC | 3,112 | 24.2% | 15.7% |
| Chicago, IL | 13,133 | 32.1% | -8.5% |
| Cincinnati, OH | 2,192 | 12.6% | -8.9% |
| Cleveland, OH | 2,427 | 8.9% | -9.0% |
| Columbus, OH | 2,268 | 16.8% | 0.0% |
| Dallas-Fort Worth, TX | 8,322 | 8.4% | -4.4% |
| Denver, CO | 4,215 | 20.2% | 1.9% |
| Detroit, MI | 5,022 | 13.3% | -5.3% |
| Edison, NJ | 3,741 | 17.2% | 0.6% |
| Fort Lauderdale, FL | 4,110 | -8.4% | -16.5% |
| Hampton Roads, VA | 2,156 | 8.5% | -3.7% |
| Houston, TX | 8,558 | 7.8% | -3.6% |
| Indianapolis, IN | 2,428 | 29.1% | -0.2% |
| Kansas City, MO | 2,911 | 31.9% | 3.0% |
| Las Vegas, NV | 3,677 | 0.0% | -9.8% |
| Long Island, NY | 2,941 | 10.5% | 0.7% |
| Los Angeles, CA | 6,504 | -1.0% | -14.4% |
| Miami, FL | 4,300 | -8.3% | -14.1% |
| Milwaukee, WI | 1,659 | 33.5% | -7.9% |
| Minneapolis-St. Paul, MN | 4,914 | 41.8% | -6.6% |
| Nashville, TN | 3,096 | 5.8% | -0.8% |
| Oakland, CA | 2,151 | 19.3% | -12.8% |
| Orange County, CA | 2,799 | 6.1% | -13.8% |
| Orlando, FL | 4,205 | 1.6% | -3.7% |
| Philadelphia, PA | 5,086 | 21.7% | 1.6% |
| Phoenix, AZ | 9,031 | -1.6% | -7.0% |
| Pittsburgh, PA | 1,798 | 16.6% | 6.0% |
| Portland, OR | 2,880 | 23.7% | -20.3% |
| Riverside-San Bernardino, CA | 5,378 | 2.0% | -11.2% |
| Sacramento, CA | 2,313 | 6.6% | -21.3% |
| San Antonio, TX | 2,475 | 3.0% | -8.7% |
| San Diego, CA | 3,109 | 2.7% | -18.6% |
| San Francisco, CA | 1,056 | 6.6% | -20.7% |
| San Jose, CA | 1,228 | 23.2% | -13.3% |
| Seattle, WA | 3,277 | 9.2% | -15.3% |
| St. Louis, MO | 3,892 | 29.0% | 7.2% |
| Tampa, FL | 5,823 | -3.7% | -7.0% |
| Washington, DC | 8,161 | 30.6% | 6.5% |
| National | 259,100 | 10.0% | -6.4% |


