
Supply of homes for sale was down 24% from a year ago in April and new listings fell by 42%, but home prices were still up 5%
The effects of the coronavirus pandemic and subsequent shutdowns hit the U.S. housing market in full force in April, with sales and listings both turning in historic declines from year-ago levels. In the past two months, the housing market has seen the fastest slowdown on record as it flipped from one of the strongest markets ever at the end of February to a near standstill in April.
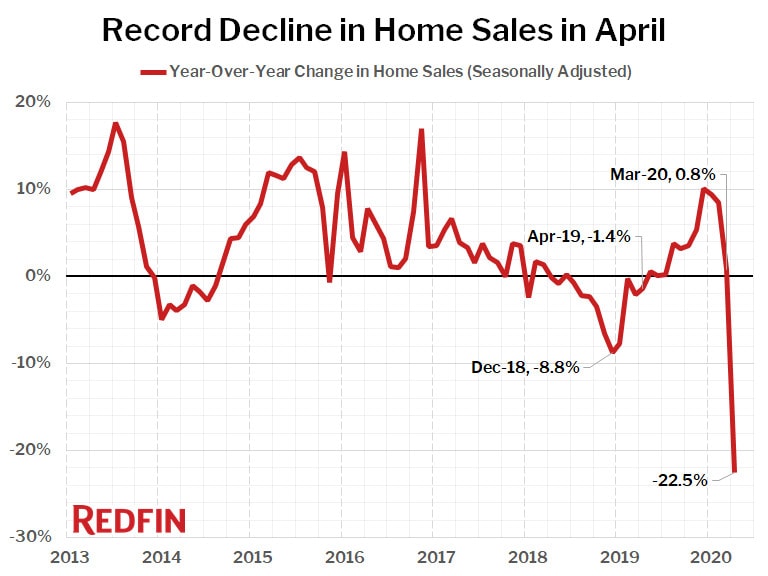
Home sales in April plunged 22.5% from a year ago, as did both the number of homes newly listed for sale (-42.4%) and the number of homes available for sale (-24.5%). Home prices were still up from a year ago, but the rate of growth in the U.S. median home sale price stumbled slightly to 4.9% year over year, down from 6.9% in March. The national median sale price in April was $303,895.
April home sales fell 23% nationwide from March on a seasonally-adjusted basis, by far the largest decline on record (our data for this statistic goes back to January 2012). In general, markets with the biggest declines in home sales from a year ago were the most expensive, although due to especially tight restrictions on real estate during the shutdown, Detroit was also one of the three markets where sales slowed the most: San Francisco (-53.9%), Detroit (-46.8%) and New York (-45.8%).
| Market Summary | April 2020 | Month-Over-Month | Year-Over-Year |
|---|---|---|---|
| Median sale price | $303,900 | 0.3% | 4.9% |
| Homes sold, seasonally-adjusted | 409,100 | -22.8% | -22.5% |
| New listings, seasonally-adjusted | 361,800 | -34.9% | -42.4% |
| All Homes for sale, seasonally-adjusted | 1,662,200 | -14.4% | -24.5% |
| Median days on market | 35 | -9 | -7 |
| Months of supply | 2.88 | 0.35 | 0.05 |
| Sold above list | 27.7% | 2.5 pts† | 3.6 pts† |
| Median Off-Market Redfin Estimate | $296,600 | 0.5% | 1.7% |
| Average Sale-to-list | 98.8% | 0.2 pts† | 0.4 pts† |
“The supply of homes for sale declined even more dramatically than homebuyer demand in April,” said Redfin lead economist Taylor Marr. “While home sales fell the most in more expensive markets, in more affordable areas prices continued to increase. Even during the depths of the slowdown last month the market was still faster and more competitive than it was a year earlier.”
Many of the nation’s most affordable housing markets are continuing to see sizable price gains. Nine of the top 10 metro areas where home prices rose the most year over year still had median prices below the national level, led in April by Detroit, (median price $159,900, +27.9%), Memphis ($217,000 +22.0%) and Philadelphia ($250,000, +19.0%).
Only one of the 85 largest metro areas Redfin tracks saw a year-over-year decline in the median sale price: San Francisco at -0.2%.

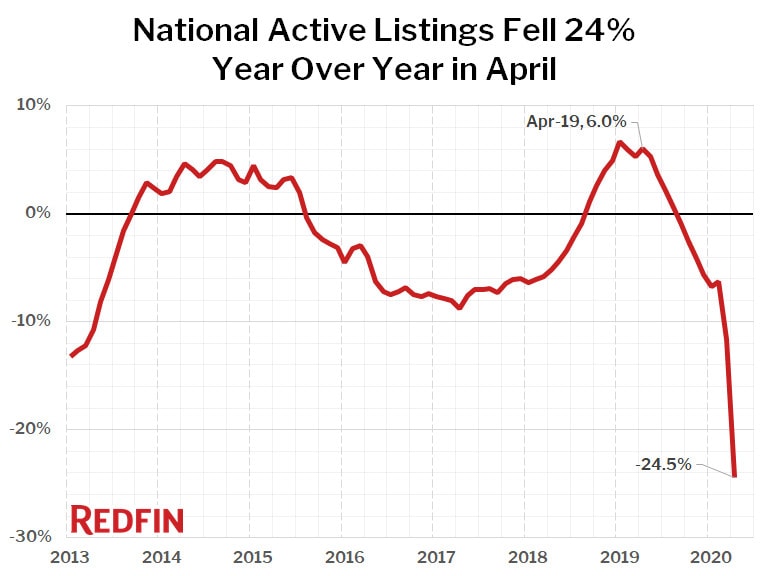
The national count of active listings of homes for sale fell 24.5% year over year during April, the biggest drop on record and the eighth straight month of declines. There were fewer homes for sale last month than any time since at least January 2012, which is as far back as we have recorded this measure. None of the 85 largest metros tracked by Redfin posted a year-over-year increase in the count of seasonally-adjusted active listings of homes for sale. The smallest declines were in Greenville, SC (-7.6%), El Paso (-8.0%) and Omaha (-10.2%). Active listings is a count of all homes that were for sale at any time during the month.
Compared to a year ago, the biggest declines in active housing supply in April were in Allentown, PA (-55.4%), Kansas City, MO (-48.8%) and Tulsa (-48.5%).
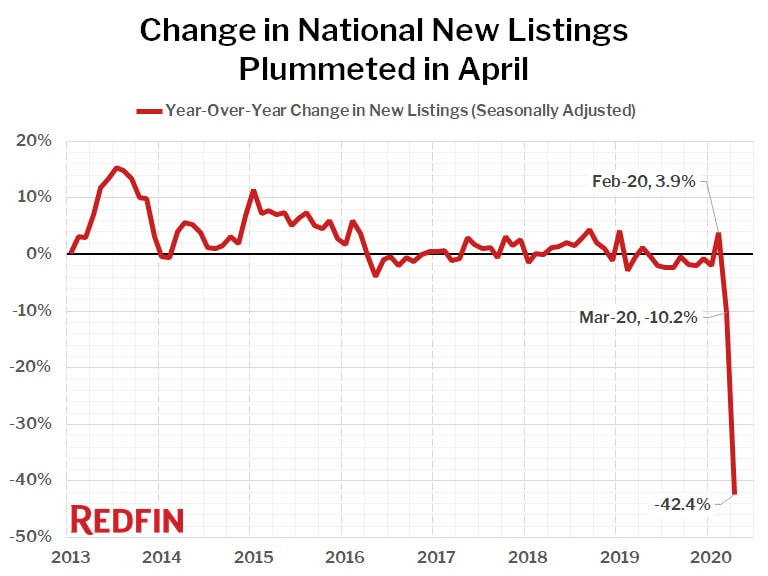
The number of new listings continued to plunge in April, falling 42.4% compared with a year earlier and down 34.9% from March. This dwarfs all other declines on record, although by the end of the month we did start to see listings begin to rebound.
So far the pandemic has only slightly slowed the rapid gains we had been seeing earlier in the year in the sales prices of homes. The median price of homes that sold in April was up 4.9% from a year earlier, slightly less than the previous four months, which all saw gains over 6%. However, even that dip was likely mostly caused by a decline in the number of high-end homes that are selling during this crisis relative to other price ranges.
“The typical time between when a home went under contract and when the sale closes is still about four weeks nationally,” explained Marr. “This means that many of the homes sold in April went under contract after the WHO declared that COVID-19 was a global pandemic, after initial claims for unemployment set new records, and after case numbers were already growing rapidly in the U.S. So, although some might have expected this dramatic disruption in the market to impact home prices, we haven’t yet seen evidence that it has had much of an effect.”
One thing that may be helping to prop up prices is low mortgage rates, which were as low as 3.29% during the first week of March when many offers were made on homes that sold in April. This was 1.12 percentage points lower than the same week of 2019, a monthly savings of $156 on the mortgage payment of the median-priced home.
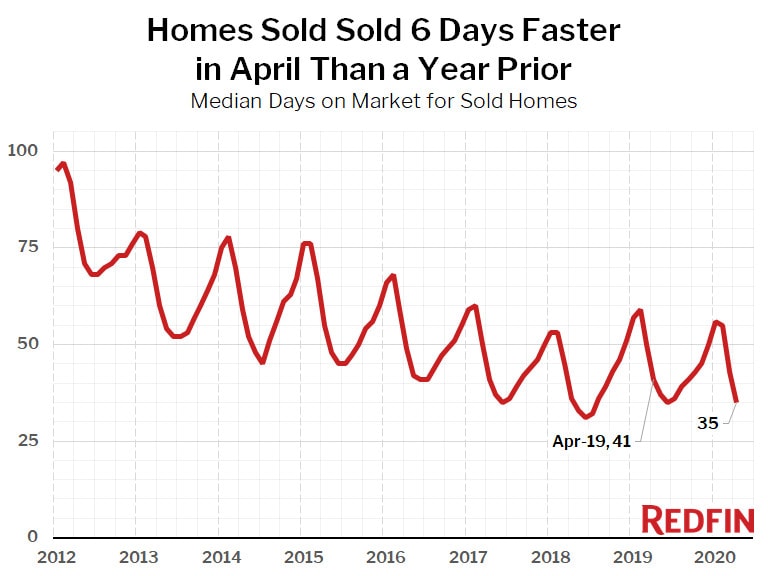
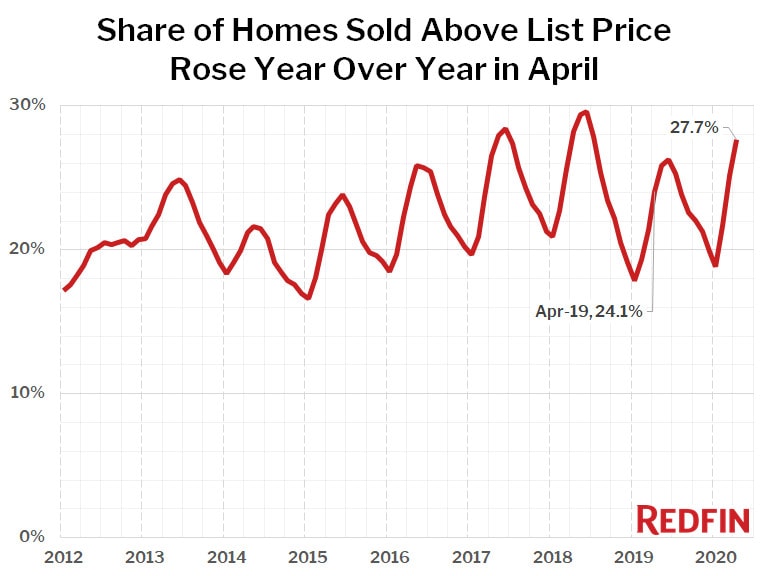
Other measures of the market showed how competitive it was in April, despite lockdowns across the nation. Homes sold faster and a greater share sold for over list price than a year ago, clearly indicating that it is still a seller’s market.
Homes that sold in April spent six fewer days on market compared to the prior year. In April, the typical home went under contract in 35 days, compared to 41 days in April 2019.
The share of homes that sold above list price increased 3.6 percentage points year over year, coming in at 27.7% in April compared to 24.1% a year earlier.
Other April Highlights
Competition
- Tacoma, WA was the fastest market, with half of all homes pending sale in just 5 days, down from 9 days a year earlier. Denver and Seattle were the next fastest markets with 6 median days on market, followed by Grand Rapids, MI (8) and Sacramento, CA (10).
- The most competitive market in April was Tacoma, WA where 65.8% of homes sold above list price, followed by 64.1% in Oakland, CA, 64.0% in San Jose, CA, 62.8% in San Francisco, and 47.5% in Rochester, NY.
Prices
- Detroit had the nation’s highest price growth, rising 27.9% since last year to $159,900. Memphis, TN had the second highest growth at 22% year-over-year price growth, followed by Philadelphia (19%), Newark, NJ (18.8%), and Pittsburgh (17.3%).
- Only one metro saw prices decline in April: San Francisco (-0.2%).
Sales
- Only two metro areas saw year-over-year sales growth in April: Sales in Minneapolis were up 3.5%, followed by Bridgeport, CT, up 0.6%.
- San Francisco saw the largest decline in sales since last year, falling 53.9%. Home sales in Detroit and New York declined by 46.8% and 45.8%, respectively.
Inventory
- No metro areas had increases in the number of active listings for sale compared to a year ago.
- Allentown, PA had the largest decrease in overall active listings, falling 55.4% since last April. Kansas City, MO (-48.8%), Tulsa, OK (-48.5%), and Salt Lake City (-47.2%) also saw far fewer homes available on the market than a year ago.
Redfin Estimate
- Miami (85.8%) had the largest share of homes predicted to sell for below list price, according to Redfin Estimate data, followed by West Palm Beach, FL (83.9%) and Fort Lauderdale, FL (81.2%).
- San Jose, CA (90.2%) had the largest share of homes predicted to sell at or above list price, followed by Oakland, CA (88.2%) and San Francisco (87.9%).
Below are market-by-market breakdowns for prices, inventory, new listings and sales for markets with populations of 750,000 or more. For downloadable data on all of the markets Redfin tracks, visit the Redfin Data Center.
Median Sale Price
| Redfin Metro | Median Sale Price | Month-Over-Month | Year-Over-Year |
|---|---|---|---|
| Albany, NY | $223,000 | 6.5% | 1.5% |
| Allentown, PA | $220,000 | 5.6% | 16.9% |
| Anaheim, CA | $740,000 | -1.7% | 2.1% |
| Atlanta, GA | $270,000 | 3.8% | 9.1% |
| Austin, TX | $329,000 | -0.9% | 3.5% |
| Bakersfield, CA | $257,500 | 3.0% | 9.6% |
| Baltimore, MD | $300,000 | 2.7% | 9.1% |
| Baton Rouge, LA | $215,000 | -0.5% | 7.5% |
| Birmingham, AL | $236,000 | 2.6% | 9.6% |
| Boston, MA | $537,500 | 2.9% | 10.8% |
| Bridgeport, CT | $410,000 | 5.1% | 6.5% |
| Buffalo, NY | $169,800 | 10.6% | 17.1% |
| Camden, NJ | $221,000 | 10.4% | 16.3% |
| Charlotte, NC | $283,000 | 1.4% | 8.8% |
| Chicago, IL | $275,000 | 3.4% | 6.8% |
| Cincinnati, OH | $198,200 | 1.4% | 7.5% |
| Cleveland, OH | $167,500 | 6.7% | 14.3% |
| Columbus, OH | $230,000 | 0.0% | 4.1% |
| Dallas, TX | $305,000 | 0.8% | 3.4% |
| Dayton, OH | $156,500 | 1.0% | 12.8% |
| Denver, CO | $435,000 | -1.1% | 4.7% |
| Detroit, MI | $159,900 | 13.8% | 27.9% |
| El Paso, TX | $164,000 | -3.0% | 2.7% |
| Elgin, IL | $238,700 | 2.9% | 1.6% |
| Fort Lauderdale, FL | $295,000 | 1.7% | 11.3% |
| Fort Worth, TX | $260,000 | 4.0% | 7.0% |
| Frederick, MD | $446,500 | 6.3% | 5.1% |
| Fresno, CA | $285,000 | 1.8% | 5.6% |
| Grand Rapids, MI | $221,500 | -0.5% | 5.5% |
| Greensboro, NC | $200,800 | 1.2% | 6.5% |
| Greenville, SC | $229,900 | 1.1% | 7.0% |
| Hartford, CT | $236,000 | 4.3% | 7.8% |
| Houston, TX | $252,200 | 0.9% | 2.9% |
| Indianapolis, IN | $212,000 | 1.9% | 13.4% |
| Jacksonville, FL | $250,000 | 2.5% | 9.2% |
| Kansas City, MO | $235,500 | 0.2% | 4.7% |
| Knoxville, TN | $228,000 | 2.1% | 10.1% |
| Lake County, IL | $256,000 | 0.4% | 11.3% |
| Las Vegas, NV | $294,000 | -0.8% | 5.0% |
| Los Angeles, CA | $650,000 | -1.5% | 3.8% |
| Louisville, KY | $202,900 | 0.2% | 8.2% |
| McAllen, TX | $163,800 | 0.8% | 8.4% |
| Memphis, TN | $217,000 | 12.4% | 22.0% |
| Miami, FL | $335,000 | 1.5% | 9.8% |
| Milwaukee, WI | $245,000 | 4.3% | 9.9% |
| Minneapolis, MN | $306,000 | 2.3% | 8.9% |
| Montgomery County, PA | $342,000 | 3.6% | 11.8% |
| Nashville, TN | $314,400 | -0.2% | 8.4% |
| Nassau County, NY | $479,500 | 4.2% | 9.7% |
| New Brunswick, NJ | $345,000 | 3.0% | 11.3% |
| New Haven, CT | $227,500 | 3.4% | 10.2% |
| New Orleans, LA | $230,000 | 0.2% | 3.4% |
| New York, NY | $516,500 | 0.8% | 3.3% |
| Newark, NJ | $410,000 | 13.6% | 18.8% |
| North Port, FL | $292,000 | 2.5% | 8.1% |
| Oakland, CA | $800,000 | 5.9% | 6.7% |
| Oklahoma City, OK | $193,300 | -0.1% | 7.4% |
| Omaha, NE | $220,000 | 2.2% | 10.0% |
| Orlando, FL | $275,000 | 2.2% | 10.0% |
| Oxnard, CA | $622,100 | -0.5% | 3.7% |
| Philadelphia, PA | $250,000 | 6.4% | 19.0% |
| Phoenix, AZ | $303,500 | -0.5% | 10.8% |
| Pittsburgh, PA | $195,000 | 8.6% | 17.3% |
| Portland, OR | $415,000 | -0.8% | 5.1% |
| Providence, RI | $308,000 | 2.7% | 13.1% |
| Raleigh, NC | $310,000 | 2.6% | 5.1% |
| Richmond, VA | $275,000 | 3.8% | 6.4% |
| Riverside, CA | $395,000 | -1.0% | 5.3% |
| Rochester, NY | $159,600 | 5.0% | 14.0% |
| Sacramento, CA | $425,500 | -1.0% | 3.8% |
| Salt Lake City, UT | $363,200 | 0.1% | 7.1% |
| San Antonio, TX | $239,900 | 0.4% | 5.4% |
| San Diego, CA | $610,000 | 1.8% | 5.1% |
| San Francisco, CA | $1,422,500 | -1.9% | -0.2% |
| San Jose, CA | $1,200,000 | 0.3% | 4.3% |
| Seattle, WA | $600,000 | 2.6% | 4.8% |
| St. Louis, MO | $199,900 | 5.3% | 11.1% |
| Tacoma, WA | $400,000 | -2.9% | 12.0% |
| Tampa, FL | $251,000 | 2.4% | 10.8% |
| Tucson, AZ | $244,000 | 1.7% | 13.5% |
| Tulsa, OK | $181,000 | -0.3% | 6.5% |
| Honolulu, HI | $625,000 | -2.2% | 9.2% |
| Virginia Beach, VA | $250,000 | 2.3% | 4.6% |
| Warren, MI | $228,000 | 2.7% | 8.6% |
| Washington, D.C. | $449,900 | 3.2% | 7.1% |
| West Palm Beach, FL | $310,000 | 4.1% | 9.9% |
| Worcester, MA | $293,000 | 6.0% | 10.6% |
| National | $303,900 | 0.3% | 4.9% |
Homes Sold
| Redfin Metro | Homes Sold, seasonally adjusted | Month-Over-Month | Year-Over-Year |
|---|---|---|---|
| Albany, NY | 675 | -15.5% | -16.3% |
| Allentown, PA | 613 | -29.5% | -31.0% |
| Anaheim, CA | 1,451 | -38.7% | -38.4% |
| Atlanta, GA | 6,862 | -24.2% | -23.5% |
| Austin, TX | 2,254 | -28.2% | -25.9% |
| Bakersfield, CA | 554 | -20.4% | -30.5% |
| Baltimore, MD | 3,059 | -16.1% | -12.8% |
| Baton Rouge, LA | 789 | -8.2% | -10.4% |
| Birmingham, AL | 1,084 | -15.9% | -20.3% |
| Boston, MA | 3,851 | -6.9% | -14.1% |
| Bridgeport, CT | 971 | -7.1% | 0.4% |
| Buffalo, NY | 806 | -19.4% | -20.3% |
| Camden, NJ | 1,308 | -20.2% | -23.3% |
| Charlotte, NC | 3,095 | -25.4% | -19.9% |
| Chicago, IL | 6,667 | -17.0% | -14.6% |
| Cincinnati, OH | 2,138 | -17.0% | -20.2% |
| Cleveland, OH | 2,101 | -18.2% | -16.0% |
| Columbus, OH | 2,373 | -7.8% | -9.2% |
| Dallas, TX | 4,391 | -22.6% | -21.8% |
| Dayton, OH | 714 | -30.7% | -28.0% |
| Denver, CO | 3,470 | -27.3% | -24.4% |
| Detroit, MI | 998 | -41.1% | -45.5% |
| El Paso, TX | 635 | -9.4% | -14.7% |
| Elgin, IL | 894 | -6.7% | -4.8% |
| Fort Lauderdale, FL | 1,530 | -46.4% | -49.5% |
| Fort Worth, TX | 2,184 | -23.4% | -25.0% |
| Frederick, MD | 1,230 | -23.2% | -13.7% |
| Fresno, CA | 601 | -12.2% | -18.6% |
| Grand Rapids, MI | 903 | -32.0% | -28.2% |
| Greensboro, NC | 694 | -9.9% | -14.4% |
| Greenville, SC | 950 | -16.0% | -17.0% |
| Hartford, CT | 1,305 | -3.9% | 1.4% |
| Houston, TX | 5,751 | -25.5% | -23.3% |
| Indianapolis, IN | 2,516 | -17.6% | -9.7% |
| Jacksonville, FL | 1,881 | -26.5% | -24.1% |
| Kansas City, MO | 2,828 | -6.1% | -4.1% |
| Knoxville, TN | 1,056 | -11.5% | -14.7% |
| Lake County, IL | 963 | -8.8% | -11.8% |
| Las Vegas, NV | 2,094 | -36.0% | -38.1% |
| Los Angeles, CA | 3,530 | -33.1% | -38.3% |
| Louisville, KY | 1,152 | -11.3% | -12.7% |
| McAllen, TX | 230 | -18.4% | -30.6% |
| Memphis, TN | 893 | -12.0% | -19.3% |
| Miami, FL | 1,343 | -43.9% | -49.4% |
| Milwaukee, WI | 1,684 | -6.0% | -5.5% |
| Minneapolis, MN | 5,291 | -1.1% | 6.8% |
| Montgomery County, PA | 1,829 | -19.4% | -18.2% |
| Nashville, TN | 2,787 | -18.5% | -17.9% |
| Nassau County, NY | 1,824 | -14.5% | -31.1% |
| New Brunswick, NJ | 2,453 | -19.8% | -18.9% |
| New Haven, CT | 826 | -6.9% | -10.2% |
| New Orleans, LA | 873 | -28.9% | -29.2% |
| New York, NY | 2,713 | -31.6% | -41.5% |
| Newark, NJ | 1,848 | -7.0% | -14.8% |
| North Port, FL | 1,342 | -33.6% | -28.0% |
| Oakland, CA | 1,400 | -33.2% | -37.7% |
| Oklahoma City, OK | 1,771 | -3.8% | -4.5% |
| Omaha, NE | 1,075 | -8.0% | -0.4% |
| Orlando, FL | 2,806 | -27.6% | -27.6% |
| Oxnard, CA | 479 | -32.0% | -32.0% |
| Philadelphia, PA | 1,393 | -32.1% | -35.4% |
| Phoenix, AZ | 5,762 | -25.4% | -27.4% |
| Pittsburgh, PA | 1,619 | -23.4% | -22.2% |
| Portland, OR | 2,463 | -26.1% | -20.9% |
| Providence, RI | 1,473 | -22.2% | -14.3% |
| Raleigh, NC | 2,017 | -19.6% | -11.3% |
| Richmond, VA | 1,543 | -3.8% | 1.8% |
| Riverside, CA | 3,031 | -35.4% | -34.8% |
| Rochester, NY | 797 | -22.2% | -24.6% |
| Sacramento, CA | 1,800 | -28.9% | -30.1% |
| Salt Lake City, UT | 1,111 | -21.5% | -31.7% |
| San Antonio, TX | 2,310 | -18.3% | -16.5% |
| San Diego, CA | 1,908 | -34.2% | -33.7% |
| San Francisco, CA | 400 | -53.6% | -58.3% |
| San Jose, CA | 606 | -44.1% | -47.4% |
| Seattle, WA | 2,734 | -31.8% | -29.4% |
| St. Louis, MO | 2,874 | -15.1% | -14.2% |
| Tacoma, WA | 955 | -22.5% | -28.3% |
| Tampa, FL | 3,933 | -26.6% | -26.3% |
| Tucson, AZ | 1,115 | -25.3% | -25.4% |
| Tulsa, OK | 979 | -3.3% | -18.0% |
| Honolulu, HI | 549 | -25.6% | -28.2% |
| Virginia Beach, VA | 2,111 | -6.7% | 2.4% |
| Warren, MI | 2,046 | -40.0% | -39.6% |
| Washington, D.C. | 4,970 | -20.5% | -18.2% |
| West Palm Beach, FL | 1,532 | -44.0% | -45.1% |
| Worcester, MA | 918 | -12.3% | -9.6% |
| National | 409,100 | -22.8% | -22.5% |
New Listings
| Redfin Metro | New Listings, seasonally adjusted | Month-Over-Month | Year-Over-Year |
|---|---|---|---|
| Albany, NY | 385 | -56.5% | -62.3% |
| Allentown, PA | -22 | -103.2% | -102.1% |
| Anaheim, CA | 1,088 | -49.6% | -62.9% |
| Atlanta, GA | 7,279 | -24.6% | -31.3% |
| Austin, TX | 2,516 | -27.9% | -25.9% |
| Bakersfield, CA | 476 | -40.8% | -51.6% |
| Baltimore, MD | 2,429 | -37.9% | -43.2% |
| Baton Rouge, LA | 510 | -37.1% | -53.7% |
| Birmingham, AL | 1,059 | -14.0% | -34.2% |
| Boston, MA | 2,323 | -50.2% | -54.3% |
| Bridgeport, CT | 534 | -55.7% | -61.1% |
| Buffalo, NY | 230 | -75.5% | -80.1% |
| Camden, NJ | 679 | -57.2% | -67.2% |
| Charlotte, NC | 2,246 | -47.1% | -48.1% |
| Chicago, IL | 7,073 | -17.1% | -40.8% |
| Cincinnati, OH | 2,135 | -24.1% | -28.5% |
| Cleveland, OH | 1,828 | -28.9% | -38.1% |
| Columbus, OH | 2,067 | -23.1% | -27.2% |
| Dallas, TX | 4,977 | -26.1% | -32.2% |
| Dayton, OH | 638 | -38.7% | -42.4% |
| Denver, CO | 3,104 | -43.1% | -41.8% |
| Detroit, MI | 336 | -82.4% | -86.2% |
| El Paso, TX | 696 | -17.0% | -28.9% |
| Elgin, IL | 639 | -29.4% | -44.6% |
| Fort Lauderdale, FL | 1,810 | -41.4% | -55.0% |
| Fort Worth, TX | 2,670 | -11.1% | -22.6% |
| Frederick, MD | 926 | -39.4% | -44.3% |
| Fresno, CA | 548 | -29.4% | -41.2% |
| Grand Rapids, MI | 570 | -58.6% | -61.3% |
| Greensboro, NC | 665 | -6.0% | -26.2% |
| Greenville, SC | 982 | -15.1% | -24.2% |
| Hartford, CT | 822 | -43.9% | -50.4% |
| Houston, TX | 6,575 | -26.7% | -32.5% |
| Indianapolis, IN | 1,943 | -30.9% | -32.3% |
| Jacksonville, FL | 2,121 | -27.9% | -25.6% |
| Kansas City, MO | 712 | -71.4% | -80.0% |
| Knoxville, TN | 971 | -14.1% | -26.9% |
| Lake County, IL | 732 | -38.9% | -49.6% |
| Las Vegas, NV | 2,578 | -30.0% | -40.6% |
| Los Angeles, CA | 3,232 | -37.2% | -55.2% |
| Louisville, KY | 1,075 | -19.9% | -28.0% |
| McAllen, TX | 247 | -37.9% | -45.9% |
| Memphis, TN | 945 | -14.9% | -32.8% |
| Miami, FL | 1,902 | -35.8% | -54.5% |
| Milwaukee, WI | 1,053 | -41.1% | -44.3% |
| Minneapolis, MN | 3,978 | -33.0% | -27.1% |
| Montgomery County, PA | 5 | -99.7% | -99.8% |
| Nashville, TN | 3,065 | -22.2% | -24.4% |
| Nassau County, NY | 72 | -96.5% | -97.9% |
| New Brunswick, NJ | 1,265 | -52.0% | -67.9% |
| New Haven, CT | 492 | -52.0% | -56.3% |
| New Orleans, LA | 867 | -38.6% | -44.6% |
| New York, NY | 1,084 | -70.5% | -87.6% |
| Newark, NJ | 267 | -85.5% | -90.6% |
| North Port, FL | 1,375 | -35.2% | -39.8% |
| Oakland, CA | 963 | -47.9% | -63.8% |
| Oklahoma City, OK | 1,520 | -30.8% | -27.4% |
| Omaha, NE | 832 | -33.1% | -29.7% |
| Orlando, FL | 2,814 | -35.4% | -38.2% |
| Oxnard, CA | 422 | -38.6% | -49.2% |
| Philadelphia, PA | 260 | -87.4% | -90.4% |
| Phoenix, AZ | 6,832 | -20.2% | -22.6% |
| Pittsburgh, PA | 113 | -93.3% | -95.5% |
| Portland, OR | 2,357 | -32.8% | -35.1% |
| Providence, RI | 1,059 | -48.2% | -51.6% |
| Raleigh, NC | 1,893 | -23.1% | -21.7% |
| Richmond, VA | 1,293 | -25.9% | -26.8% |
| Riverside, CA | 2,916 | -37.4% | -51.5% |
| Rochester, NY | 302 | -71.8% | -73.9% |
| Sacramento, CA | 1,911 | -36.0% | -38.6% |
| Salt Lake City, UT | 829 | -40.5% | -51.6% |
| San Antonio, TX | 2,474 | -19.8% | -27.5% |
| San Diego, CA | 1,744 | -38.8% | -49.8% |
| San Francisco, CA | 612 | -10.1% | -45.0% |
| San Jose, CA | 529 | -56.2% | -62.7% |
| Seattle, WA | 3,447 | -9.8% | -24.7% |
| St. Louis, MO | 1,898 | -36.2% | -53.1% |
| Tacoma, WA | 986 | -30.6% | -28.9% |
| Tampa, FL | 3,871 | -32.7% | -37.5% |
| Tucson, AZ | 1,158 | -28.5% | -29.4% |
| Tulsa, OK | 231 | -73.1% | -83.7% |
| Honolulu, HI | 476 | -41.5% | -52.1% |
| Virginia Beach, VA | 1,797 | -26.9% | -26.6% |
| Warren, MI | 563 | -83.3% | -87.0% |
| Washington, D.C. | 4,336 | -36.1% | -36.7% |
| West Palm Beach, FL | 1,661 | -50.5% | -53.0% |
| Worcester, MA | 661 | -44.4% | -44.3% |
| National | 361,800 | -34.9% | -42.4% |
All Homes for Sale
| Redfin Metro | All Homes for Sale, seasonally adjusted | Month-Over-Month | Year-Over-Year |
|---|---|---|---|
| Albany, NY | 2,854 | -22.6% | -32.4% |
| Allentown, PA | 1,655 | -31.8% | -54.3% |
| Anaheim, CA | 7,194 | -16.6% | -40.5% |
| Atlanta, GA | 32,006 | -6.5% | -13.0% |
| Austin, TX | 9,378 | -3.3% | -15.1% |
| Bakersfield, CA | 2,243 | -7.7% | -25.2% |
| Baltimore, MD | 10,832 | -20.8% | -27.3% |
| Baton Rouge, LA | 3,619 | -7.3% | -26.5% |
| Birmingham, AL | 4,634 | -7.1% | -25.6% |
| Boston, MA | 9,490 | -28.4% | -32.3% |
| Bridgeport, CT | 5,092 | -20.5% | -27.6% |
| Buffalo, NY | 2,135 | -27.3% | -37.7% |
| Camden, NJ | 5,106 | -21.5% | -40.8% |
| Charlotte, NC | 11,979 | -14.1% | -26.2% |
| Chicago, IL | 29,613 | -17.0% | -25.9% |
| Cincinnati, OH | 8,266 | -11.9% | -23.7% |
| Cleveland, OH | 7,674 | -16.2% | -31.6% |
| Columbus, OH | 7,813 | -5.8% | -12.7% |
| Dallas, TX | 21,281 | -11.5% | -17.7% |
| Dayton, OH | 3,010 | -6.9% | -18.2% |
| Denver, CO | 9,911 | -18.3% | -24.7% |
| Detroit, MI | 5,609 | -20.8% | -27.1% |
| El Paso, TX | 3,312 | -5.4% | -8.1% |
| Elgin, IL | 3,330 | -10.7% | -21.1% |
| Fort Lauderdale, FL | 14,119 | -10.5% | -22.6% |
| Fort Worth, TX | 9,629 | -8.3% | -11.9% |
| Frederick, MD | 3,824 | -17.5% | -28.1% |
| Fresno, CA | 1,950 | -10.2% | -29.5% |
| Grand Rapids, MI | 2,713 | -27.9% | -30.7% |
| Greensboro, NC | 1,997 | -11.2% | -36.7% |
| Greenville, SC | 4,889 | -4.5% | -7.3% |
| Hartford, CT | 4,920 | -15.3% | -26.0% |
| Houston, TX | 33,153 | -8.1% | -11.3% |
| Indianapolis, IN | 7,150 | -6.2% | -17.1% |
| Jacksonville, FL | 9,352 | -5.0% | -15.1% |
| Kansas City, MO | 5,418 | -31.4% | -48.1% |
| Knoxville, TN | 4,338 | -3.7% | -17.3% |
| Lake County, IL | 4,605 | -13.8% | -20.9% |
| Las Vegas, NV | 11,472 | -5.4% | -27.8% |
| Los Angeles, CA | 17,247 | -14.6% | -35.5% |
| Louisville, KY | 3,935 | -9.3% | -17.0% |
| McAllen, TX | 2,065 | -5.9% | -14.9% |
| Memphis, TN | 3,361 | -7.6% | -22.1% |
| Miami, FL | 18,409 | -8.6% | -17.9% |
| Milwaukee, WI | 5,482 | -13.0% | -16.9% |
| Minneapolis, MN | 13,390 | -15.8% | -14.4% |
| Montgomery County, PA | 4,528 | -38.6% | -49.9% |
| Nashville, TN | 13,397 | -4.5% | -12.1% |
| Nassau County, NY | 9,315 | -25.4% | -37.0% |
| New Brunswick, NJ | 10,518 | -23.9% | -37.7% |
| New Haven, CT | 3,543 | -18.5% | -28.3% |
| New Orleans, LA | 4,813 | -11.4% | -17.1% |
| New York, NY | 29,812 | -17.6% | -31.1% |
| Newark, NJ | 7,930 | -21.5% | -31.6% |
| North Port, FL | 7,677 | -3.7% | -21.6% |
| Oakland, CA | 3,772 | -19.8% | -41.5% |
| Oklahoma City, OK | 6,257 | -4.1% | -13.5% |
| Omaha, NE | 2,589 | -16.4% | -10.7% |
| Orlando, FL | 12,202 | -8.5% | -19.5% |
| Oxnard, CA | 2,153 | -13.4% | -33.8% |
| Philadelphia, PA | 5,982 | -29.3% | -38.6% |
| Phoenix, AZ | 21,861 | -5.8% | -26.2% |
| Pittsburgh, PA | 7,528 | -24.8% | -31.7% |
| Portland, OR | 8,799 | -2.4% | -21.1% |
| Providence, RI | 5,627 | -20.6% | -29.9% |
| Raleigh, NC | 8,178 | -8.5% | -9.0% |
| Richmond, VA | 4,165 | -8.5% | -20.2% |
| Riverside, CA | 15,473 | -11.4% | -33.4% |
| Rochester, NY | 1,839 | -34.1% | -38.7% |
| Sacramento, CA | 6,647 | -14.8% | -23.1% |
| Salt Lake City, UT | 2,873 | -12.9% | -46.5% |
| San Antonio, TX | 10,820 | -10.3% | -16.5% |
| San Diego, CA | 7,394 | -12.0% | -32.0% |
| San Francisco, CA | 1,916 | -19.8% | -28.3% |
| San Jose, CA | 2,342 | -11.7% | -38.0% |
| Seattle, WA | 8,043 | -9.3% | -30.5% |
| St. Louis, MO | 8,721 | -13.8% | -35.2% |
| Tacoma, WA | 2,756 | -5.2% | -20.4% |
| Tampa, FL | 15,844 | -5.0% | -23.5% |
| Tucson, AZ | 4,711 | -6.0% | -22.5% |
| Tulsa, OK | 2,571 | -25.1% | -48.8% |
| Honolulu, HI | 3,749 | -10.1% | -19.5% |
| Virginia Beach, VA | 6,999 | -14.2% | -25.0% |
| Warren, MI | 8,340 | -24.9% | -32.9% |
| Washington, D.C. | 15,797 | -15.3% | -23.1% |
| West Palm Beach, FL | 13,676 | -13.1% | -24.9% |
| Worcester, MA | 2,625 | -27.1% | -25.8% |
| National | 1,662,200 | -14.4% | -24.5% |
Median Off-Market Redfin Estimate
| Redfin Metro | Estimate | Month-Over-Month | Year-Over-Year |
|---|---|---|---|
| Albany, NY | $196,600 | 0.8% | -7.9% |
| Allentown, PA | $211,100 | 0.9% | 0.8% |
| Atlanta, GA | $231,600 | 0.7% | 3.8% |
| Austin, TX | $299,000 | 0.9% | -2.6% |
| Bakersfield, CA | $194,400 | 1.5% | -10.8% |
| Baltimore, MD | $269,800 | 0.8% | 7.0% |
| Baton Rouge, LA | $128,700 | 0.3% | -15.5% |
| Birmingham, AL | $133,900 | 1.4% | -10.3% |
| Boston, MA | $522,400 | 0.6% | 6.0% |
| Bridgeport, CT | $389,400 | 0.1% | -32.8% |
| Buffalo, NY | $149,500 | 1.3% | -4.3% |
| Camden, NJ | $204,600 | 0.7% | 5.4% |
| Charlotte, NC | $208,900 | 1.4% | 0.8% |
| Chicago, IL | $260,500 | 0.7% | 7.7% |
| Cincinnati, OH | $164,500 | 1.0% | -3.1% |
| Cleveland, OH | $140,000 | 0.9% | 0.7% |
| Columbus, OH | $197,600 | 1.1% | 2.9% |
| Dallas, TX | $256,900 | 0.3% | -0.4% |
| Dayton, OH | $124,900 | 1.3% | 5.7% |
| Denver, CO | $419,000 | 0.9% | 1.4% |
| Detroit, MI | $104,200 | 1.1% | -4.0% |
| Fort Lauderdale, FL | $274,300 | 0.7% | 2.7% |
| Fort Worth, TX | $219,500 | 0.6% | 1.7% |
| Fresno, CA | $260,100 | 0.9% | 1.1% |
| Grand Rapids, MI | $171,300 | 1.1% | 5.5% |
| Greenville, SC | $159,100 | 0.9% | -7.6% |
| Hartford, CT | $222,700 | 0.4% | -32.8% |
| Houston, TX | $198,300 | 0.3% | -5.2% |
| Indianapolis, IN | $164,400 | 0.9% | 1.7% |
| Jacksonville, FL | $211,200 | 0.6% | -4.2% |
| Kansas City, MO | $183,400 | 0.7% | -2.0% |
| Knoxville, TN | $176,900 | 0.7% | 10.7% |
| Las Vegas, NV | $284,400 | 0.5% | 2.7% |
| Los Angeles, CA | $645,900 | 0.7% | 2.7% |
| Louisville, KY | $175,300 | 0.5% | 9.6% |
| Memphis, TN | $145,400 | 1.0% | 4.8% |
| Miami, FL | $314,100 | 0.8% | 5.1% |
| Milwaukee, WI | $200,100 | 2.3% | -4.7% |
| Minneapolis, MN | $272,300 | 0.6% | 4.7% |
| Montgomery County, PA | $323,200 | 0.6% | 1.9% |
| Nashville, TN | $277,800 | 0.9% | 9.0% |
| New Haven, CT | $221,600 | 0.6% | -16.9% |
| New Orleans, LA | $169,200 | 0.8% | -0.3% |
| Newark, NJ | $365,100 | 0.2% | -1.4% |
| Oakland, CA | $777,500 | 1.2% | 1.3% |
| Oklahoma City, OK | $144,200 | 0.7% | -1.0% |
| Omaha, NE | $189,200 | 0.6% | 9.6% |
| Orlando, FL | $235,600 | 0.9% | 0.3% |
| Oxnard, CA | $604,500 | 1.0% | 0.7% |
| Philadelphia, PA | $191,100 | 1.0% | 0.2% |
| Phoenix, AZ | $272,500 | 1.0% | 0.3% |
| Pittsburgh, PA | $131,500 | 0.4% | -9.3% |
| Portland, OR | $398,900 | 0.7% | 1.4% |
| Providence, RI | $292,800 | 0.9% | -1.1% |
| Raleigh, NC | $256,500 | 0.8% | -4.3% |
| Richmond, VA | $235,400 | 0.8% | 4.7% |
| Riverside, CA | $329,800 | 0.5% | -10.0% |
| Rochester, NY | $144,100 | 1.1% | -0.9% |
| Sacramento, CA | $413,400 | 0.8% | 2.5% |
| Salt Lake City, UT | $353,100 | 0.7% | 6.9% |
| San Antonio, TX | $183,700 | 0.4% | -5.3% |
| San Diego, CA | $604,600 | 0.9% | 2.1% |
| San Francisco, CA | $1,371,000 | 0.8% | 4.0% |
| San Jose, CA | $1,156,200 | 2.2% | -3.1% |
| Seattle, WA | $561,700 | 1.5% | 0.8% |
| St. Louis, MO | $157,800 | 0.8% | -0.2% |
| Tacoma, WA | $363,600 | 1.5% | 3.6% |
| Tampa, FL | $220,100 | 0.8% | 0.0% |
| Tucson, AZ | $202,500 | 0.7% | -5.0% |
| Tulsa, OK | $131,600 | 0.8% | -5.9% |
| Warren, MI | $209,600 | 0.8% | -1.3% |
| Washington, D.C. | $399,000 | 0.7% | 2.9% |
| West Palm Beach, FL | $275,600 | 0.5% | 3.1% |
| Worcester, MA | $278,700 | 0.8% | -3.0% |
| National | $296,600 | 0.5% | 1.7% |


