
Number of new listings fell 5.9% annually as sales increased 3%
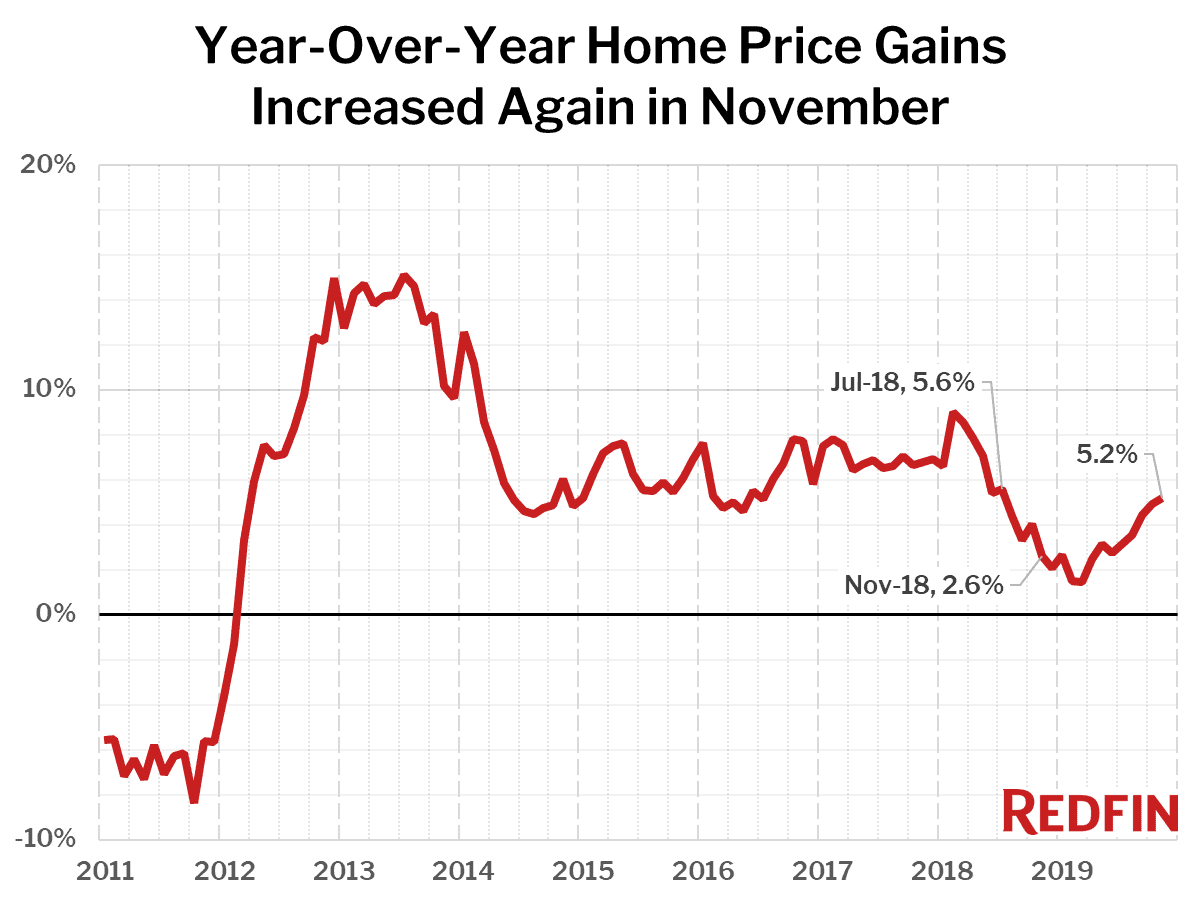
U.S. home-sale prices increased 5.2% year over year in November to a median of $311,600 across the 217 metros Redfin tracks. The increase was the largest since July 2018, when home prices were up 5.6% from a year earlier. Home prices were flat between October and November, which is a bit weak compared to the average 0.7% increase between those months over the past seven years.
“Given that inventory is falling quickly, we’d expect to see even stronger price growth, especially when compared to last year’s soft market,” said Redfin chief economist Daryl Fairweather. “The fact that homes are selling faster indicates that there are buyers ready to pull the trigger and take advantage of low interest rates. If lack of inventory and high demand continues, buyers who take a wait-and-see approach could face less favorable conditions in the spring season like bidding wars and faster price growth.”
Affordable metro areas again saw the biggest home price gains in November. For the fifth month in a row, the nine metro areas with the biggest gains all had median sale prices below the national median, led in November by Camden, NJ (median price $200,000, up 14.3%), Detroit ($140,000, +12.0%) and Bakersfield, CA ($249,999, +11.6%). For the first time in five months, the metro area with the 10th-largest price gains in the nation was one with a median price above the national median: Salt Lake City ($345,000, +9.5%).
For the second month in a row, just one of the 85 largest metro areas Redfin tracks saw a year-over-year decline in the median sale price in November: San Jose, where home prices fell 1.1%. In San Jose, prices were still just barely rising a year ago, up 1.6%.
| Market Summary | November 2019 | Month-Over-Month | Year-Over-Year |
|---|---|---|---|
| Median sale price | $311,600 | 0.0% | 5.2% |
| Homes sold, seasonally-adjusted | 269,300 | -0.3% | 3.0% |
| New listings, seasonally-adjusted | 305,600 | -1.0% | -5.9% |
| All Homes for sale | 743,600 | -9.3% | -12.1% |
| Median days on market | 45 | 1 | -2 |
| Months of supply | 3.1 | 0.1 | -0.4 |
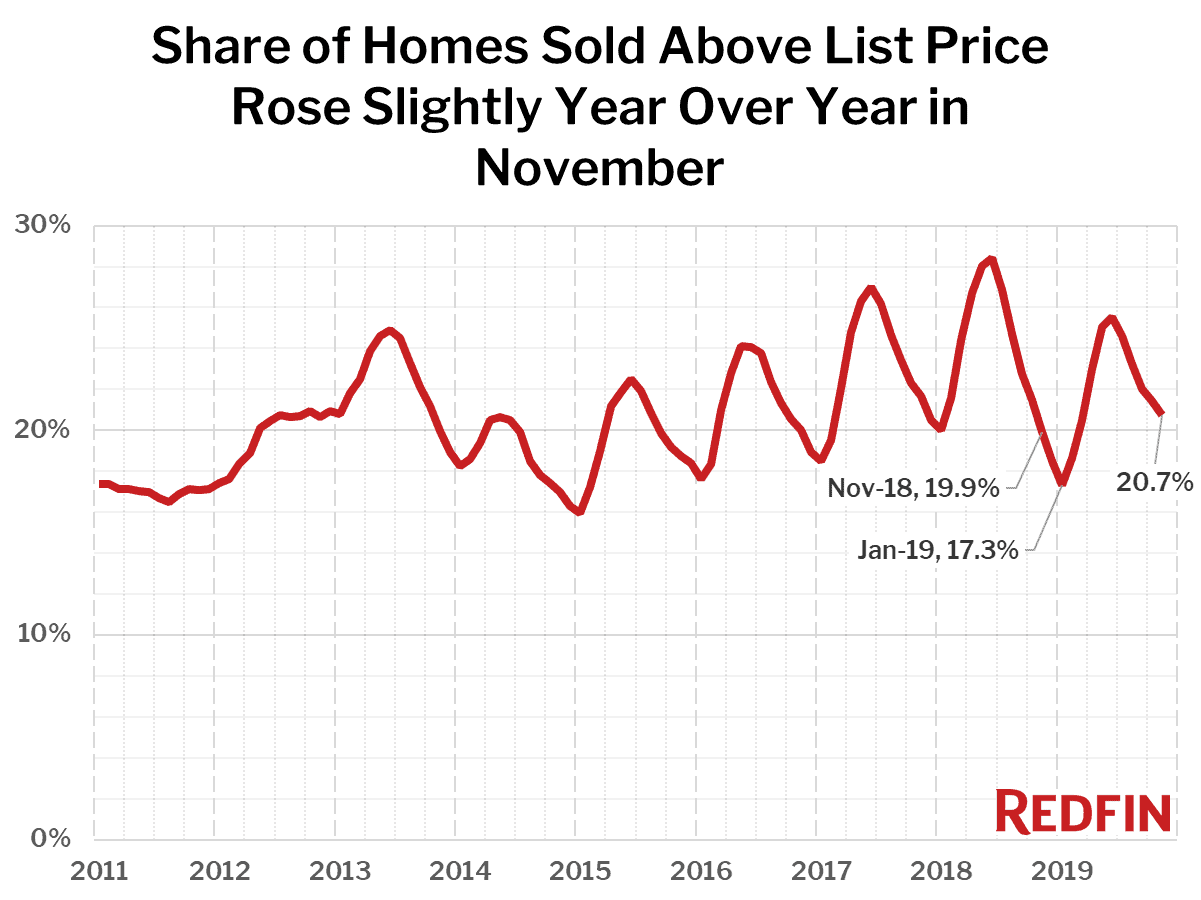
| Sold above list | 20.7% | -0.7% | 0.8% |
| Median Off-Market Redfin Estimate | $293,000 | -4.4% | 2.8% |
| Average Sale-to-list | 97.8% | 0.1% | 0.4% |
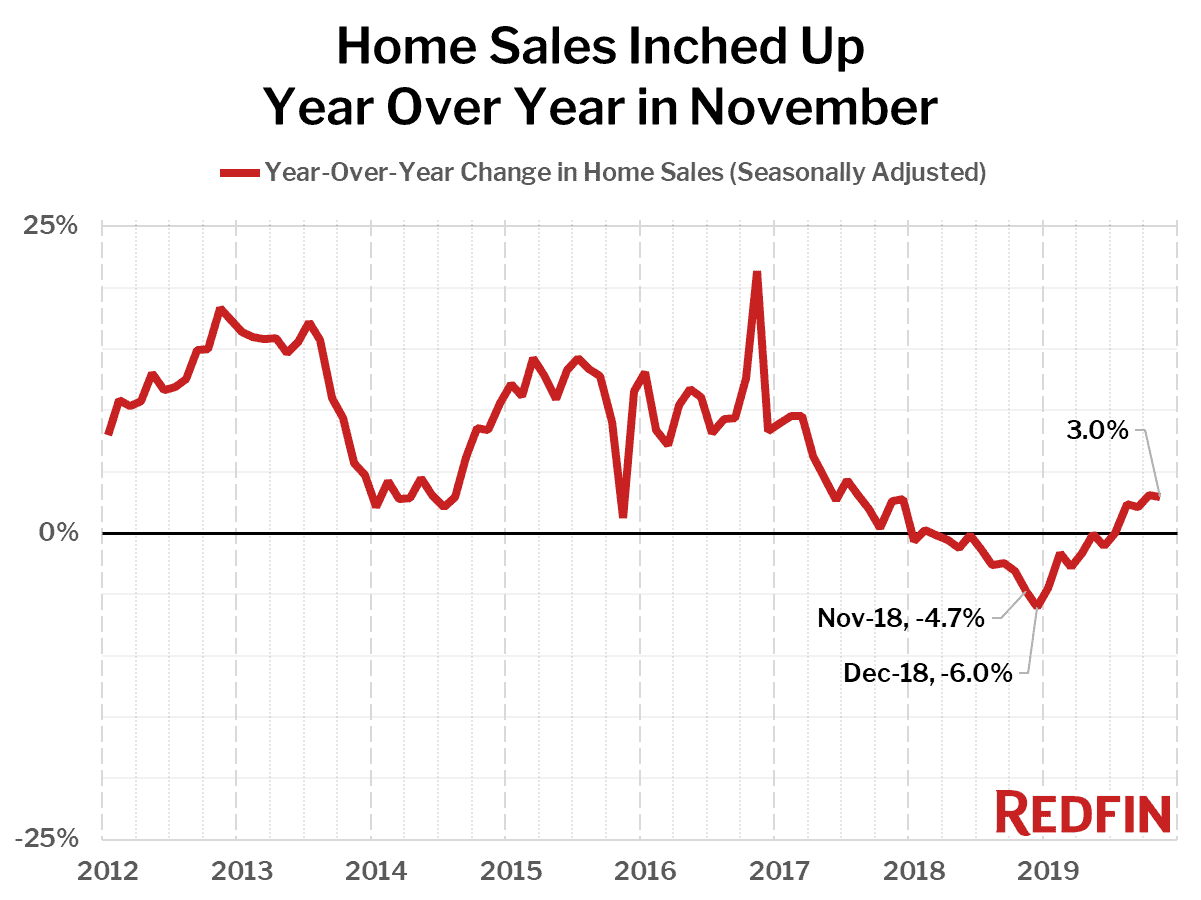
Nationwide, home sales increased 3.0% year over year in November, the fourth consecutive month of increases, and were down 0.3% from October on a seasonally-adjusted basis.
The markets with the biggest increases in home sales from a year ago were McAllen, TX (14.7%), Anaheim (10.2%), and Virginia Beach (9.2%).
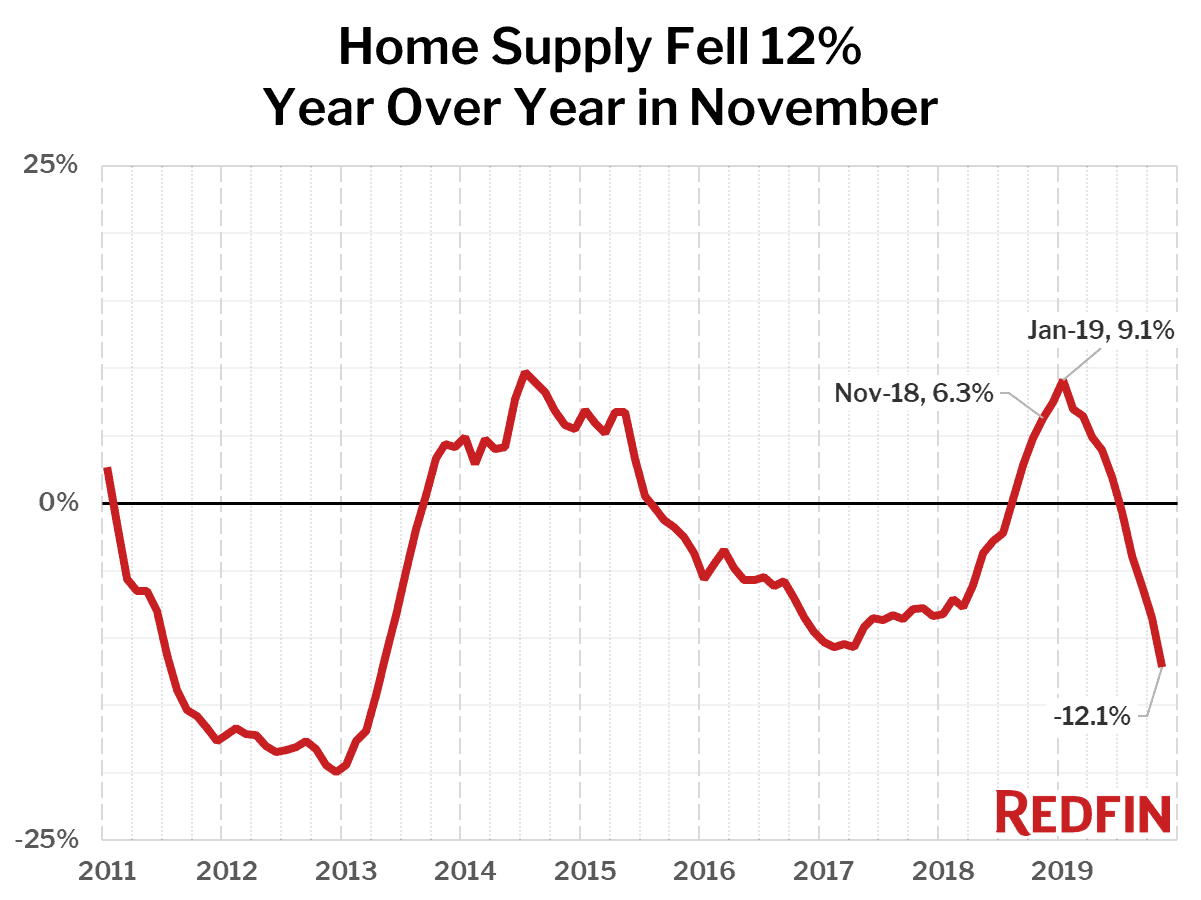
The supply of homes for sale fell 12.1% year over year, the biggest decline since April 2013 and the fifth straight month of declines. There were fewer homes for sale last month than in any November since at least 2012 (as far back as our current dataset goes). Just six of the 85 largest metros tracked by Redfin posted a year-over-year increase in inventory, led by Knoxville (+12.0%), El Paso (+5.2%) and Honolulu (+2.6%).
Compared to a year ago, the biggest declines in the number of homes for sale were in Salt Lake City (-50.2%), Tacoma, WA (-42.6%) and San Diego (-38.5%).
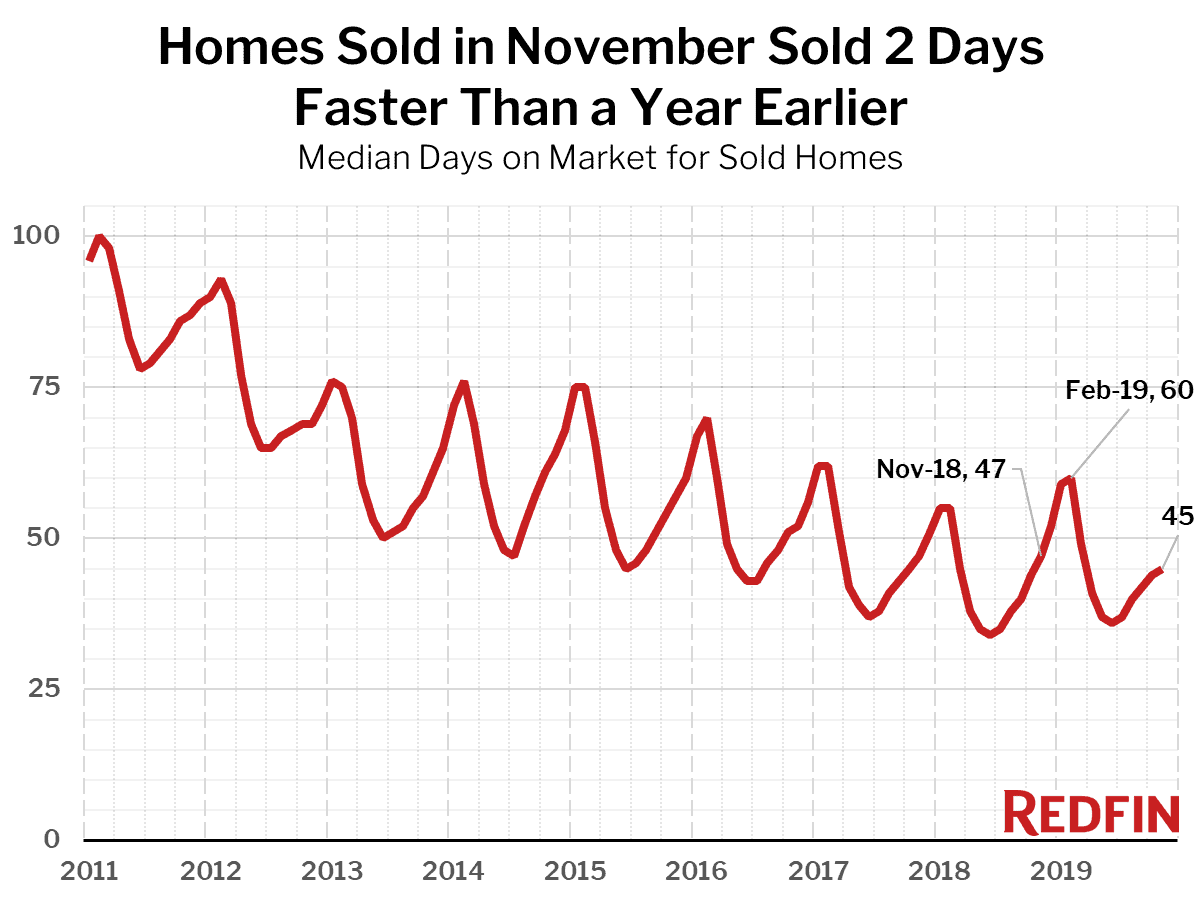
Homes sold in November spent two fewer days on market compared to the prior year. The typical home that sold in November went under contract in 45 days, compared to 47 days in November 2018.
The share of homes sold above list price increased year over year, coming in at 20.7% in November compared to 19.9% a year earlier.
Other November Highlights
Competition
- Grand Rapids, MI was the fastest market, with half of all homes pending sale in just 18 days, down from 20 days a year earlier. Indianapolis and Oakland, CA were the next fastest markets with 20 and 21 median days on market, followed by Tacoma (21) and Omaha (22).
- The most competitive market in November was San Francisco where 62.4% of homes sold above list price, followed by 48.9% in Oakland, 41.0% in Tacoma, 40.8% in San Jose, and 38.9% in Los Angeles.
Prices
- Camden had the nation’s highest price growth, rising 14.3% since last year to $200,000. Detroit had the second highest price growth at 12% year over year, followed by Bakersfield, CA (11.6%), Pittsburgh (11.6%), and Oklahoma City (11.5%).
- Only one metro saw price declines in November: San Jose (-1.1%).
Sales
- McAllen, TX led the nation in year-over-year sales growth, up 14.7%, followed by Anaheim, up 10.2%. Virginia Beach rounded out the top three with sales up 9.2% from a year ago.
- Fort Lauderdale, FL saw the largest decline in sales since last year, falling 12.0%. Home sales in Philadelphia and Boston declined by 11.9% and 10.6%, respectively.
Inventory
- Knoxville had the highest increase in the number of homes for sale, up 12.0% year over year, followed by El Paso (5.2%) and Honolulu (2.6%).
- Salt Lake City had the largest decrease in overall inventory, falling 50.2% since last November. Tacoma (-42.6%), San Diego (-38.5%), and Tulsa (-34.8%) also saw far fewer homes available on the market than a year ago.
Redfin Estimate
- Miami (86.0%) had the largest share of homes predicted to sell for below list price, according to Redfin Estimate data, followed by neighboring markets West Palm Beach (83.8%) and Fort Lauderdale (83.1%).
- San Francisco (86.0%) had the largest share of homes for sale predicted to sell at or above list price, followed by Oakland (82.1%) and Tacoma (79.2%).
Below are market-by-market breakdowns for prices, inventory, new listings and sales for markets with populations of 750 thousand or more. For downloadable data on all of the markets Redfin tracks, visit the Redfin Data Center.
Median Sale Price
| Redfin Metro | Median Sale Price | Month-Over-Month | Year-Over-Year |
|---|---|---|---|
| Albany, NY | $224,500 | 4.4% | 6.1% |
| Allentown, PA | $210,000 | -2.0% | 7.7% |
| Anaheim, CA | $720,000 | 1.4% | 2.9% |
| Atlanta, GA | $246,000 | 0.4% | 5.6% |
| Austin, TX | $308,900 | -5.0% | 3.0% |
| Bakersfield, CA | $250,000 | 2.0% | 11.6% |
| Baltimore, MD | $275,000 | -1.4% | 4.8% |
| Baton Rouge, LA | $199,900 | -4.8% | 0.0% |
| Birmingham, AL | $210,000 | 5.0% | 7.7% |
| Boston, MA | $490,000 | 1.0% | 3.2% |
| Bridgeport, CT | $380,000 | 8.6% | 2.7% |
| Buffalo, NY | $159,000 | -1.9% | 5.0% |
| Camden, NJ | $200,000 | 2.6% | 14.3% |
| Charlotte, NC | $258,000 | 0.4% | 7.0% |
| Chicago, IL | $241,000 | 0.0% | 2.6% |
| Cincinnati, OH | $182,000 | 1.1% | 5.2% |
| Cleveland, OH | $150,000 | -4.5% | 4.9% |
| Columbus, OH | $210,100 | -2.3% | 7.7% |
| Dallas, TX | $295,100 | 0.0% | 2.8% |
| Dayton, OH | $140,000 | 0.1% | 8.2% |
| Denver, CO | $415,500 | -0.2% | 5.2% |
| Detroit, MI | $140,000 | 0.0% | 12.0% |
| El Paso, TX | $170,000 | 3.0% | 9.2% |
| Elgin, IL | $231,000 | 0.7% | 6.9% |
| Fort Lauderdale, FL | $277,000 | 0.7% | 6.5% |
| Fort Worth, TX | $247,100 | -1.2% | 7.6% |
| Frederick, MD | $420,000 | 2.9% | 5.2% |
| Fresno, CA | $288,800 | 4.0% | 9.4% |
| Grand Rapids, MI | $207,500 | -0.1% | 8.9% |
| Greensboro, NC | $179,800 | -0.1% | 2.7% |
| Greenville, SC | $216,000 | -0.5% | 7.6% |
| Hartford, CT | $221,000 | -0.8% | 4.2% |
| Houston, TX | $243,000 | 1.2% | 3.4% |
| Indianapolis, IN | $185,900 | -2.1% | 6.2% |
| Jacksonville, FL | $233,600 | -1.3% | 3.8% |
| Kansas City, MO | $220,000 | 0.5% | 2.4% |
| Knoxville, TN | $217,200 | 2.0% | 7.0% |
| Lake County, IL | $230,900 | 0.8% | 10.2% |
| Las Vegas, NV | $289,000 | -0.3% | 4.0% |
| Los Angeles, CA | $639,000 | -0.5% | 2.2% |
| Louisville, KY | $190,000 | -2.6% | 2.7% |
| McAllen, TX | $160,000 | -3.0% | 6.7% |
| Memphis, TN | $179,000 | 0.6% | 2.3% |
| Miami, FL | $315,000 | 1.6% | 8.6% |
| Milwaukee, WI | $219,000 | -0.5% | 9.5% |
| Minneapolis, MN | $280,000 | 0.0% | 4.5% |
| Montgomery County, PA | $320,000 | 1.6% | 4.2% |
| Nashville, TN | $306,500 | 2.2% | 8.1% |
| Nassau County, NY | $457,000 | -0.7% | 5.1% |
| New Brunswick, NJ | $331,400 | 1.1% | 6.9% |
| New Haven, CT | $212,200 | -1.3% | 7.2% |
| New Orleans, LA | $234,500 | 5.2% | 9.1% |
| New York, NY | $500,000 | 0.0% | 0.0% |
| Newark, NJ | $360,000 | 2.9% | 6.4% |
| North Port, FL | $280,000 | 3.7% | 2.9% |
| Oakland, CA | $720,000 | -3.9% | 0.7% |
| Oklahoma City, OK | $184,000 | 2.2% | 11.5% |
| Omaha, NE | $210,000 | -2.3% | 6.0% |
| Orlando, FL | $255,000 | 0.0% | 3.9% |
| Oxnard, CA | $610,000 | -0.8% | 4.5% |
| Philadelphia, PA | $218,900 | 6.8% | 10.0% |
| Phoenix, AZ | $285,000 | -0.3% | 7.5% |
| Pittsburgh, PA | $178,500 | 5.0% | 11.6% |
| Portland, OR | $410,000 | 1.2% | 6.5% |
| Providence, RI | $296,000 | 2.1% | 9.6% |
| Raleigh, NC | $292,800 | 0.2% | 2.7% |
| Richmond, VA | $255,000 | -0.8% | 4.1% |
| Riverside, CA | $379,000 | -1.6% | 5.3% |
| Rochester, NY | $150,000 | -3.2% | 6.7% |
| Sacramento, CA | $413,000 | 0.7% | 5.9% |
| Salt Lake City, UT | $345,000 | 0.9% | 9.5% |
| San Antonio, TX | $225,200 | -3.3% | 0.1% |
| San Diego, CA | $600,000 | 1.9% | 7.1% |
| San Francisco, CA | $1,375,000 | -3.2% | 2.9% |
| San Jose, CA | $1,081,500 | 1.1% | -1.1% |
| Seattle, WA | $557,000 | -0.5% | 1.3% |
| St. Louis, MO | $182,500 | -2.1% | 4.3% |
| Tacoma, WA | $375,000 | 1.4% | 7.5% |
| Tampa, FL | $238,000 | 1.3% | 4.4% |
| Tucson, AZ | $225,000 | -3.4% | 3.4% |
| Tulsa, OK | $170,000 | -2.6% | 0.0% |
| Honolulu, HI | $575,000 | -3.1% | 0.0% |
| Virginia Beach, VA | $233,000 | -0.8% | 3.6% |
| Warren, MI | $214,200 | -1.4% | 7.1% |
| Washington, DC | $414,700 | 1.1% | 6.3% |
| West Palm Beach, FL | $292,000 | 3.9% | 10.0% |
| Worcester, MA | $275,000 | -1.7% | 5.8% |
| National | $311,600 | 0.0% | 5.2% |
Homes Sold
| Redfin Metro | Homes Sold, seasonally adjusted | Month-Over-Month | Year-Over-Year |
|---|---|---|---|
| Albany, NY | 842 | -0.5% | -0.1% |
| Allentown, PA | 914 | 2.0% | 1.0% |
| Anaheim, CA | 2,578 | 1.7% | 13.8% |
| Atlanta, GA | 8,944 | -0.5% | -1.2% |
| Austin, TX | 3,179 | 1.8% | 9.1% |
| Bakersfield, CA | 742 | -1.8% | 1.3% |
| Baltimore, MD | 3,564 | 1.1% | 2.7% |
| Baton Rouge, LA | 847 | -5.2% | -0.8% |
| Boston, MA | 3,873 | -3.5% | -4.9% |
| Bridgeport, CT | 1,001 | -4.0% | 1.4% |
| Buffalo, NY | 1,037 | 4.8% | 0.4% |
| Camden, NJ | 1,664 | 1.2% | -2.5% |
| Charlotte, NC | 3,794 | -1.8% | 9.1% |
| Chicago, IL | 7,663 | -0.9% | -3.3% |
| Cincinnati, OH | 2,660 | -2.1% | -2.0% |
| Cleveland, OH | 2,464 | -0.8% | 3.0% |
| Columbus, OH | 2,589 | 1.5% | 2.9% |
| Dallas, TX | 5,580 | -0.9% | 4.1% |
| Dayton, OH | 1,006 | -0.1% | -0.2% |
| Denver, CO | 4,602 | -3.0% | 5.1% |
| Detroit, MI | 1,703 | -3.7% | -6.0% |
| El Paso, TX | 705 | -0.4% | 7.4% |
| Elgin, IL | 938 | 1.4% | -2.1% |
| Fort Lauderdale, FL | 2,903 | 0.8% | -7.2% |
| Fort Worth, TX | 2,871 | -1.7% | 1.4% |
| Frederick, MD | 1,469 | -2.2% | 0.4% |
| Fresno, CA | 762 | -3.8% | -3.7% |
| Grand Rapids, MI | 1,379 | 1.8% | 8.9% |
| Greensboro, NC | 842 | -4.1% | 10.1% |
| Greenville, SC | 1,073 | -5.9% | -0.7% |
| Hartford, CT | 1,299 | -2.0% | 0.1% |
| Houston, TX | 7,596 | -0.5% | 5.2% |
| Indianapolis, IN | 3,006 | 1.1% | 2.8% |
| Jacksonville, FL | 2,385 | -0.6% | -3.5% |
| Kansas City, MO | 2,934 | -1.0% | -2.1% |
| Knoxville, TN | 1,207 | 0.2% | -6.5% |
| Lake County, IL | 1,023 | -2.1% | -3.7% |
| Las Vegas, NV | 3,452 | -0.9% | 7.0% |
| Los Angeles, CA | 5,992 | 2.6% | 13.3% |
| Louisville, KY | 1,408 | 4.3% | 11.0% |
| McAllen, TX | 299 | 1.9% | 19.9% |
| Memphis, TN | 1,093 | -0.8% | 0.4% |
| Miami, FL | 2,446 | -3.3% | -4.5% |
| Milwaukee, WI | 1,779 | -0.9% | -0.3% |
| Minneapolis, MN | 5,103 | -0.2% | 2.3% |
| Montgomery County, PA | 2,203 | -2.1% | -7.9% |
| Nashville, TN | 3,448 | -4.2% | 9.4% |
| Nassau County, NY | 2,586 | -1.5% | -3.4% |
| New Brunswick, NJ | 3,189 | 3.1% | 4.3% |
| New Haven, CT | 907 | 5.0% | 7.4% |
| New Orleans, LA | 1,227 | -4.5% | -1.5% |
| New York, NY | 4,416 | 0.0% | -4.8% |
| Newark, NJ | 2,080 | -1.7% | -4.5% |
| North Port, FL | 1,946 | -1.3% | 7.7% |
| Oakland, CA | 2,178 | -0.6% | -2.1% |
| Oklahoma City, OK | 1,932 | 0.1% | 10.4% |
| Omaha, NE | 1,172 | 0.8% | 4.4% |
| Orlando, FL | 4,009 | 2.8% | 4.7% |
| Oxnard, CA | 735 | -1.5% | 13.4% |
| Philadelphia, PA | 2,119 | 1.1% | -9.0% |
| Phoenix, AZ | 8,515 | 1.8% | 12.7% |
| Pittsburgh, PA | 2,155 | 5.2% | 4.4% |
| Portland, OR | 3,080 | -1.4% | 3.6% |
| Providence, RI | 1,793 | 1.3% | 0.4% |
| Raleigh, NC | 2,343 | -1.6% | 5.8% |
| Richmond, VA | 1,634 | 1.2% | 6.5% |
| Riverside, CA | 4,723 | 0.4% | 6.3% |
| Rochester, NY | 1,062 | 1.1% | 0.0% |
| Sacramento, CA | 2,606 | -0.1% | 1.7% |
| Salt Lake City, UT | 1,541 | -1.1% | -3.7% |
| San Antonio, TX | 2,767 | -1.0% | 1.1% |
| San Diego, CA | 3,015 | 1.4% | 8.7% |
| San Francisco, CA | 899 | 2.6% | 1.4% |
| San Jose, CA | 1,205 | 2.5% | 4.3% |
| Seattle, WA | 3,941 | 1.8% | 8.2% |
| St. Louis, MO | 3,418 | 0.8% | -0.2% |
| Tacoma, WA | 1,280 | -2.1% | -5.5% |
| Tampa, FL | 5,409 | 0.4% | 3.6% |
| Tucson, AZ | 1,494 | -0.1% | 6.9% |
| Tulsa, OK | 1,181 | -2.5% | 6.6% |
| Honolulu, HI | 759 | -1.1% | 5.7% |
| Virginia Beach, VA | 2,326 | -0.8% | 13.3% |
| Warren, MI | 3,372 | 0.5% | -0.4% |
| Washington, DC | 5,882 | -3.0% | -5.9% |
| West Palm Beach, FL | 2,707 | 0.6% | -3.7% |
| Worcester, MA | 1,014 | -6.8% | -0.7% |
| National | 269,300 | -0.3% | 3.0% |
New Listings
| Redfin Metro | New Listings, seasonally adjusted | Month-Over-Month | Year-Over-Year |
|---|---|---|---|
| Albany, NY | 936 | -10.2% | -14.8% |
| Allentown, PA | 823 | -4.8% | -22.6% |
| Anaheim, CA | 2,444 | -4.5% | -19.5% |
| Atlanta, GA | 10,319 | -0.3% | -4.1% |
| Austin, TX | 3,538 | -1.0% | 5.3% |
| Bakersfield, CA | 918 | 1.8% | 3.5% |
| Baltimore, MD | 4,279 | -0.5% | -0.2% |
| Baton Rouge, LA | 868 | 2.3% | -21.2% |
| Boston, MA | 4,589 | -8.8% | -13.1% |
| Bridgeport, CT | 1,225 | -10.6% | -6.1% |
| Buffalo, NY | 1,115 | -5.5% | -3.9% |
| Camden, NJ | 1,968 | -0.8% | -8.0% |
| Charlotte, NC | 4,049 | -1.4% | -2.2% |
| Chicago, IL | 10,038 | -2.0% | -4.5% |
| Cincinnati, OH | 2,991 | 1.5% | 0.7% |
| Cleveland, OH | 2,805 | -3.5% | -5.7% |
| Columbus, OH | 2,827 | -2.6% | -0.2% |
| Dallas, TX | 7,085 | -1.3% | -0.2% |
| Dayton, OH | 1,115 | -2.6% | -0.3% |
| Denver, CO | 4,887 | -1.8% | -6.1% |
| Detroit, MI | 2,186 | -4.4% | -11.1% |
| El Paso, TX | 821 | -8.3% | 0.0% |
| Elgin, IL | 1,163 | -1.1% | -2.1% |
| Fort Lauderdale, FL | 3,648 | 3.3% | -9.5% |
| Fort Worth, TX | 3,407 | -3.9% | -3.7% |
| Frederick, MD | 1,783 | 2.6% | 8.5% |
| Fresno, CA | 899 | 7.1% | 3.2% |
| Grand Rapids, MI | 1,436 | -7.1% | -1.6% |
| Greensboro, NC | 703 | 1.8% | -15.6% |
| Greenville, SC | 1,245 | 1.8% | -0.1% |
| Hartford, CT | 1,491 | -6.6% | -0.3% |
| Houston, TX | 9,829 | 0.3% | 3.3% |
| Indianapolis, IN | 3,039 | -4.5% | 1.4% |
| Jacksonville, FL | 2,722 | -8.0% | -8.9% |
| Kansas City, MO | 2,796 | -5.7% | -18.1% |
| Knoxville, TN | 1,315 | -1.8% | -0.1% |
| Lake County, IL | 1,378 | -0.1% | 0.8% |
| Las Vegas, NV | 3,660 | -3.9% | -17.8% |
| Los Angeles, CA | 6,113 | -4.3% | -19.1% |
| Louisville, KY | 1,489 | -2.5% | -4.5% |
| McAllen, TX | 452 | 8.2% | 2.2% |
| Memphis, TN | 1,280 | 0.0% | -3.5% |
| Miami, FL | 3,909 | -0.1% | -7.8% |
| Milwaukee, WI | 1,888 | -0.2% | -0.4% |
| Minneapolis, MN | 5,543 | -0.2% | -0.3% |
| Montgomery County, PA | 2,699 | 2.7% | 0.1% |
| Nashville, TN | 4,078 | -3.5% | 2.7% |
| Nassau County, NY | 3,319 | -0.2% | -5.5% |
| New Brunswick, NJ | 3,684 | -2.3% | -5.1% |
| New Haven, CT | 1,042 | -2.7% | 3.6% |
| New Orleans, LA | 1,438 | -0.6% | 11.0% |
| New York, NY | 7,571 | -1.7% | -6.8% |
| Newark, NJ | 2,719 | 0.0% | 0.0% |
| North Port, FL | 2,254 | 0.3% | -3.4% |
| Oakland, CA | 2,372 | -1.0% | -11.6% |
| Oklahoma City, OK | 2,099 | -2.7% | 0.0% |
| Omaha, NE | 1,181 | -1.6% | -2.3% |
| Orlando, FL | 4,559 | -2.3% | 0.6% |
| Oxnard, CA | 788 | 0.0% | -4.6% |
| Philadelphia, PA | 2,859 | -0.4% | 2.4% |
| Phoenix, AZ | 8,290 | -2.0% | -6.6% |
| Pittsburgh, PA | 2,530 | 3.4% | 4.7% |
| Portland, OR | 3,428 | -1.4% | -5.2% |
| Providence, RI | 2,054 | -3.4% | -6.6% |
| Raleigh, NC | 2,577 | -0.5% | -2.6% |
| Richmond, VA | 1,738 | -7.3% | -4.9% |
| Riverside, CA | 5,012 | -1.9% | -14.7% |
| Rochester, NY | 1,180 | 0.2% | 0.6% |
| Sacramento, CA | 2,961 | 2.0% | -5.8% |
| Salt Lake City, UT | 1,270 | -6.0% | -32.6% |
| San Antonio, TX | 3,417 | -5.4% | -2.3% |
| San Diego, CA | 3,148 | -3.7% | -10.2% |
| San Francisco, CA | 988 | -5.4% | -12.1% |
| San Jose, CA | 1,221 | -3.9% | -16.0% |
| Seattle, WA | 3,845 | -1.4% | -10.4% |
| St. Louis, MO | 3,133 | -3.6% | -20.9% |
| Tacoma, WA | 1,255 | -5.5% | -15.7% |
| Tampa, FL | 5,979 | -0.6% | -5.2% |
| Tulsa, OK | 1,070 | -5.4% | -20.7% |
| Honolulu, HI | 888 | 0.0% | -12.1% |
| Virginia Beach, VA | 2,541 | 0.9% | 5.7% |
| Warren, MI | 3,862 | -4.0% | -8.4% |
| Washington, DC | 6,722 | -0.3% | -1.4% |
| West Palm Beach, FL | 3,462 | -2.2% | -6.1% |
| Worcester, MA | 1,254 | 6.0% | 6.9% |
| National | 305,600 | -1.0% | -5.9% |
All Homes for Sale
| Redfin Metro | All Homes for Sale | Month-Over-Month | Year-Over-Year |
|---|---|---|---|
| Albany, NY | 2,823 | -13.6% | -13.2% |
| Allentown, PA | 1,869 | -6.4% | -30.8% |
| Anaheim, CA | 5,239 | -24.0% | -34.7% |
| Atlanta, GA | 24,228 | -9.1% | -9.1% |
| Austin, TX | 6,365 | -11.9% | -17.9% |
| Bakersfield, CA | 1,724 | -7.2% | -18.2% |
| Baltimore, MD | 9,801 | -10.8% | -6.2% |
| Baton Rouge, LA | 3,460 | 0.3% | -10.7% |
| Birmingham, AL | 3,905 | -5.6% | -11.9% |
| Boston, MA | 8,058 | -24.3% | -7.5% |
| Bridgeport, CT | 5,134 | -13.7% | -2.6% |
| Buffalo, NY | 1,955 | -15.3% | -14.5% |
| Camden, NJ | 5,035 | -9.5% | -23.9% |
| Charlotte, NC | 9,464 | -9.5% | -12.0% |
| Cincinnati, OH | 6,840 | -8.2% | -12.6% |
| Cleveland, OH | 7,348 | -10.5% | -9.7% |
| Columbus, OH | 5,912 | -12.5% | 0.2% |
| Dallas, TX | 16,205 | -13.5% | -7.4% |
| Dayton, OH | 2,319 | -9.4% | -17.0% |
| Denver, CO | 6,581 | -19.0% | -13.3% |
| Detroit, MI | 5,404 | -8.8% | -1.8% |
| El Paso, TX | 2,595 | -6.9% | 5.2% |
| Fort Lauderdale, FL | 13,296 | 0.5% | -6.9% |
| Fort Worth, TX | 6,689 | -12.6% | -5.6% |
| Frederick, MD | 3,259 | -14.6% | -3.9% |
| Fresno, CA | 1,519 | -12.1% | -18.4% |
| Grand Rapids, MI | 2,474 | -13.0% | -1.5% |
| Greensboro, NC | 1,785 | -2.7% | -23.3% |
| Greenville, SC | 3,837 | -5.3% | 1.9% |
| Hartford, CT | 4,910 | -12.6% | -6.4% |
| Houston, TX | 25,908 | -6.9% | -3.3% |
| Indianapolis, IN | 5,400 | -12.3% | -11.2% |
| Jacksonville, FL | 7,026 | -6.8% | -13.4% |
| Knoxville, TN | 3,882 | -0.3% | 12.0% |
| Las Vegas, NV | 9,950 | -8.6% | -3.5% |
| Los Angeles, CA | 14,017 | -16.9% | -26.0% |
| Louisville, KY | 3,082 | -10.7% | -7.1% |
| McAllen, TX | 1,799 | -3.3% | -8.7% |
| Memphis, TN | 2,706 | -7.6% | -10.4% |
| Miami, FL | 18,035 | -1.5% | -5.3% |
| Milwaukee, WI | 4,511 | -13.1% | -3.7% |
| Minneapolis, MN | 9,276 | -16.9% | -6.5% |
| Montgomery County, PA | 5,376 | -12.5% | -12.3% |
| Nashville, TN | 10,514 | -4.7% | -5.0% |
| Nassau County, NY | 10,051 | -9.6% | -6.7% |
| New Brunswick, NJ | 10,886 | -10.3% | -11.7% |
| New Haven, CT | 3,297 | -13.0% | -10.9% |
| New Orleans, LA | 4,274 | -4.9% | -5.7% |
| New York, NY | 33,448 | -3.6% | -9.7% |
| Newark, NJ | 8,020 | -9.6% | -3.4% |
| North Port, FL | 6,410 | 1.6% | -18.0% |
| Oakland, CA | 2,511 | -30.9% | -30.3% |
| Oklahoma City, OK | 4,650 | -7.9% | -15.3% |
| Omaha, NE | 1,838 | -12.1% | -15.0% |
| Orlando, FL | 9,061 | -6.5% | -17.0% |
| Oxnard, CA | 1,795 | -14.2% | -6.9% |
| Philadelphia, PA | 6,600 | -9.0% | -1.6% |
| Phoenix, AZ | 15,312 | -8.8% | -25.8% |
| Pittsburgh, PA | 8,232 | -7.9% | -3.7% |
| Portland, OR | 5,929 | -15.1% | -18.0% |
| Providence, RI | 5,120 | -12.4% | -15.2% |
| Raleigh, NC | 5,967 | -8.1% | -5.3% |
| Richmond, VA | 3,042 | -15.1% | -12.2% |
| Riverside, CA | 12,172 | -13.4% | -29.8% |
| Rochester, NY | 1,678 | -13.0% | -20.2% |
| Sacramento, CA | 4,373 | -18.9% | -25.6% |
| Salt Lake City, UT | 1,998 | -14.2% | -50.2% |
| San Antonio, TX | 8,674 | -7.2% | -1.6% |
| San Diego, CA | 4,911 | -19.6% | -38.5% |
| San Francisco, CA | 1,522 | -27.8% | -10.4% |
| San Jose, CA | 1,537 | -32.7% | -30.0% |
| Seattle, WA | 4,745 | -27.9% | -33.8% |
| St. Louis, MO | 8,093 | -6.0% | -24.5% |
| Tacoma, WA | 1,301 | -28.1% | -42.6% |
| Tampa, FL | 12,097 | -5.6% | -18.8% |
| Tulsa, OK | 2,543 | -2.8% | -34.8% |
| Honolulu, HI | 3,479 | -2.0% | 2.6% |
| Virginia Beach, VA | 5,401 | -12.8% | -21.4% |
| Warren, MI | 8,557 | -12.4% | 2.5% |
| Washington, DC | 11,681 | -14.7% | -15.3% |
| West Palm Beach, FL | 12,781 | 1.1% | -9.4% |
| Worcester, MA | 2,318 | -15.8% | -11.7% |
| National | 743,600 | -9.3% | -12.1% |
Median Off-Market Redfin Estimate
| Redfin Metro | Estimate | Month-Over-Month | Year-Over-Year |
|---|---|---|---|
| Albany, NY | $207,900 | -6.4% | -3.7% |
| Allentown, PA | $216,300 | -3.9% | 3.2% |
| Atlanta, GA | $230,700 | -1.5% | 6.6% |
| Austin, TX | $307,300 | -4.5% | 2.6% |
| Bakersfield, CA | $208,800 | -8.7% | -2.8% |
| Baltimore, MD | $268,700 | 0.4% | 5.7% |
| Baton Rouge, LA | $152,100 | -12.6% | 0.6% |
| Birmingham, AL | $142,300 | -8.2% | -4.6% |
| Boston, MA | $508,600 | 1.5% | 4.2% |
| Buffalo, NY | $156,200 | -6.8% | -0.6% |
| Camden, NJ | $204,300 | -1.0% | 6.0% |
| Charlotte, NC | $207,300 | -3.2% | 1.5% |
| Chicago, IL | $256,100 | 1.1% | 5.5% |
| Cincinnati, OH | $170,000 | -5.9% | 1.2% |
| Cleveland, OH | $144,400 | -3.6% | 4.6% |
| Columbus, OH | $198,500 | -3.0% | 5.8% |
| Dallas, TX | $262,600 | -2.5% | 2.8% |
| Dayton, OH | $124,000 | -2.0% | 6.0% |
| Denver, CO | $411,500 | -2.0% | 0.6% |
| Detroit, MI | $107,600 | -4.9% | 2.0% |
| Fort Lauderdale, FL | $269,300 | -1.5% | 2.9% |
| Fort Worth, TX | $224,700 | -1.5% | 6.0% |
| Fresno, CA | $260,000 | -1.9% | 2.7% |
| Grand Rapids, MI | $169,700 | -2.2% | 6.2% |
| Greenville, SC | $173,900 | -10.9% | 3.6% |
| Houston, TX | $204,900 | -5.2% | -0.9% |
| Indianapolis, IN | $165,500 | -3.7% | 3.7% |
| Jacksonville, FL | $216,900 | -6.6% | 0.6% |
| Kansas City, MO | $184,900 | -4.6% | -0.3% |
| Knoxville, TN | $178,900 | -2.8% | 19.6% |
| Las Vegas, NV | $281,300 | -0.6% | 3.4% |
| Los Angeles, CA | $635,600 | -0.8% | 0.9% |
| Louisville, KY | $175,600 | -1.5% | 16.7% |
| Memphis, TN | $145,500 | -2.1% | 8.3% |
| Miami, FL | $312,100 | 0.2% | 5.8% |
| Milwaukee, WI | $198,500 | -1.1% | -5.2% |
| Minneapolis, MN | $272,300 | -1.4% | 5.1% |
| Montgomery County, PA | $323,000 | -1.1% | 2.1% |
| Nashville, TN | $272,700 | -1.0% | 10.3% |
| New Orleans, LA | $179,500 | -5.7% | 5.7% |
| Newark, NJ | $372,600 | -3.2% | 2.6% |
| Oakland, CA | $767,100 | -0.5% | -0.4% |
| Oklahoma City, OK | $148,700 | -4.6% | 5.7% |
| Omaha, NE | $186,000 | 0.4% | 10.0% |
| Orlando, FL | $236,700 | -3.4% | 3.1% |
| Oxnard, CA | $600,400 | -1.6% | -0.6% |
| Philadelphia, PA | $189,200 | -2.6% | -7.0% |
| Phoenix, AZ | $273,300 | -3.7% | 2.8% |
| Pittsburgh, PA | $143,300 | -10.6% | -0.9% |
| Portland, OR | $399,400 | -1.7% | 2.3% |
| Providence, RI | $294,800 | -3.4% | 0.0% |
| Raleigh, NC | $265,500 | -5.3% | 0.7% |
| Richmond, VA | $234,400 | -1.0% | 5.7% |
| Riverside, CA | $350,000 | -7.2% | -4.0% |
| Rochester, NY | $148,000 | -4.2% | 3.2% |
| Sacramento, CA | $412,400 | -2.1% | 2.7% |
| Salt Lake City, UT | $346,100 | 0.0% | 7.1% |
| San Antonio, TX | $194,800 | -7.2% | 2.1% |
| San Diego, CA | $598,000 | -1.3% | 0.9% |
| San Francisco, CA | $1,344,800 | 0.4% | -0.8% |
| San Jose, CA | $1,130,000 | -1.5% | -8.7% |
| Seattle, WA | $559,000 | -2.9% | -0.8% |
| St. Louis, MO | $161,700 | -4.7% | 4.1% |
| Tacoma, WA | $360,100 | -3.6% | 4.6% |
| Tampa, FL | $222,900 | -3.8% | 3.3% |
| Tucson, AZ | $210,600 | -6.7% | 2.2% |
| Tulsa, OK | $137,200 | -5.2% | -1.4% |
| Warren, MI | $210,700 | -1.4% | -0.5% |
| Washington, DC | $398,300 | -0.9% | 2.9% |
| West Palm Beach, FL | $274,500 | -1.3% | 3.6% |
| Worcester, MA | $284,500 | -4.5% | 0.1% |
| National | $293,000 | -4.4% | 2.8% |


