High-end home prices are showing strength during a recession as the coronavirus pandemic drives demand for extra bedrooms, home offices, big backyards and pools.
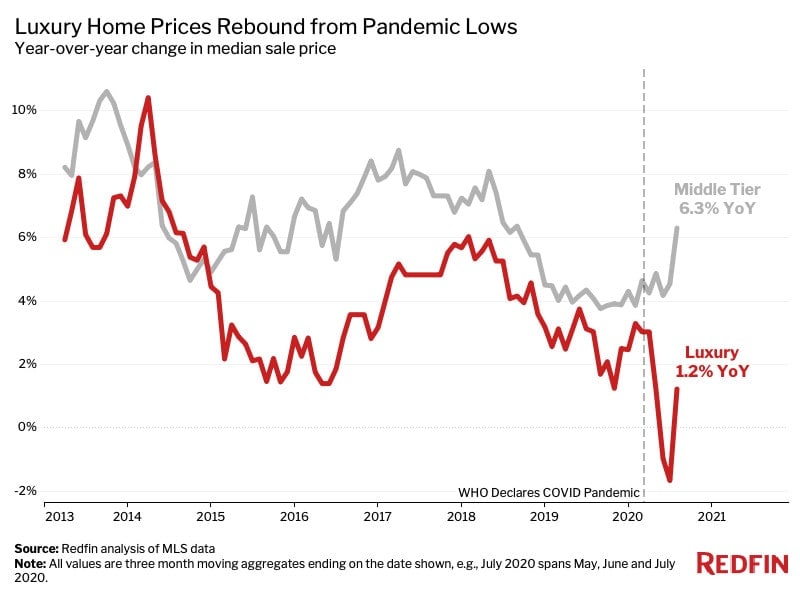
The median sale price for luxury homes in the U.S. rose 1.2% year over year to $825,000 during the three months ending July 31. The rebound comes after a record decline in the spring, when luxury prices dropped 1.7% as the coronavirus pandemic forced the U.S. economy into a standstill.
This is according to an analysis that divided all U.S. residential properties into tiers based on Redfin Estimates of the homes’ market values as of Aug. 10, 2020. This report defines “luxury” homes as those estimated to be in the top 5% based on market value. To represent non-luxury homes, we use the “middle” price tier, i.e. homes estimated to be in the 35th to 65th percentile for value.
Housing Market Summary, Three Months Ending July 31
| Luxury (Top 5% by Market Value) | Non-Luxury (35th-65th Percentile by Market Value) | |
| Median Sale Price | $825,000 | $275,250 |
| Median Sale Price, YoY | 1.2% | 6.3% |
| Number of Homes for Sale, YoY | -0.7% | -14.0% |
| Number of Newly-Listed Homes for Sale, YoY | 4.7% | -16.2% |
| Homes Sold, YoY | -6.2% | -16.4% |
| Median Days on Market | 62 (+3 YoY) | 32 (unchanged YoY) |
“This pandemic-induced recession is unlike any past recession, and its effect on luxury housing is similarly incomparable,” said Redfin chief economist Daryl Fairweather. “Now more than ever, homebuyers are seeking out features long associated with luxury homes, like spacious yards, home offices, gyms and private swimming pools. And that shift in buyer preferences means the luxury housing market isn’t suffering like it has in past recessions, when homebuyers mercilessly cut their budgets.”
While luxury prices have started to make a comeback, growth in this segment still lags growth in the non-luxury market, where the median sale price climbed 6.3% year over year to $257,250 during the three months ending July 31. This is because the non-luxury market faces a much deeper shortage of homes for sale, which has pushed up prices, Fairweather explained.
The luxury market may strengthen further in the third quarter given recent gains in the stock market, where high-end homebuyers tend to hold much of their wealth, Fairweather added.
A handful of metro areas drove the overall rise in luxury sale prices during the three months ending July 31. In Miami, prices of high-end homes increased 10.2% year over year—more than any other metro. Rounding out the top three were New Brunswick, NJ and Phoenix, both up about 9%.
“Homes over $1 million are sitting on the market for a bit longer, but prices are still holding strong and sellers aren’t offering discounts,” said Miami Redfin agent Maria Garcia-Gonzalez.
While median sale prices of luxury homes rose in 35 of the 49 most populous metros, some areas continued to see declines. In Anaheim, luxury prices fell 5.8% year over year—the biggest drop among all of the metros in this analysis. It was followed by Seattle and Cincinnati, down 3.6% and 3.5%, respectively.
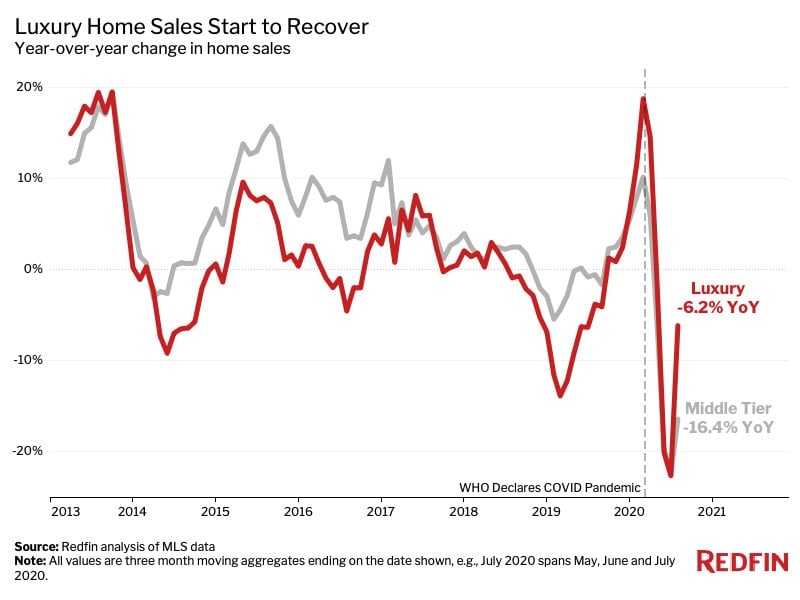
Sales of luxury homes also began to recover during the three months ending July 31, falling just 6.2% after a record 22.6% decline during the three months ending June 30. Non-luxury sales were down 16.4%, also improving from the prior three-month period.
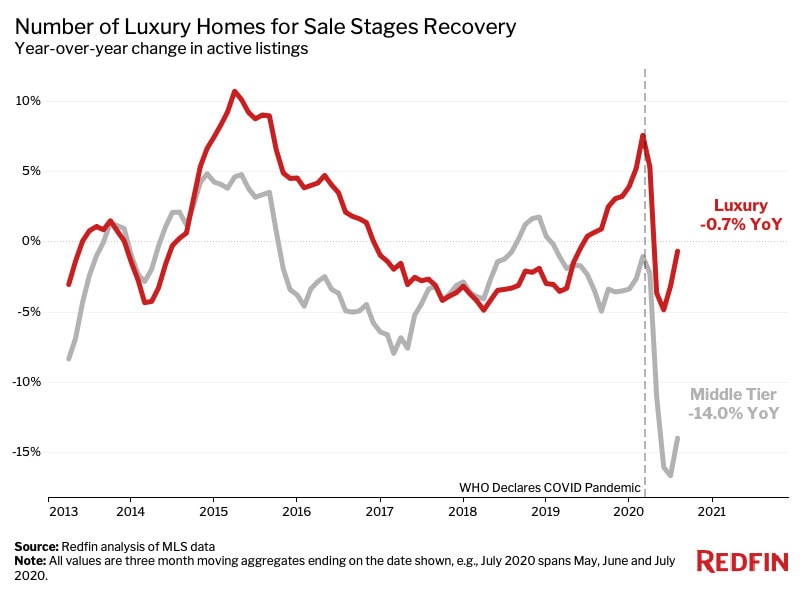
The number of luxury homes for sale fell less than 1% year over year during the three months ending July 31, marking the smallest drop in four months following a decline of nearly 5% during the three months ending May 31. Meanwhile, the supply of non-luxury homes slid 14% following a record 16.7% decline, as many current owners of affordable homes are opting to stay put while the affordable homes that are available are quickly getting snatched off the market.
In San Francisco, the number of luxury homes on the market surged 39.3% during the three months ending July 31 amid an influx of new listings, the largest increase among major metropolitan areas, while Columbus, OH saw the largest decrease (-21.8%).
“Most people who are selling their homes in the Bay Area seem to be leaving town and moving east to places like Sacramento and the surrounding suburbs,” said Oakland Redfin agent Suzanne Masella. “Now that so many people are working remotely, they want to trade their cramped condos for bigger houses with backyards.”
Americans are increasingly ditching their homes in dense, expensive cities as employers implement flexible work-from-home policies and personal space becomes more valuable as a result of the pandemic. New York and San Francisco were the top two metros with the most people looking to leave for another metro in the second quarter, while places including Phoenix and Miami were among the most popular destinations.
“Almost all of the luxury buyers I’m seeing in Miami today are from out of state—Los Angeles, New York City or Chicago. A lot of the snowbirds who used to commute between here and New York can no longer travel due to the pandemic, so they’ve just decided to stick around,” Garcia-Gonzalez said. “Why spend $4 million on a tiny apartment in New York when you could get a beautiful mansion on the water here for the same price?”
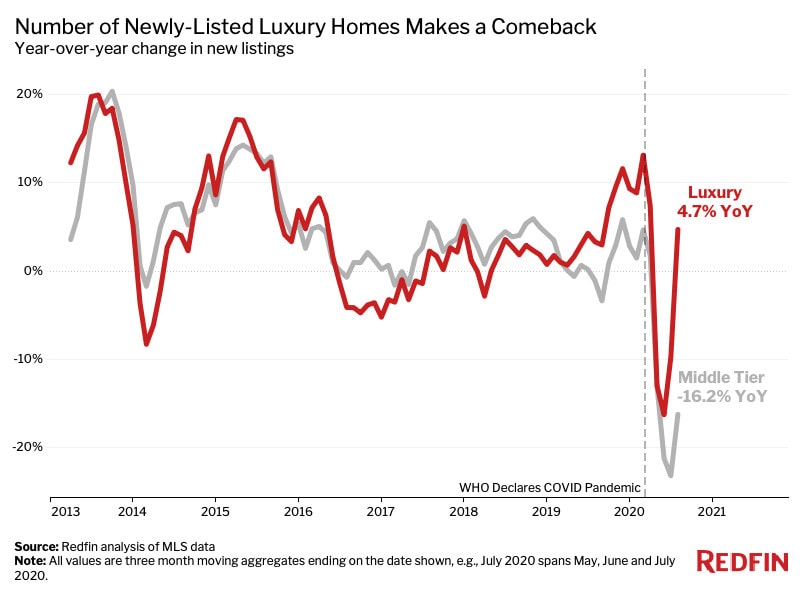
New listings of luxury homes also made a comeback during the three months ending July 31, climbing 4.7% year over year after plunging a record 16.3% during the three months ending May 31. New listings of non-luxury homes remained down 16.2%, though that marked an improvement from a record 23.2% decline during the prior three-month period.
San Francisco saw the greatest increase in new luxury listings, up 71.7% year over year during the three months ending July 31, followed by West Palm Beach, FL (+53.7%) and Warren, MI (+39.1%).
Summary of Luxury Market (Top 5%) by Metro Area (50 Most Populous*), Three Months Ending July 31
| Metro Area | Median
Sale Price, YoY Change |
Median Sale Price | Supply of Homes for Sale, YoY Change | New Listings, YoY Change | Homes Sold, YoY Change |
| Miami, FL | 10.2% | $ 1,950,000 | 3.8% | 12.9% | -28.2% |
| New Brunswick, NJ | 9.1% | $ 1,200,000 | -2.9% | 19.0% | 3.8% |
| Phoenix, AZ | 9.0% | $ 1,003,000 | -14.0% | 9.2% | -13.3% |
| Providence, RI | 8.8% | $ 925,000 | -11.9% | -9.5% | -17.1% |
| West Palm Beach, FL | 8.6% | $ 1,791,727 | 7.4% | 53.7% | -6.0% |
| Tampa, FL | 7.3% | $ 850,000 | -3.7% | 6.0% | -2.9% |
| San Diego, CA | 7.1% | $ 2,250,000 | 7.8% | 19.7% | -3.7% |
| Newark, NJ | 6.3% | $ 1,180,000 | 1.1% | 36.8% | -23.5% |
| Jacksonville, FL | 5.7% | $ 819,000 | -5.2% | -2.9% | -0.7% |
| Philadelphia, PA | 5.3% | $ 842,600 | -3.7% | 10.9% | -44.2% |
| Montgomery County, PA | 5.0% | $ 940,000 | -5.1% | 7.4% | -27.3% |
| Nassau County, NY | 5.0% | $ 1,989,500 | -7.3% | 11.9% | -27.5% |
| Charlotte, NC | 4.9% | $ 839,000 | -15.3% | -1.2% | -16.5% |
| Washington, DC | 4.8% | $ 1,350,000 | 0.5% | -2.6% | -16.3% |
| Indianapolis, IN | 4.4% | $ 607,545 | 8.7% | 16.3% | 13.5% |
| Denver, CO | 4.0% | $ 1,226,000 | 13.2% | 13.0% | -9.4% |
| St. Louis, MO | 3.5% | $ 665,000 | -15.3% | -20.4% | -18.8% |
| Fort Lauderdale, FL | 3.2% | $ 954,715 | -6.0% | -0.4% | -16.5% |
| Atlanta, GA | 3.1% | $ 825,000 | 30.0% | 26.7% | 12.8% |
| Virginia Beach, VA | 3.1% | $ 675,000 | -10.1% | -7.6% | 1.0% |
| San Antonio, TX | 2.9% | $ 637,845 | 16.0% | 6.8% | 28.3% |
| Riverside, CA | 2.7% | $ 920,000 | -12.6% | -0.1% | -5.4% |
| Nashville, TN | 2.6% | $ 975,000 | -1.6% | -0.6% | -15.4% |
| Columbus, OH | 2.4% | $ 650,000 | -21.8% | -17.5% | -8.4% |
| Kansas City, MO | 2.4% | $ 630,000 | -18.9% | -10.2% | 6.1% |
| Los Angeles, CA | 2.4% | $ 2,969,000 | -6.1% | 6.3% | -24.8% |
| Austin, TX | 1.9% | $ 1,207,500 | 8.0% | 10.6% | -9.3% |
| Detroit, MI | 1.8% | $ 504,000 | 26.5% | 24.2% | 19.3% |
| Minneapolis, MN | 1.3% | $ 780,000 | -3.6% | -8.6% | -14.2% |
| Pittsburgh, PA | 1.3% | $ 585,000 | 5.2% | 14.0% | -25.7% |
| San Francisco, CA | 1.1% | $ 4,650,000 | 39.3% | 71.7% | -13.0% |
| Baltimore, MD | 0.8% | $ 806,000 | -6.7% | -7.5% | -7.4% |
| Orlando, FL | 0.7% | $ 725,000 | 1.0% | 5.5% | -17.5% |
| Milwaukee, WI | 0.1% | $ 649,900 | -6.6% | -11.7% | -9.9% |
| Cleveland, OH | 0.0% | $ 530,000 | -11.8% | -12.4% | -10.0% |
| Fort Worth, TX | -0.1% | $ 730,000 | -1.4% | 1.3% | 3.5% |
| Oakland, CA | -0.2% | $ 2,096,500 | 11.5% | 28.3% | -3.4% |
| Chicago, IL | -0.6% | $ 969,000 | -7.4% | 9.8% | -29.8% |
| Warren, MI | -0.9% | $ 655,000 | 34.3% | 39.1% | 28.8% |
| Sacramento, CA | -1.1% | $ 1,125,000 | 2.7% | 6.9% | 17.1% |
| San Jose, CA | -1.1% | $ 3,757,500 | 7.9% | 24.3% | -6.1% |
| Boston, MA | -1.2% | $ 1,825,000 | -1.8% | 10.9% | -33.6% |
| Las Vegas, NV | -1.3% | $ 780,000 | 7.9% | 6.9% | -7.2% |
| Dallas, TX | -1.8% | $ 889,000 | -0.3% | 17.2% | 5.3% |
| Portland, OR | -2.2% | $ 970,000 | 1.7% | 7.8% | -3.5% |
| Houston, TX | -2.4% | $ 800,000 | 4.1% | 6.0% | -5.9% |
| Cincinnati, OH | -3.5% | $ 600,000 | 0.4% | 7.6% | -8.5% |
| Seattle, WA | -3.6% | $ 1,850,000 | -8.4% | 4.1% | -21.6% |
| Anaheim, CA | -5.8% | $ 2,539,500 | -14.1% | 3.5% | -11.0% |
| National | 1.2% | $ 825,000 | -0.7% | 4.7% | -6.2% |
*Excludes New York City
Methodology
We divided all U.S. residential properties into five buckets. There are three equal-sized tiers based on Redfin Estimates of the homes’ market values as of Aug. 10, 2020, with separate buckets for the bottom 5% and top 5% of the market. The top 5% of the market by price is considered luxury for the purposes of this report. The “bottom” tier represents more affordable homes, or homes estimated to be in the 5th-35th percentile. The “middle” tier represents homes estimated to be in the 35th-65th percentile. The “top” tier represents more expensive homes, or homes estimated to be in the 65th-95th percentile. By using Redfin Estimates of homes’ market value, we are able to use the same group of homes to report on price, sales and inventory. The “record” declines referenced in this report date back to at least 2013, when Redfin began tracking these statistics. In past luxury reports, Redfin has analyzed the top 5% of homes by sale price to report on luxury price trends, while analyzing homes above a certain price threshold (typically $1.5 million or $2 million) for sales and inventory data.