May Home Prices Up 3.6%, the Largest Year-Over-Year Increase in 7 Months

May Home Prices Up 3.6%, the Largest Year-Over-Year Increase in 7 Months

by
Updated on October 6th, 2020

Recent upticks in mortgage applications and home tours suggest that home price growth will strengthen this summer.

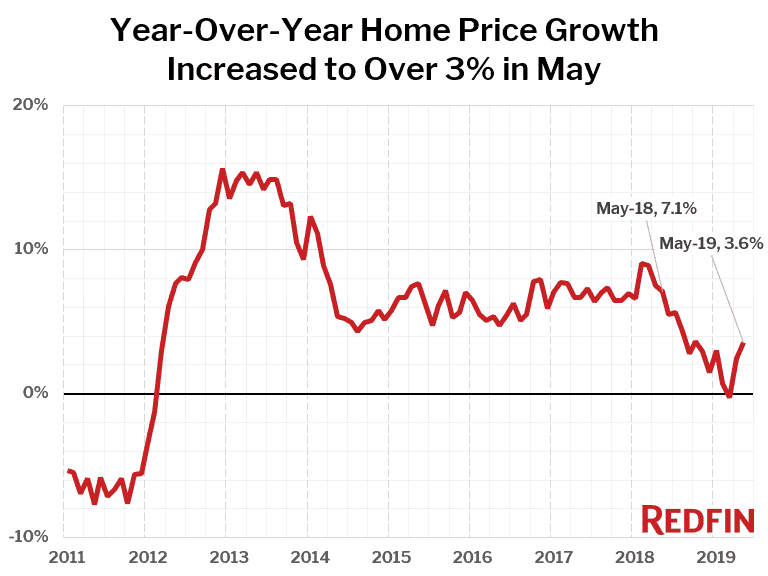
U.S. home-sale prices edged up again in May, growing 3.6 percent from a year ago to a median of $315,700 across the metros Redfin tracks. While this was the biggest annual home price increase in seven months, it fell far short of the 7.1 percent growth rate of a year earlier.
Only six of the 85 largest metro areas Redfin tracks saw a year-over-year decline in their median sale price, the biggest of which were a 6.0 percent drop in San Jose, a 2.5 percent dip in New York, and a 2.2 percent decline in Honolulu. All three of the other metros that saw price drops were in California: Orange County (-1.4%), Los Angeles (-0.8%) and Oakland (-0.7%).
”As mortgage rates have fallen this month, Redfin has seen upticks in the number of people wanting to talk with our agents about buying homes and the number going on home tours,” said Redfin chief economist Daryl Fairweather. “Recent surges in mortgage applications also reflect the impact low rates are having on homebuyer demand nationwide. We haven’t yet seen a commensurate increase in U.S. home sales, and I don’t expect sales to increase substantially in the long run. That’s because there still aren’t enough homes for sale for all of the people who want to buy homes. In May, inventory posted its smallest increase in eight months, and fewer new listings came on the market than last year. Low rates and rising prices will likely lure sellers onto the market this summer, but the lack of new construction will continue to hold back sales growth.”

Year-Over-Year Home Price Growth Increased to Over 3% in May
Market Summary May 2019 Month-Over-Month Year-Over-Year
Median sale price $315,700 3.0% 3.6%
Homes sold 314,300 14.1% 0.2%
New listings 418,900 5.1% -0.7%
All Homes for sale 890,300 5.1% 2.5%
Median days on market 36 -4 -1
Months of supply 2.8 -0.3 0
Sold above list 24.4% 2.1% -3.6%
Median Off-Market Redfin Estimate $304,600 1.6% 4.9%
Average Sale-to-list 98.4% 0.1% 0.0%

Home sales were essentially flat in May, up 0.2 percent year over year. Forty-eight of the 85 metros tracked by Redfin saw an increase in sales from a year earlier.
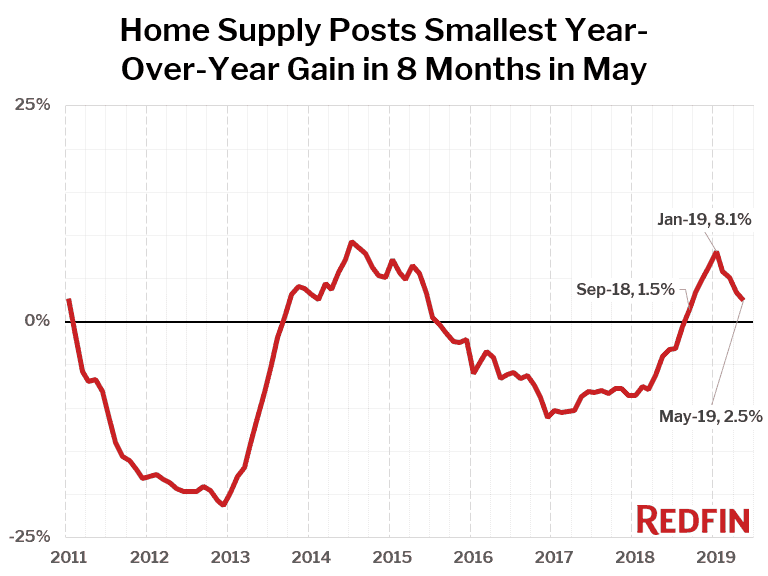
The number of homes for sale as of the end of May was up 2.5 percent from the same time last year. This was the smallest year-over-year increase in home supply in eight months. The number of homes newly listed for sale last month fell 0.7 percent from a year earlier.

Home Supply Posts Smallest Year-Over-Year Gain in 8 Months in May

Nationwide, measures of competition are mixed, with some pointing toward a hotter market than a year ago and others indicating that the market has cooled.
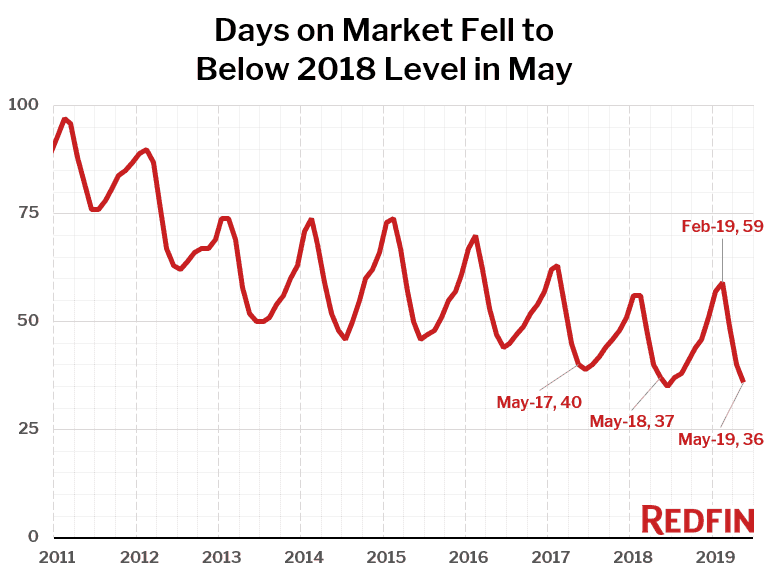
On the “market is hotter” side, we have the median number of days on market, which dropped for homes sold in May, which fell to 36 days from 37 days a year earlier. This is the lowest days on market measured in any month of May since at least 2010 (as far back as we have recorded this measure nationally).
On the “market is cooler” side, there’s the share of homes for sale that has a price drop, which rose to 25.9 percent, up from 23.4 percent last year, and the highest rate of homes with price drops since last September’s record high. Also, the share of homes sold above list price is falling, to 24.4 percent in May from 28.0 percent last year. Still, last month’s rate of homes selling above list price was the highest since last August.

Days on Market Fell to Below 2018 Level in May

Other May Highlights

Competition

  • Grand Rapids, MI was the fastest market, with half of all homes pending sale in just 8 days, down from 9 days a year earlier. Omaha, NE and Tacoma, WA were the next fastest markets with 8 and 8 median days on market, followed by Washington, DC (9) and Seattle (9).
  • The most competitive market in May was San Francisco where 69.6% of homes sold above list price, followed by 58.9% in Oakland, CA, 54.3% in San Jose, CA, 49.4% in Tacoma, WA, and 45.1% in Minneapolis.

Prices

  • Knoxville, TN had the nation’s highest price growth, rising 15.2% since last year to $218,875. Milwaukee had the second highest growth at 14.7% year-over-year price growth, followed by Camden, NJ (11.4%), Dayton, OH (11.1%), and Detroit (10.8%).
  • 6 metros saw price declines in May. San Jose, CA declined the most since last year falling 6 percent to $1,175,000.

Sales

  • Dayton, OH led the nation in year-over-year sales growth, up 9.2%, followed by Minneapolis, up 8.9%. Long Island, NY rounded out the top three with sales up 8.8% from a year ago.
  • Bakersfield, CA saw the largest decline in sales since last year, falling 13.9%. Home sales in Fresno, CA and Tacoma, WA declined by 12.6% and 10.2%, respectively.

Inventory

  • San Jose, CA had the highest increase in the number of homes for sale, up 60.2% year over year, followed by Seattle (45.8%) and Oxnard, CA (37.6%).
  • Rochester, NY had the largest decrease in overall inventory, falling 25.5% since last May. Camden, NJ (-19.7%) and Montgomery County, PA (-19.1%) also saw far fewer homes available on the market than a year ago.

Redfin Estimate

  • The median list price-to-Redfin Estimate ratio was 95.6% in San Francisco, the lowest of any market. Only 11.0% of homes in San Francisco were listed for more than their Redfin Estimate.
  • Conversely, the median list price-to-Redfin Estimate ratio was 102.2% in Miami and 102.0% in West Palm Beach, FL, which means sellers are listing their homes for more than the estimated value in those metro areas. In Miami, 80.9% of homes were listed above their Redfin Estimate, the highest percentage of any metro.

Below are market-by-market breakdowns for prices, inventory, new listings and sales for markets with populations of 750 thousand or more. For downloadable data on all of the markets Redfin tracks, visit the Redfin Data Center.

Median Sale Price

Redfin Metro Median Sale Price Month-Over-Month Year-Over-Year
Albany, NY $219,500 -0.2% 4.5%
Allentown, PA $207,500 10.7% 6.7%
Atlanta, GA $256,000 4.1% 4.6%
Austin, TX $329,400 3.3% 3.6%
Bakersfield, CA $235,500 -0.2% 0.2%
Baltimore, MD $294,200 7.0% 9.0%
Baton Rouge, LA $215,000 4.9% 7.6%
Birmingham, AL $230,000 7.0% 9.5%
Boston, MA $517,000 6.6% 4.4%
Bridgeport, CT $412,500 8.3% 5.8%
Buffalo, NY $155,000 6.9% 6.9%
Camden, NJ $195,000 2.6% 11.4%
Charlotte, NC $265,000 2.8% 6.0%
Chicago, IL $259,900 2.7% 3.1%
Cincinnati, OH $194,900 4.1% 7.7%
Cleveland, OH $160,800 8.0% 7.2%
Columbus, OH $229,800 4.5% 9.4%
Dallas, TX $309,000 3.2% 3.3%
Dayton, OH $150,000 7.9% 11.1%
Denver, CO $425,000 2.4% 1.4%
Detroit, MI $144,000 15.2% 10.8%
El Paso, TX $166,600 4.2% 6.9%
Fort Lauderdale, FL $275,000 3.8% 4.2%
Fort Worth, TX $253,900 3.0% 3.7%
Fresno, CA $280,000 3.7% 3.9%
Grand Rapids, MI $220,000 4.6% 7.3%
Greenville, SC $221,300 3.0% 5.4%
Hampton Roads, VA $245,000 3.5% 4.4%
Hartford, CT $228,000 4.6% 6.0%
Honolulu, HI $584,000 2.5% -2.2%
Houston, TX $250,000 2.0% 2.9%
Indianapolis, IN $193,000 3.8% 3.3%
Jacksonville, FL $232,000 1.3% 2.2%
Kansas City, MO $230,000 2.2% 7.0%
Knoxville, TN $218,900 8.1% 15.2%
Las Vegas, NV $285,000 2.5% 4.6%
Long Island, NY $447,000 2.8% 5.7%
Los Angeles, CA $625,000 0.0% -0.8%
Louisville, KY $202,900 9.4% 6.5%
McAllen, TX $165,000 9.3% 8.7%
Memphis, TN $197,000 9.4% 3.3%
Miami, FL $310,000 1.6% 3.3%
Milwaukee, WI $234,000 4.0% 14.7%
Minneapolis, MN $285,000 1.8% 5.6%
Montgomery County, PA $327,000 7.2% 7.2%
Nashville, TN $300,000 3.4% 3.6%
New Haven, CT $221,800 7.6% 5.5%
New Orleans, LA $235,000 4.4% 9.3%
New York, NY $385,000 0.0% -2.5%
Newark, NJ $370,000 7.2% 7.2%
Oakland, CA $760,000 1.5% -0.7%
Oklahoma City, OK $184,900 2.7% 7.5%
Omaha, NE $221,500 8.0% 8.8%
Orange County, CA $715,000 -0.8% -1.4%
Orlando, FL $257,000 3.6% 4.0%
Oxnard, CA $615,000 2.5% 2.3%
Philadelphia, PA $225,000 4.2% 9.8%
Phoenix, AZ $280,000 2.0% 4.5%
Pittsburgh, PA $177,500 7.6% 5.7%
Portland, OR $410,800 4.0% 2.7%
Providence, RI $294,500 9.9% 10.7%
Raleigh, NC $295,900 0.3% 3.8%
Richmond, VA $260,000 2.0% 6.1%
Riverside, CA $375,000 0.0% 3.5%
Rochester, NY $155,000 10.7% 3.7%
Sacramento, CA $415,000 1.5% 2.3%
Salt Lake City, UT $347,600 3.8% 8.7%
San Antonio, TX $237,000 5.3% 3.4%
San Diego, CA $585,000 0.4% 1.7%
San Francisco, CA $1,500,000 5.3% 3.4%
San Jose, CA $1,175,000 2.2% -6.0%
Seattle, WA $592,500 3.7% 1.1%
St. Louis, MO $195,000 8.4% 6.0%
Tacoma, WA $370,000 3.6% 4.2%
Tampa, FL $235,000 4.0% 4.4%
Tucson, AZ $230,000 6.0% 9.5%
Tulsa, OK $181,700 6.9% 6.9%
Warren, MI $226,500 7.9% 7.9%
Washington, DC $422,000 0.6% 2.9%
West Palm Beach, FL $290,000 2.8% 5.8%
Worcester, MA $275,000 3.8% 6.0%
National $315,700 3.0% 3.6%

Homes Sold

Redfin Metro Homes Sold Month-Over-Month Year-Over-Year
Albany, NY 880 25.2% 2.4%
Allentown, PA 1,020 11.8% 6.9%
Atlanta, GA 10,478 13.1% -7.5%
Austin, TX 3,610 12.8% 0.7%
Bakersfield, CA 796 -0.9% -13.9%
Baltimore, MD 4,034 7.1% 1.0%
Baton Rouge, LA 1,057 17.1% 1.2%
Birmingham, AL 1,635 4.7% -1.1%
Boston, MA 4,843 31.2% 6.6%
Bridgeport, CT 1,131 36.9% 7.5%
Buffalo, NY 940 20.7% -3.4%
Camden, NJ 1,832 8.7% 3.0%
Charlotte, NC 4,309 12.6% 2.4%
Chicago, IL 11,947 20.7% 0.5%
Cincinnati, OH 2,528 11.7% 1.9%
Cleveland, OH 2,935 19.0% 0.5%
Columbus, OH 3,022 5.0% 7.6%
Dallas, TX 6,845 16.4% 2.3%
Dayton, OH 1,252 17.3% 9.2%
Denver, CO 5,573 9.9% 5.6%
Detroit, MI 1,959 10.5% 2.5%
El Paso, TX 842 11.4% 6.6%
Fort Lauderdale, FL 3,247 -5.3% -5.6%
Fort Worth, TX 3,494 11.6% -1.2%
Fresno, CA 818 7.2% -12.6%
Grand Rapids, MI 1,539 25.2% 1.1%
Greenville, SC 1,289 2.2% -0.5%
Hampton Roads, VA 2,571 20.1% 7.7%
Hartford, CT 1,481 25.9% 5.1%
Honolulu, HI 825 6.0% 1.6%
Houston, TX 8,996 13.5% 3.8%
Indianapolis, IN 3,430 18.1% -0.9%
Jacksonville, FL 2,841 5.2% 2.0%
Kansas City, MO 3,593 25.9% -6.0%
Knoxville, TN 1,433 14.5% 0.9%
Las Vegas, NV 3,935 12.0% 0.8%
Long Island, NY 2,351 11.2% 8.8%
Los Angeles, CA 6,504 9.6% -3.0%
Louisville, KY 1,438 16.4% -2.4%
McAllen, TX 305 -3.5% 8.2%
Memphis, TN 1,285 11.6% 2.0%
Miami, FL 2,805 3.5% 6.5%
Milwaukee, WI 2,080 18.3% -3.5%
Minneapolis, MN 5,954 27.0% 8.9%
Montgomery County, PA 2,523 21.7% -0.3%
Nashville, TN 3,799 15.0% 3.1%
New Haven, CT 990 19.7% 1.6%
New Orleans, LA 1,475 10.5% -2.3%
New York, NY 7,499 14.2% -3.2%
Newark, NJ 2,725 19.9% 2.3%
Oakland, CA 2,926 23.4% 3.9%
Oklahoma City, OK 2,318 21.9% 5.1%
Omaha, NE 1,337 28.9% -7.7%
Orange County, CA 2,893 13.5% -0.4%
Orlando, FL 4,587 9.1% 1.1%
Oxnard, CA 821 10.2% -2.3%
Philadelphia, PA 2,341 11.6% -10.0%
Phoenix, AZ 10,153 8.7% 4.3%
Pittsburgh, PA 2,547 17.5% 3.3%
Portland, OR 3,766 19.2% 2.6%
Providence, RI 2,033 33.4% 6.7%
Raleigh, NC 2,735 15.8% 7.5%
Richmond, VA 1,929 29.1% 5.1%
Riverside, CA 5,411 10.7% -2.4%
Rochester, NY 989 10.5% -10.2%
Sacramento, CA 2,920 12.9% -8.9%
Salt Lake City, UT 1,915 14.3% 0.8%
San Antonio, TX 3,243 18.0% 1.6%
San Diego, CA 3,417 7.9% -2.6%
San Francisco, CA 1,145 6.0% -5.1%
San Jose, CA 1,533 16.2% -6.0%
Seattle, WA 4,745 16.2% -1.1%
St. Louis, MO 4,213 22.6% -3.3%
Tacoma, WA 1,491 10.4% -10.2%
Tampa, FL 6,404 7.7% 4.9%
Tucson, AZ 1,842 11.2% 3.0%
Tulsa, OK 1,394 4.7% -3.1%
Warren, MI 3,909 19.6% -3.2%
Washington, DC 9,489 13.7% -0.6%
West Palm Beach, FL 3,324 5.0% -3.5%
Worcester, MA 1,047 22.7% 0.8%
National 314,300 14.1% 0.2%

New Listings

Redfin Metro New Listings Month-Over-Month Year-Over-Year
Albany, NY 1,437 8.9% -10.4%
Albuquerque, NM 1,577 -4.1% -10.7%
Allentown, PA 1,327 1.3% -6.7%
Atlanta, GA 13,129 3.6% -2.1%
Austin, TX 4,616 10.3% -0.4%
Bakersfield, CA 1,110 1.7% -0.9%
Baltimore, MD 5,886 1.6% -1.0%
Baton Rouge, LA 1,285 1.7% -8.5%
Birmingham, AL 1,948 0.1% -1.4%
Boston, MA 8,196 17.8% -0.8%
Bridgeport, CT 2,157 9.3% 7.4%
Buffalo, NY 1,584 16.0% -6.4%
Camden, NJ 2,567 -2.2% -5.7%
Charlotte, NC 5,296 9.3% -1.5%
Chicago, IL 16,788 -1.9% -1.8%
Cincinnati, OH 3,065 1.2% -6.4%
Cleveland, OH 3,782 4.4% -1.1%
Columbus, OH 3,960 16.3% -2.3%
Dallas, TX 8,945 3.1% -0.2%
Dayton, OH 1,453 6.3% -1.9%
Denver, CO 7,749 15.6% 11.6%
Detroit, MI 2,953 6.4% 0.2%
El Paso, TX 941 -6.1% 18.8%
Fort Lauderdale, FL 4,102 -6.1% -4.2%
Fort Worth, TX 4,636 10.5% 3.2%
Fresno, CA 1,055 0.8% -8.8%
Grand Rapids, MI 2,136 18.5% 3.3%
Greenville, SC 1,636 6.3% 5.7%
Hampton Roads, VA 3,225 4.7% 1.6%
Hartford, CT 2,407 10.1% 2.4%
Honolulu, HI 1,142 3.3% 4.1%
Houston, TX 12,370 4.2% 0.6%
Indianapolis, IN 4,071 13.9% 0.7%
Jacksonville, FL 3,304 4.5% 0.7%
Kansas City, MO 4,405 -1.5% -2.8%
Knoxville, TN 1,639 1.4% 27.1%
Las Vegas, NV 5,000 6.6% 9.7%
Long Island, NY 4,523 4.3% -6.3%
Los Angeles, CA 8,582 5.2% -3.6%
Louisville, KY 1,838 4.7% -4.2%
McAllen, TX 465 -0.9% -6.6%
Memphis, TN 1,529 -5.6% -5.7%
Miami, FL 4,129 -3.9% -5.5%
Milwaukee, WI 2,574 11.5% -2.1%
Minneapolis, MN 8,617 19.9% 0.7%
Montgomery County, PA 3,914 4.7% 1.8%
Nashville, TN 4,784 0.6% -4.0%
New Haven, CT 1,574 4.0% 2.9%
New Orleans, LA 1,758 -3.8% 19.6%
New York, NY 15,643 -1.7% -2.5%
Newark, NJ 4,367 -3.8% -6.3%
Oakland, CA 3,630 10.0% 0.9%
Oklahoma City, OK 2,584 -5.7% -1.4%
Omaha, NE 1,751 15.4% 6.9%
Orange County, CA 3,716 3.5% -4.4%
Orlando, FL 5,372 7.0% 5.6%
Oxnard, CA 1,040 0.7% -4.1%
Philadelphia, PA 3,636 1.5% 2.0%
Phoenix, AZ 9,981 -0.2% 2.8%
Pittsburgh, PA 3,353 6.9% 2.4%
Portland, OR 5,397 13.5% 9.7%
Providence, RI 2,944 8.9% -7.7%
Raleigh, NC 3,166 11.4% -2.5%
Richmond, VA 2,523 6.8% -0.1%
Riverside, CA 6,492 1.7% -7.9%
Rochester, NY 1,622 16.8% -2.4%
Sacramento, CA 4,285 11.6% -3.4%
Salt Lake City, UT 2,386 16.5% -4.1%
San Antonio, TX 4,137 5.0% 0.3%
San Diego, CA 4,290 4.1% -4.5%
San Francisco, CA 1,422 12.0% 6.9%
San Jose, CA 2,084 11.4% 3.4%
Seattle, WA 6,898 23.7% -0.3%
St. Louis, MO 5,036 0.8% -5.6%
Tacoma, WA 2,196 32.9% -4.1%
Tampa, FL 6,802 2.3% 0.4%
Tulsa, OK 1,619 -6.8% -5.9%
Warren, MI 5,756 12.7% -3.0%
Washington, DC 12,326 1.5% -2.7%
West Palm Beach, FL 3,732 -1.2% 0.8%
Worcester, MA 1,793 15.9% -2.6%
National 418,900 5.1% -0.7%

All Homes for Sale

Redfin Metro All Homes for Sale Month-Over-Month Year-Over-Year
Albany, NY 2,930 3.8% -1.4%
Albuquerque, NM 4,325 4.2% -5.8%
Allentown, PA 3,368 26.3% 31.1%
Atlanta, GA 24,939 1.4% -1.8%
Austin, TX 7,577 6.6% -5.7%
Bakersfield, CA 2,000 2.8% -6.0%
Baltimore, MD 10,918 11.0% 3.4%
Baton Rouge, LA 4,605 13.3% 21.5%
Birmingham, AL 4,817 0.9% -8.2%
Boston, MA 9,751 16.6% 10.5%
Bridgeport, CT 6,730 8.5% -3.2%
Buffalo, NY 1,953 11.7% -9.0%
Camden, NJ 6,212 1.8% -19.7%
Charlotte, NC 11,610 1.9% -1.1%
Chicago, IL 47,264 8.4% 11.0%
Cincinnati, OH 7,063 3.9% -7.2%
Cleveland, OH 8,102 1.9% -4.2%
Columbus, OH 6,517 9.9% -2.3%
Dallas, TX 18,264 -1.5% 9.9%
Dayton, OH 2,446 5.0% -13.7%
Denver, CO 8,677 22.0% 32.1%
Detroit, MI 4,931 4.9% 10.5%
El Paso, TX 2,486 -2.3% -7.1%
Fort Lauderdale, FL 15,118 -1.1% 13.2%
Fort Worth, TX 7,478 -0.2% 2.4%
Fresno, CA 1,778 -0.8% 8.8%
Grand Rapids, MI 2,441 11.4% 12.1%
Greenville, SC 4,442 6.9% 9.8%
Hampton Roads, VA 6,583 -0.2% -13.0%
Hartford, CT 5,822 8.7% -6.7%
Honolulu, HI 3,940 3.8% 17.6%
Houston, TX 28,646 2.9% 7.1%
Indianapolis, IN 5,175 6.9% 3.4%
Jacksonville, FL 7,918 0.8% 4.0%
Knoxville, TN 4,557 6.5% 21.3%
Las Vegas, NV 11,911 2.0% 22.1%
Long Island, NY 12,052 5.9% 6.6%
Los Angeles, CA 18,473 -1.7% 8.9%
Louisville, KY 3,153 6.8% 1.5%
McAllen, TX 1,845 -1.2% -9.0%
Memphis, TN 2,916 -1.0% -9.4%
Miami, FL 18,202 -4.1% 3.2%
Milwaukee, WI 5,158 8.6% -2.2%
Minneapolis, MN 10,740 16.3% 0.4%
Montgomery County, PA 6,686 20.5% -19.1%
Nashville, TN 11,816 4.0% 13.6%
New Haven, CT 4,240 7.2% -3.3%
New York, NY 54,690 4.0% -3.0%
Newark, NJ 11,725 7.5% 4.1%
Oakland, CA 3,904 7.2% 33.3%
Oklahoma City, OK 4,943 1.9% -11.1%
Omaha, NE 1,789 13.4% -2.4%
Orange County, CA 8,697 -1.6% 9.0%
Orlando, FL 9,795 -1.3% 1.3%
Oxnard, CA 2,500 2.4% 37.6%
Philadelphia, PA 7,023 12.8% -6.9%
Phoenix, AZ 19,579 -8.9% 0.1%
Pittsburgh, PA 9,083 3.8% -7.9%
Portland, OR 7,864 13.4% 24.9%
Providence, RI 5,670 6.5% -2.0%
Raleigh, NC 6,643 1.3% -8.9%
Richmond, VA 3,399 3.6% -5.5%
Riverside, CA 15,603 -4.0% -3.2%
Rochester, NY 1,678 14.8% -25.5%
Sacramento, CA 5,613 13.4% 6.4%
Salt Lake City, UT 4,496 26.4% 27.5%
San Antonio, TX 8,713 -5.3% -1.1%
San Diego, CA 7,088 1.5% 5.6%
San Francisco, CA 1,609 8.1% 22.7%
San Jose, CA 2,646 10.7% 60.2%
Seattle, WA 7,659 22.7% 45.8%
St. Louis, MO 11,791 19.4% -0.6%
Tacoma, WA 2,004 27.0% -7.0%
Tampa, FL 13,317 -4.2% 1.4%
Tulsa, OK 4,455 21.8% 6.5%
Warren, MI 8,349 13.3% 10.9%
Washington, DC 17,386 17.9% -5.1%
West Palm Beach, FL 14,578 -5.3% 2.6%
Worcester, MA 2,477 15.6% -4.9%
National 890,300 5.1% 2.5%

Median Off-Market Redfin Estimate

Redfin Metro Estimate Month-Over-Month Year-Over-Year
Albany, NY $214,500 0.5% 2.9%
Allentown, PA $212,600 1.6% 6.5%
Atlanta, GA $226,400 1.5% 11.5%
Austin, TX $309,800 0.9% 5.5%
Bakersfield, CA $219,400 0.7% 6.7%
Baltimore, MD $259,400 2.9% 4.9%
Baton Rouge, LA $168,700 10.8% 12.3%
Birmingham, AL $149,200 -0.1% 3.6%
Boston, MA $495,100 0.5% 4.0%
Buffalo, NY $158,500 1.5% 6.6%
Camden, NJ $196,400 1.2% 4.3%
Charlotte, NC $203,900 -1.7% 5.2%
Chicago, IL $242,700 0.4% 4.4%
Cincinnati, OH $171,200 0.8% 6.0%
Cleveland, OH $139,500 0.3% 5.4%
Columbus, OH $193,200 0.6% 6.7%
Dallas, TX $259,000 0.4% 4.2%
Dayton, OH $119,400 1.1% 4.9%
Denver, CO $410,600 -0.6% 2.0%
Detroit, MI $104,600 -3.5% 7.7%
Fort Lauderdale, FL $268,200 0.4% 6.2%
Fort Worth, TX $217,500 0.8% 6.7%
Fresno, CA $258,200 0.4% 5.8%
Grand Rapids, MI $164,400 1.3% 7.3%
Greenville, SC $186,300 8.2% 16.1%
Hampton Roads, VA $226,100 0.4% 3.3%
Honolulu, HI $693,200 0.1% 1.2%
Houston, TX $210,000 0.4% 5.0%
Indianapolis, IN $163,200 0.9% 7.5%
Jacksonville, FL $221,400 0.4% 7.4%
Kansas City, MO $187,000 -0.1% 4.9%
Knoxville, TN $173,000 8.2% 21.0%
Las Vegas, NV $278,300 0.5% 8.7%
Long Island, NY $444,200 -0.1% 4.2%
Los Angeles, CA $630,300 0.2% 4.0%
Louisville, KY $172,300 7.8% 18.6%
Memphis, TN $142,200 2.4% 9.0%
Miami, FL $299,500 0.2% 4.9%
Milwaukee, WI $193,900 -7.6% -2.9%
Minneapolis, MN $263,800 1.5% 6.3%
Montgomery County, PA $317,700 0.2% 2.5%
Nashville, TN $261,400 2.6% 10.2%
New Orleans, LA $179,100 5.5% 9.5%
Newark, NJ $370,300 0.0% 12.3%
Oakland, CA $770,300 0.4% 2.0%
Oklahoma City, OK $150,000 3.0% 9.4%
Omaha, NE $177,000 2.5% 8.2%
Orange County, CA $719,200 0.1% 2.6%
Orlando, FL $235,500 0.2% 6.3%
Oxnard, CA $602,500 0.3% 2.2%
Philadelphia, PA $180,800 -5.2% -7.8%
Phoenix, AZ $273,300 0.6% 6.6%
Pittsburgh, PA $149,900 3.4% 11.0%
Portland, OR $397,400 1.0% 3.4%
Providence, RI $296,900 0.3% 4.2%
Raleigh, NC $269,800 0.7% 6.4%
Richmond, VA $224,600 -0.1% 4.2%
Riverside, CA $367,800 0.4% 4.0%
Rochester, NY $147,600 1.5% 6.9%
Sacramento, CA $405,600 0.5% 3.5%
Salt Lake City, UT $332,100 0.6% 7.3%
San Antonio, TX $195,100 0.6% 5.6%
San Diego, CA $597,000 0.8% 2.9%
San Francisco, CA $1,323,100 0.3% -1.0%
San Jose, CA $1,191,200 -0.2% -5.8%
Seattle, WA $559,800 0.4% 0.7%
St. Louis, MO $161,100 1.9% 7.2%
Tacoma, WA $353,800 0.8% 6.5%
Tampa, FL $220,600 0.3% 5.2%
Tucson, AZ $213,300 0.1% 7.6%
Tulsa, OK $142,600 2.0% 5.8%
Warren, MI $208,000 -2.1% 2.9%
Washington, DC $393,700 1.6% 4.0%
West Palm Beach, FL $269,400 0.8% 4.0%
Worcester, MA $288,800 0.5% 5.2%
National $304,600 1.6% 4.9%
Avatar

Tim Ellis

Tim Ellis has been analyzing the real estate market since 2005, and worked at Redfin as a housing market analyst from 2010 through 2013 and again starting in 2018. In his free time, he runs the independently-operated Seattle-area real estate website Seattle Bubble, and produces the "Dispatches from the Multiverse" improvised comedy sci-fi podcast.

Email Tim

Leave a Comment

Your email address will not be published. Required fields are marked *

Be the first to see the latest real estate news:

  • This field is for validation purposes and should be left unchanged.

By submitting your email you agree to Redfin’s Terms of Use and Privacy Policy

Scroll to Top