
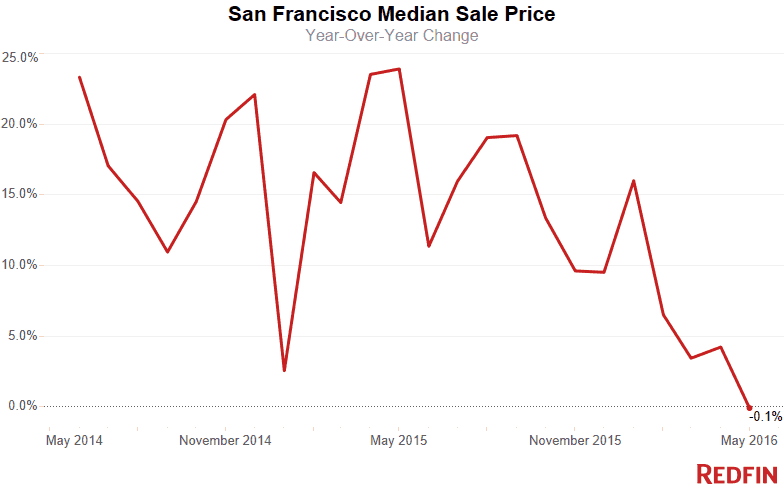
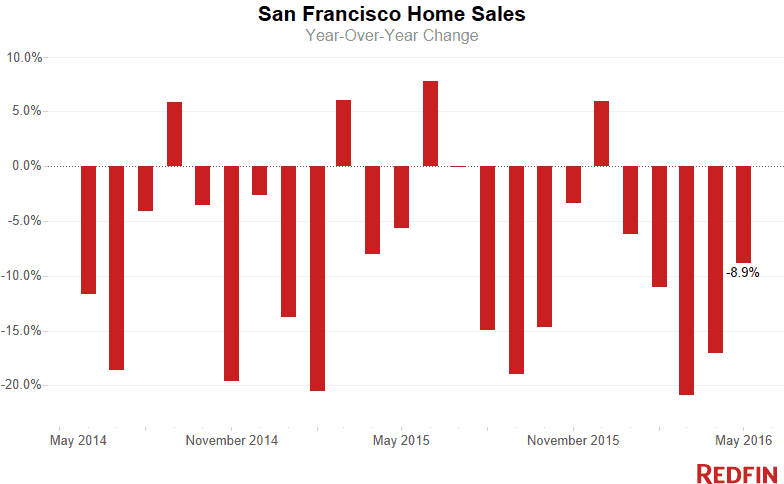
San Francisco home prices were flat in May from a year earlier, with the median holding at $1.3 million after years of record-breaking growth. Sales in the city fell nearly 9 percent, the fifth-straight month of declines as the market moves toward normalcy.
For the second month, the supply of homes for sale jumped more than 50 percent, reaching its highest level in more than three years, as more homeowners put properties in an effort to catch prices at a peak.The number of homes newly listed for sale rose 6.4 percent in May from a year earlier.
That means more choice and bargaining power for house hunters, but the supply of properties on the market still hasn’t caught up with demand, especially from buyers who want single-family homes.
The supply of condominiums and co-ops in particular has exploded, jumping nearly 70 percent from a year ago to its highest level since September 2012. Condo prices fell 5.6 percent in May from the same time last year, more than five times the drop in single-family sale prices.
“The increase in inventory is at least partly because sellers feel we’re approaching the top of the market and they don’t want to miss out,” Redfin agent Mark Colwell said. New condo construction has added to supply, too, putting pressure on pricing.
“The only significant slowdown is in luxury condominiums, where a fair number of homes have come online,” Colwell said. “It’s not a flood, especially not relative to the jobs being created, and we’re still seeing multiple offers on homes that are priced correctly. Properties owned by sellers with unrealistic price expectations are languishing.”
Bay Area
Across the greater Bay Area, the median sale price rose 5.6 percent in May to $1.2 million. Sales were flat year over year after declining for three straight months.
Hot Neighborhoods
The city’s divide between condo and single-family markets was put into stark relief last month in Excelsior and South of Market, known as SoMa.
“Excelsior consists almost entirely of single-family homes, which still get multiple offers,” Colwell said. In SoMa, a community of condominiums, “you have a lot of speculators who bought and are now trying to sell.”
In Excelsior, home sale prices jumped 15 percent in May from a year ago. In SoMa, they rose by one-tenth that amount.
Ashbury Heights was the city’s most expensive neighborhood last month, with a typical home fetching $2.2 million. Pacific Heights was close behind at $2.1 million.
Homes in The Tenderloin, still the city’s most-affordable neighborhood, had a median sale price of $535,000.
See our city page for the most up-to-date data on San Francisco home prices.
Here’s what’s happening in your neighborhood:
| Place | Median Sale Price | Year-Over-Year | Homes Sold | Year-Over-Year | Inventory | Year-Over-Year | New Listings | Median Days on Market | Avg Sale-to-List |
|---|---|---|---|---|---|---|---|---|---|
| Ashbury Heights | $2,225,000 | 42.6% | 8 | -61.9% | 3 | 0.0% | 15 | 14 | 111.0% |
| Bayview | $726,250 | 2.3% | 24 | -42.9% | 23 | -20.7% | 36 | 17 | 107.5% |
| Bernal Heights | $1,340,000 | 5.1% | 51 | -12.1% | 25 | 66.7% | 69 | 15 | 117.8% |
| Castro | $1,140,500 | 18.7% | 2 | 0.0% | 1 | NA | 3 | 11 | 99.7% |
| Civic Center / Van Ness | $762,500 | -15.2% | 32 | 52.4% | 18 | 200.0% | 51 | 14 | 105.3% |
| Colma | $800,000 | NA | 1 | NA | 1 | NA | 1 | 98 | 106.8% |
| Crocker Amazon | $777,500 | -8.3% | 8 | -42.9% | 13 | 160.0% | 14 | 18 | 106.3% |
| Daly City | $802,500 | 16.7% | 52 | 0.0% | 65 | 44.4% | 46 | 23 | 108.0% |
| Excelsior | $908,500 | 15.0% | 24 | -11.1% | 12 | -20.0% | 31 | 14 | 114.9% |
| Financial District | $1,337,000 | -5.7% | 4 | -50.0% | 7 | 133.3% | 10 | 49 | 99.0% |
| Forest Hill | $1,925,000 | 25.4% | 7 | -30.0% | 3 | -50.0% | 7 | 22 | 105.5% |
| Haight Ashbury | $1,375,000 | -7.6% | 9 | -50.0% | 4 | -20.0% | 17 | 14 | 111.3% |
| Hayes Valley | $1,400,000 | 27.3% | 5 | -54.5% | 8 | 700.0% | 15 | 21 | 107.5% |
| Ingleside | $800,000 | 5.3% | 5 | -28.6% | 9 | NA | 12 | 21 | 111.7% |
| Inner Richmond | $1,825,000 | 4.3% | 26 | -7.1% | 7 | -50.0% | 27 | 14 | 110.2% |
| Inner Sunset | $1,680,000 | 24.4% | 27 | 22.7% | 13 | 18.2% | 34 | 16 | 115.5% |
| Lower Haight | $1,265,000 | 2.8% | 12 | -36.8% | 5 | -50.0% | 17 | 14 | 115.3% |
| Merced Heights | $815,000 | 32.0% | 17 | 21.4% | 6 | 0.0% | 18 | 14 | 114.7% |
| Miraloma Park | $1,290,000 | 3.2% | 24 | -45.5% | 20 | 42.9% | 49 | 14 | 112.3% |
| Mission | $1,215,000 | 21.5% | 51 | -42.7% | 19 | 0.0% | 47 | 25 | 107.0% |
| Mission Bay | $1,305,000 | -1.0% | 49 | 28.9% | 19 | 280.0% | 57 | 19 | 101.8% |
| Nob Hill | $1,305,000 | -18.4% | 18 | -21.7% | 16 | 100.0% | 31 | 21 | 101.0% |
| Noe Valley | $1,720,000 | -2.8% | 62 | -26.2% | 27 | 17.4% | 79 | 14 | 110.1% |
| Outer Mission | $865,000 | 7.3% | 5 | -58.3% | 7 | 133.3% | 17 | 14 | 113.2% |
| Outer Richmond | $1,377,500 | 2.0% | 22 | 4.8% | 18 | 100.0% | 35 | 20 | 117.0% |
| Outer Sunset | $1,080,000 | 8.3% | 44 | 15.8% | 10 | 0.0% | 43 | 14 | 119.3% |
| Pacific Heights | $923,000 | 8.3% | 5 | -37.5% | 3 | -25.0% | 8 | 23 | 102.8% |
| Pacific Heights | $2,113,000 | -19.0% | 52 | -5.4% | 43 | 104.8% | 89 | 13 | 106.1% |
| Parkside | $1,176,000 | 6.9% | 30 | 57.9% | 9 | -10.0% | 27 | 16 | 118.7% |
| Portola | $887,500 | 4.0% | 14 | -6.7% | 12 | 50.0% | 26 | 18 | 113.3% |
| Potrero Hill | $1,160,000 | -18.3% | 45 | 12.5% | 26 | 62.5% | 59 | 15 | 108.6% |
| Rincon Hill | $1,120,000 | -6.7% | 30 | -14.3% | 42 | 180.0% | 60 | 14 | 101.2% |
| Russian Hill | $1,619,774 | -1.8% | 32 | 18.5% | 22 | 144.4% | 52 | 13 | 106.2% |
| South of Market | $987,500 | 1.5% | 78 | -22.0% | 77 | 87.8% | 135 | 20 | 101.9% |
| South San Francisco | $850,000 | 13.3% | 35 | 16.7% | 55 | 19.6% | 41 | 20 | 107.7% |
| Sunnyside | $1,210,000 | 6.6% | 23 | 4.5% | 10 | 0.0% | 28 | 13 | 118.7% |
| Sunset District | $1,300,000 | 13.0% | 147 | 8.9% | 54 | 12.5% | 174 | 14 | 118.8% |
| Telegraph Hill | $990,000 | -23.7% | 18 | -10.0% | 7 | 0.0% | 20 | 13 | 105.1% |
| Tenderloin | $535,000 | -38.9% | 5 | 66.7% | 3 | 0.0% | 9 | 15 | 102.7% |
| Twin Peaks | $1,650,000 | 50.0% | 5 | -58.3% | 2 | 100.0% | 5 | 12 | 107.4% |
| Visitacion Valley | $790,000 | 4.4% | 8 | -60.0% | 8 | 0.0% | 15 | 14 | 109.9% |
| Western Addition | $1,150,000 | 16.8% | 13 | -31.6% | 7 | 40.0% | 18 | 22 | 106.2% |
| San Francisco, CA | $1,300,000 | -0.1% | 472 | -8.9% | 827 | 51.2% | 649 | 15 | 110.2% |
NOTE: Not all neighborhoods are listed, but totals for San Francisco encompass the entire city. Data is based on listing information and might not reflect all real estate activity in the market. Neighborhood-specific data is measured over a three-month span that ended May 31. Inventory measures listings active as of May 31.
For more information, contact Redfin journalist services
Phone: 206-588-6863
Email: press@redfin.com
See Redfin’s data center to find out what’s happening in other cities.
To be added to Redfin’s press release distribution list, subscribe here.


