As temperatures rise, droughts are expected to become more frequent and severe across the United States. Learn more about what contributes to water stress, how to prepare your home for a drought, and which areas in the U.S. are most at risk.
Redfin has partnered with two leading climate data organizations, First Street Foundation and ClimateCheck, to provide our users with comprehensive climate risk information for every zip code, neighborhood, city, and county in the contiguous U.S.
Drought Risk Frequently Asked Questions
What’s the United States drought monitor?
What is water stress?
What are the types of water stress?
What is a drought?
There are four types of drought:
1. Meteorological - lack of precipitation
2. Agricultural - lack of moisture in the soil where crops grow
3. Hydrological - low levels of water in lakes and reservoirs
4.Socioeconomic - water shortages in drinking and running water
Where do droughts occur?
Which areas in the US are most at risk of a drought?
How to prepare your property for a drought?
Can a drought cause damage to your home’s foundation?
When soil is overly dry:
- Driveways and sidewalks tend to crack, as do brick walls, drywall, tile and stucco.
- Homeowners may notice windows and doors sticking when the home’s foundation shifts even slightly.
- Pipes may break if they are bracketed to the foundation, which may cause leaks.
Drought can affect the structural integrity of your home, so it’s wise to learn how to look at the drought reports so you can take steps to prevent damage.
The Top 10 U.S. Cities Most at Risk of Water Stress ( Droughts)
| Rank | City | Drought risk rating | Average water stress (historical) | Average 2050 water stress |
|---|---|---|---|---|
| 1 | Henderson, NV | 100 | 1.44 | 1.54 |
| 2 | Las Vegas, NV | 100 | 1.44 | 1.54 |
| 3 | San Antonio, TX | 90 | 0.94 | 1.12 |
| 4 | San Diego, CA | 86 | 0.81 | 0.96 |
| 5 | Los Angeles, CA | 84 | 0.59 | 0.74 |
| 6 | Long Beach, CA | 82 | 0.53 | 0.66 |
| 7 | Colorado Springs, CO | 81 | 0.60 | 0.70 |
| 8 | Santa Ana, CA | 77 | 0.69 | 0.83 |
| 9 | Anaheim, CA | 76 | 0.62 | 0.74 |
| 10 | Denver, CO | 70 | 0.32 | 0.42 |
*Drought risk is measured by the ratio of water demand to water supply, based on historical and projected information about water availability and human uses. Water stress values over 0.4 are considered at especially high risk of water shortages.
Additional Drought Risk Resources
Is Your Home at Risk?
Discover how climate and natural hazards could impact your neighborhood
Climate & Environmental Risk Types


Find us
Subsidiaries
Affiliated Business
 United States
 Canada
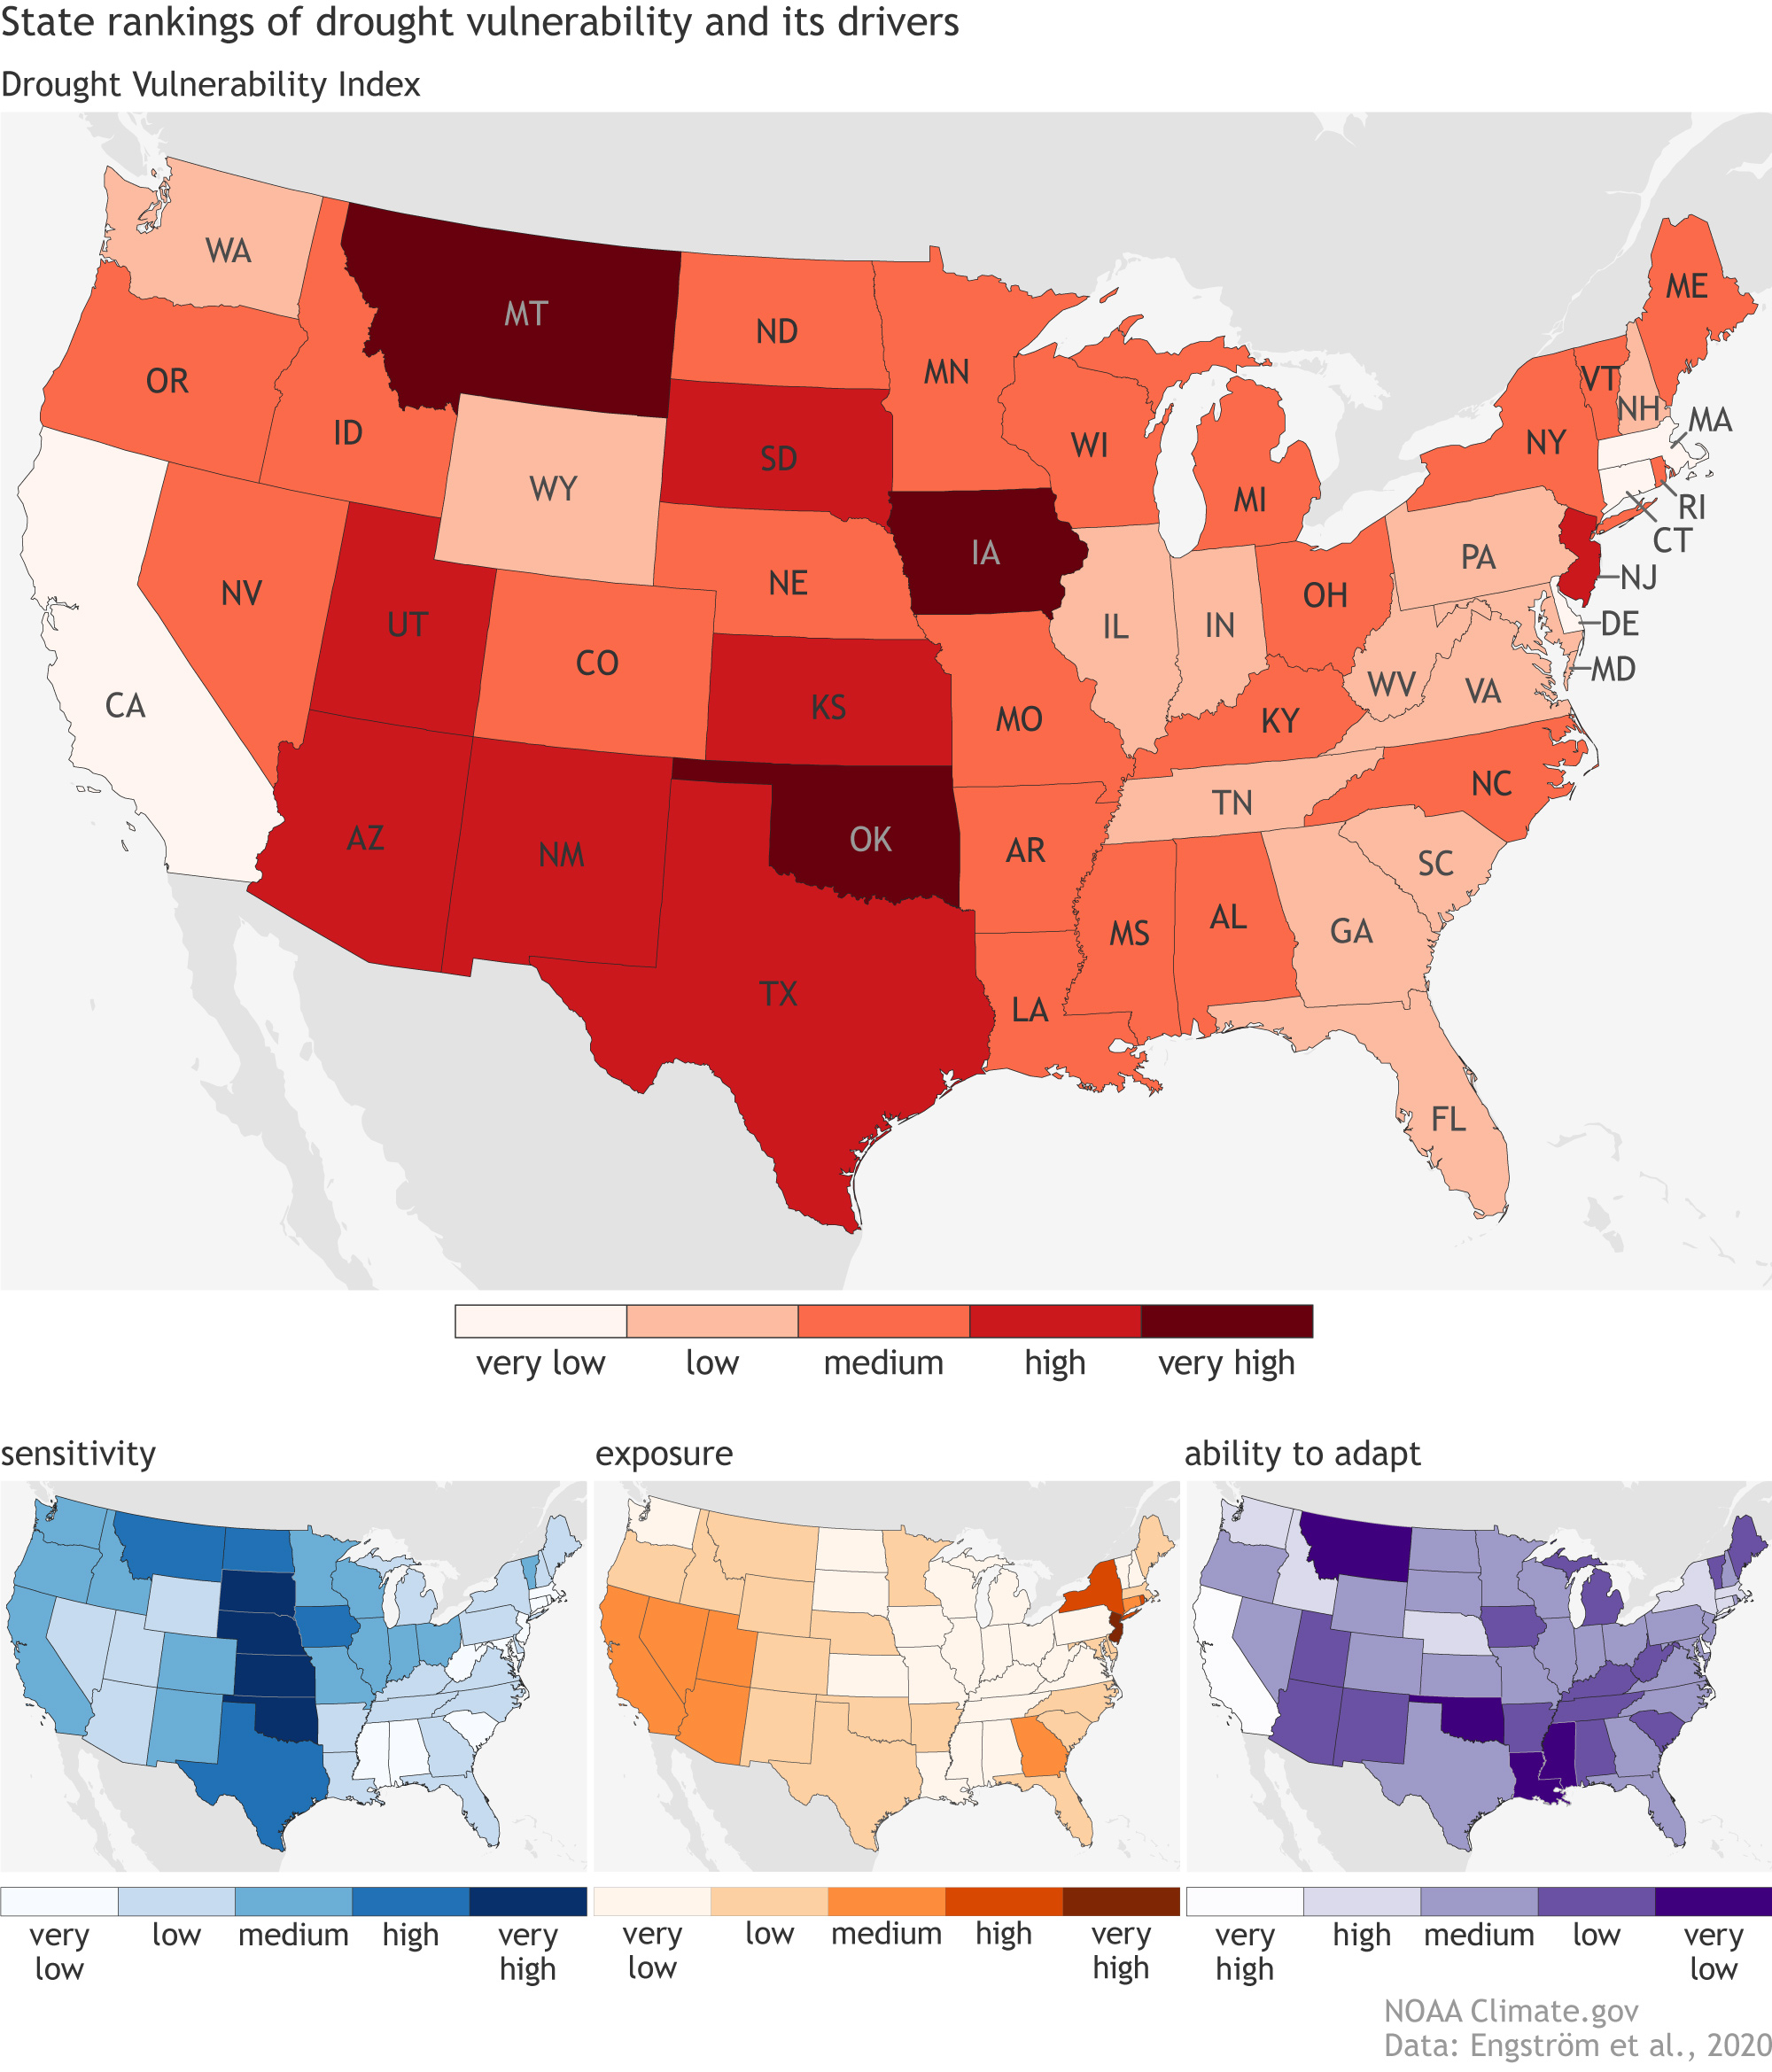
Copyright: © 2026 Redfin. All rights reserved.
Updated September 2025: By searching, you agree to the Terms of Use, and Privacy Policy.
Do not sell or share my personal information.
REDFIN and all REDFIN variants, WALK SCORE, and the R logos, are trademarks of Redfin Corporation, registered or pending in the USPTO.
California DRE #01521930
Redfin is licensed to do business in New York as Redfin Real Estate. NY Standard Operating Procedures
New Mexico Real Estate Licenses
TREC: Info About Brokerage Services, Consumer Protection Notice
All mortgage lending products and information are provided by Rocket Mortgage, LLC | NMLS #3030; www.NMLSConsumerAccess.org. Licensed in 50 states. This site is not authorized by the New York State Department of Financial Services for mortgage solicitation or loan applications activities related to properties located in the State of New York.
Redfin Corporation is an affiliated business of Rocket Limited Partnership. Each company, and their subsidiaries, are separate legal entities operated and managed through its own management and governance structures.
If you are using a screen reader, or having trouble reading this website, please call Redfin Customer Support for help at 1-844-759-7732.
 REDFIN IS COMMITTED TO AND ABIDES BY THE FAIR HOUSING ACT AND EQUAL OPPORTUNITY ACT. READ REDFIN'S FAIR HOUSING POLICY AND THE NEW YORK STATE FAIR HOUSING NOTICE.