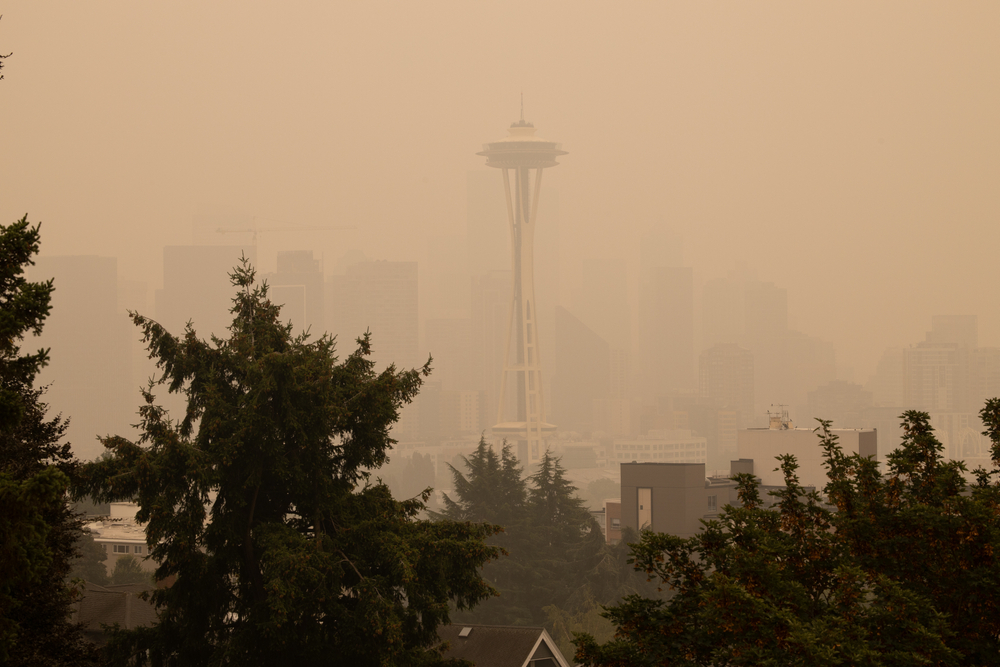
Wildfires are a major risk to homeowners across the United States. Unfortunately, the risk is growing. As the climate warms and rainfall patterns change, places are experiencing longer and hotter summers and reduced snowpack, leading to larger and more destructive wildfire seasons. For example, the wildfire season in the Western U.S. has increased by more than 100 days since 1970, and has cost more than $90 billion from 2017-2021 alone. In short, wildfires are immensely destructive and affect a growing number of homes every year. So what should you do?
To help current and future home searchers understand the impact of climate change on wildfires, Redfin has partnered with climate nonprofit First Street to show the Fire Factor® for every property on Redfin.com. Fire Factor® builds off of decades of peer-reviewed research to show the current and future wildfire risk for every home, city, and county so homebuyers and homeowners have all the information they need when deciding where to live.
Fire Factor® uses a patented Wildfire Model to determine a specific location’s probabilistic risk of wildfire based on vegetation, topography, historic observations, and weather. Fire Factor® is available for any location in the contiguous United States. More information can be found on the Risk Factor™ website.
Fire Risk Frequently Asked Questions
What is a wildfire?
People and lightning are the two leading causes of wildfires in the U.S.; human activity caused nearly 85% of wildfires between 2000 and 2017.
Does my homeowner's insurance cover damage caused by wildfires?
An important change affecting the insurance landscape is the growing risk of disasters, especially wildfires. As a result of increased losses and claims, some insurers are pulling out of offering homeowners insurance altogether. Those that still offer plans are often becoming exorbitantly expensive.
If you’re planning on moving to an area at risk of wildfires, do your research to ensure you can find coverage, or understand the risk of going uninsured. State-mandated pool insurance, like California’s FAIR Plan, may be a resource if insurance is otherwise unavailable.
Does my renter's insurance cover damage from wildfires?
If you’re looking for rentals in a high fire-risk area, make sure to pay attention to these three characteristics to help you reduce the risk of wildfire damage to yourself and your home:
- The density of the area and zoning: A real estate agent should tell you if the home is located in a flood, fire, or earthquake zone.
- Existing wildfire mitigation and fire safety features: Look for homes where steps have been taken to reduce wildfire risk, including fire-resistant roofs and siding, and native landscaping at least 5 feet away from home.
- Multiple exits: Homes should have two exits on each level for easy exit in emergency situations.
How do I protect my home from wildfires
Start with your roof, since it's the most vulnerable part of your home, and work your way down. Clean out your gutters and clear flammable materials such as dead leaves to prevent the risk of flammable debris from igniting and causing a wildfire.
From there, you can make more extensive fireproofing improvements such as upgrading your roof to non-combustible Class A roofing, composite shingles, metal, concrete, or clay tiles. You can also replace your windows with multi-pane or tempered glass.
Choose nonflammable gates and fencing, and replace your deck with non-combustible deck boards designed for wildfire-prone areas.
Lastly, your landscaping is essential to protect your home from wildfires. The most important thing is to create a defensible zone following the Home Ignition Zone guidelines. Here’s a breakdown:
- Immediate zone (0-5 feet): Keep areas 0-5 feet away from your house free from all vegetation. Start here and work your way outward. Fires should be unable to reach your house if this zone is completely clear.
- Intermediate zone (5-30 feet): This zone acts as a buffer. You can have vegetation, but make sure to space it out and create breaks with driveways, walkways, and hardscaping.
- Extended zone (30-200 feet): The last zone is focused on disrupting fires, not stopping them entirely. Remove vegetation that can carry a ground fire to treetops, keep grass and other plants short, and keep at least 6-12 feet between tree canopies.
Do I live in a high-risk fire zone?
If you want to know more about whether your property is in a high-risk fire zone, search your address on the Risk Factor website and scroll down to “Fire Factor”. You can also check your location at the Wildfire Risk website.
Is my home at risk of damage or destruction from a wildfire?
Most wildfires actually occur in the Eastern and Central U.S. in states like Pennsylvania and Minnesota. However, wildfires in the Western states – especially Alaska, Arizona, California, Colorado, Oregon, and Washington – burn the most acreage and are the most destructive.
How many homes are destroyed by wildfires each year?
Unfortunately, this number is growing. A recent study found that there has been a 246% increase in the number of homes and structures destroyed by wildfires between 1999-2009 and 2010-2020. The largest increases have occurred in the most recent years.
The Top 10 U.S. Cities Most at Risk of Fire Damage
| Rank | Metro | Share of Properties With a High Fire Factor® Risk | Total Properties With a High Fire Factor® Risk |
|---|---|---|---|
| 1 | Carson City, NV | 96% | 19,497 |
| 2 | St. George, UT | 96% | 96,885 |
| 3 | Stephenville, TX | 95% | 21,998 |
| 4 | Borger, TX | 95% | 17,703 |
| 5 | Andrews, TX | 94% | 9,450 |
| 6 | Pampa, TX | 94% | 16,103 |
| 7 | Las Vegas, NV | 92% | 26,546 |
| 8 | Nogales, AZ | 92% | 39,595 |
| 9 | Casper, WY | 92% | 39,687 |
| 10 | Brownwood, TX | 90% | 29,185 |
“High risk” is defined as a property having a Fire Factor® of 5 (major) or higher.
This page is for informational purposes only and is not a substitute for professional advice from a medical provider. Consumers should independently verify any claim, agency, or service mentioned. Learn more about our Editorial Guidelines here.
Additional Fire Risk Resources
Is Your Home at Risk?
Discover how climate and natural hazards could impact your neighborhood
Learn More About Climate Risks


Find us
Subsidiaries
Affiliated Business
 United States
 Canada
Copyright: © 2026 Redfin. All rights reserved.
Updated September 2025: By searching, you agree to the Terms of Use, and Privacy Policy.
Do not sell or share my personal information.
REDFIN and all REDFIN variants, WALK SCORE, and the R logos, are trademarks of Redfin Corporation, registered or pending in the USPTO.
California DRE #01521930
Redfin is licensed to do business in New York as Redfin Real Estate. NY Standard Operating Procedures
New Mexico Real Estate Licenses
TREC: Info About Brokerage Services, Consumer Protection Notice
All mortgage lending products and information are provided by Rocket Mortgage, LLC | NMLS #3030; www.NMLSConsumerAccess.org. Licensed in 50 states. This site is not authorized by the New York State Department of Financial Services for mortgage solicitation or loan applications activities related to properties located in the State of New York.
Redfin Corporation is an affiliated business of Rocket Limited Partnership. Each company, and their subsidiaries, are separate legal entities operated and managed through its own management and governance structures.
If you are using a screen reader, or having trouble reading this website, please call Redfin Customer Support for help at 1-844-759-7732.
 REDFIN IS COMMITTED TO AND ABIDES BY THE FAIR HOUSING ACT AND EQUAL OPPORTUNITY ACT. READ REDFIN'S FAIR HOUSING POLICY AND THE NEW YORK STATE FAIR HOUSING NOTICE.