
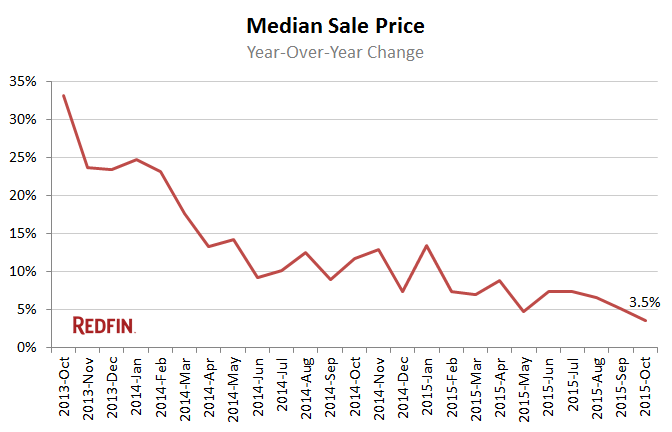
Los Angeles home prices rose just 3.5 percent in October from a year earlier to $553,500, marking the fourth consecutive month of slowing price appreciation. Sales in the city were flat, ending a four-month run of year-over-year growth.
Despite the weak showing, homes are selling quickly. The typical L.A. home spent 21 days on the market in October, four fewer than the same time last year. A shortage of homes was one reason for the rapid pace of sales. Inventory was down 16 percent from last year and new listings grew a mere 0.2 percent.
Asking prices leapt by nearly 14 percent over last year, but buyers refused to play along, forcing the gap between sale and list prices to its widest since March.
“The market is shifting and sellers haven’t quite caught up,” Redfin agent John Underwood said. “Sellers watched as their neighbors’ home prices soared throughout the summer. Now they expect the same, but prices just aren’t rising as dramatically as in previous months. Part of this is seasonality, but it’s also because buyers are demanding more for their money.”

Area Trends
The Valley’s inventory declined by about 20 percent in October, which, paired with abundant homebuyer demand, intensified competition and sped up the market. Inventory fell by 47.5 percent in Pacoima, 44 percent in Valley Village and 37 percent in Sylmar from last year. The typical Valley home is now selling in about 20 days compared to 23 days in the North Valley and 25 days in the South Valley a year ago.
Although the Valley is attracting buyers due to its relative affordability, the Eastside remains the city’s most competitive market, with about half of homes selling for above asking price. Prices actually declined in several Westside neighborhoods, such as Brentwood, Beverly Glen and Century City. But the median sale price for the Westside as a whole continued to climb above $1.1 million.
Hot Neighborhoods
The trendy Eastside neighborhoods of Echo Park, Highland Park and Mount Washington continued to top the list of the city’s hottest neighborhoods, but there was new competition for that title last month.
With median sale prices between $400 and $500k, Panorama City and West Adams started catching on, with about 65 percent of homes fetching more than asking price in October. Given its affordability and central location, everyone has an eye on West Adams as a potential hotbed for flippers in the year to come.
Here’s what’s happening in your neighborhood:
| Neighborhood | Median Sale Price | Year-Over-Year | Homes sold | Year-Over-Year | Inventory | Year-Over-Year |
|---|---|---|---|---|---|---|
| Beverly Glen | $1,337,500 | -8.9% | 14 | 16.7% | 39 | -13.3% |
| Beverly Hills Post Office | $2,150,000 | -0.8% | 53 | 15.2% | 124 | -8.1% |
| Brentwood | $1,125,000 | -9.3% | 110 | -24.1% | 206 | 10.8% |
| Central LA | $845,000 | 11.6% | 731 | 3.4% | 1,041 | -6.4% |
| Century City | $821,500 | -4.4% | 88 | 4.8% | 136 | 3.8% |
| Chatsworth | $537,000 | 10.7% | 143 | -4.0% | 123 | -35.9% |
| Cheviot Hills | $1,795,000 | 30.1% | 23 | 15.0% | 20 | -4.8% |
| Crenshaw | $439,000 | -4.4% | 40 | -13.0% | 48 | 9.1% |
| Downtown (Los Angeles, CA) | $605,000 | 3.2% | 99 | -7.5% | 139 | -9.2% |
| Eagle Rock | $716,000 | 16.0% | 75 | 4.2% | 70 | 2.9% |
| East LA | $610,000 | 14.6% | 524 | 20.7% | 484 | -9.0% |
| Echo Park / Edendale | $750,288 | 26.4% | 45 | 15.4% | 62 | 34.8% |
| Encino | $720,000 | 3.1% | 213 | 26.8% | 259 | -4.8% |
| Fox Hills | $450,000 | 11.1% | 28 | -9.7% | 18 | -21.7% |
| Glassell Park | $618,750 | 12.2% | 78 | 95.0% | 46 | -14.8% |
| Hancock Park | $2,717,775 | 113.2% | 17 | 6.3% | 25 | 4.2% |
| Highland Park | $610,000 | 19.0% | 73 | -6.4% | 80 | -20.0% |
| Hollywood | $735,000 | 7.3% | 63 | -7.4% | 88 | -1.1% |
| Hollywood Hills | $1,150,000 | 5.0% | 178 | 11.9% | 298 | -2.6% |
| Holmby Hills | $1,950,000 | 43.1% | 9 | 12.5% | 19 | 5.6% |
| Koreatown / Wilshire Center | $510,000 | -5.6% | 83 | 9.2% | 132 | -22.4% |
| Lake Balboa | $463,000 | 6.2% | 109 | 26.7% | 75 | -34.2% |
| Marina Del Rey | $891,500 | 18.1% | 78 | 0.0% | 76 | -31.5% |
| Mid-City | $821,500 | 17.4% | 82 | -12.8% | 121 | -12.3% |
| Mid-Wilshire | $846,000 | 13.9% | 271 | -9.7% | 406 | -10.0% |
| Mount Washington | $689,000 | 6.0% | 65 | 3.2% | 62 | -7.5% |
| North Hills | $451,500 | 10.1% | 100 | -9.1% | 115 | -22.3% |
| North Hollywood | $479,500 | 17.0% | 135 | 1.5% | 146 | -17.5% |
| North Valley | $457,000 | 7.8% | 1,331 | 6.5% | 1,313 | -23.1% |
| Northridge | $549,975 | 6.8% | 138 | 2.2% | 151 | -20.1% |
| Northwest San Pedro | $475,000 | 7.3% | 96 | 45.5% | 81 | 3.8% |
| Pacific Palisades | $2,450,750 | 23.8% | 94 | -12.1% | 159 | 12.8% |
| Pacoima | $365,000 | 13.2% | 80 | 3.9% | 64 | -47.5% |
| Panorama City | $408,000 | 6.0% | 70 | 48.9% | 50 | -35.9% |
| Sherman Oaks | $680,000 | -2.9% | 282 | 8.9% | 318 | -9.4% |
| Silver Lake | $757,644 | -10.9% | 74 | 29.8% | 76 | 11.8% |
| South Central LA | $327,600 | 9.2% | 152 | 0.7% | 227 | -1.7% |
| South LA | $350,000 | 9.4% | 605 | 2.4% | 801 | -5.4% |
| South Valley | $532,500 | 6.5% | 1,787 | 16.6% | 1,854 | -19.4% |
| Studio City | $977,500 | 12.7% | 166 | 23.9% | 235 | 7.3% |
| Sun Valley | $420,000 | 8.1% | 67 | -17.3% | 84 | -18.4% |
| Sylmar | $402,750 | 7.8% | 165 | 28.9% | 142 | -36.9% |
| Tarzana | $560,500 | 23.2% | 137 | 5.4% | 182 | -19.1% |
| Valley Village | $709,500 | 1.4% | 52 | 6.1% | 35 | -43.5% |
| Van Nuys | $485,000 | 16.5% | 132 | 10.9% | 116 | -31.0% |
| Venice | $1,642,500 | 17.3% | 75 | 7.1% | 112 | 7.7% |
| Watts | $265,000 | 13.8% | 79 | 6.8% | 113 | 6.6% |
| West Adams | $465,750 | 12.5% | 34 | 13.3% | 16 | -54.3% |
| West Long Beach | $367,526 | 12.1% | 37 | -2.6% | 38 | 18.8% |
| West Los Angeles | $1,128,500 | 19.4% | 1,444 | -4.3% | 1,867 | -2.0% |
| Westwood | $880,000 | 3.6% | 127 | -4.5% | 168 | 4.3% |
| Woodland Hills | $667,750 | 5.2% | 256 | 24.9% | 251 | -28.1% |
| Los Angeles | $553,500 | 3.5% | 2,281 | 0.2% | 5,804 | -16.0% |
| Neighborhood | New Listings | Median Days on Market | Avg Sale-to-List |
|---|---|---|---|
| Beverly Glen | 38 | 20 | 95.3% |
| Beverly Hills Post Office | 99 | 36 | 95.2% |
| Brentwood | 203 | 22 | 98.9% |
| Central LA | 1,133 | 23 | 98.3% |
| Century City | 141 | 14 | 98.7% |
| Chatsworth | 151 | 26 | 97.7% |
| Cheviot Hills | 24 | 14 | 101.6% |
| Crenshaw | 71 | 12 | 100.4% |
| Downtown (Los Angeles, CA) | 140 | 31 | 97.0% |
| Eagle Rock | 90 | 20 | 100.8% |
| East LA | 684 | 15 | 101.2% |
| Echo Park / Edendale | 69 | 15 | 104.5% |
| Encino | 276 | 21 | 97.1% |
| Fox Hills | 30 | 15 | 100.7% |
| Glassell Park | 95 | 9 | 99.8% |
| Hancock Park | 31 | 21 | 98.0% |
| Highland Park | 106 | 13 | 102.1% |
| Hollywood | 96 | 24 | 97.2% |
| Hollywood Hills | 292 | 26 | 97.9% |
| Holmby Hills | 18 | 29 | 99.6% |
| Koreatown / Wilshire Center | 143 | 23 | 98.7% |
| Lake Balboa | 117 | 17 | 98.4% |
| Marina Del Rey | 103 | 18 | 99.1% |
| Mid-City | 149 | 14 | 99.4% |
| Mid-Wilshire | 462 | 21 | 98.8% |
| Mount Washington | 99 | 16 | 102.0% |
| North Hills | 141 | 20 | 98.6% |
| North Hollywood | 183 | 14 | 99.3% |
| North Valley | 1,675 | 20 | 98.7% |
| Northridge | 175 | 32 | 97.2% |
| Northwest San Pedro | 99 | 30 | 98.7% |
| Pacific Palisades | 160 | 20 | 98.8% |
| Pacoima | 93 | 22 | 100.2% |
| Panorama City | 74 | 14 | 102.1% |
| Sherman Oaks | 377 | 17 | 98.2% |
| Silver Lake | 99 | 16 | 102.0% |
| South Central LA | 251 | 22 | 98.6% |
| South LA | 961 | 18 | 99.7% |
| South Valley | 2,264 | 19 | 98.1% |
| Studio City | 268 | 22 | 97.5% |
| Sun Valley | 96 | 17 | 98.0% |
| Sylmar | 190 | 21 | 99.5% |
| Tarzana | 193 | 26 | 95.5% |
| Valley Village | 56 | 13 | 98.9% |
| Van Nuys | 164 | 15 | 98.6% |
| Venice | 133 | 34 | 97.8% |
| Watts | 127 | 24 | 100.3% |
| West Adams | 39 | 18 | 101.5% |
| West Long Beach | 48 | 18 | 99.6% |
| West Los Angeles | 2,116 | 17 | 99.4% |
| Westwood | 148 | 23 | 97.4% |
| Woodland Hills | 306 | 18 | 97.8% |
| Los Angeles | 3,292 | 21 | 98.7% |
NOTE: Not all neighborhoods are listed, but totals for L.A. encompass entire city. Data is based on listing information and might not reflect all real estate activity in the market. Neighborhood-specific data is measured over the three months ended Oct. 31. Inventory measures listings active as of Oct. 31.
For more information, contact Redfin journalist services
Phone: 206-588-6863
Email: press@redfin.com
Want to receive information like this every month? Click here join our media email list.
Other popular posts:
1. Simple Home Fixes to Ease Parenting with Disabilities
2. How to Boost Resale Value with Home Improvements
3. How to Prevent and Treat Seasonal Affective Disorder at Home


