
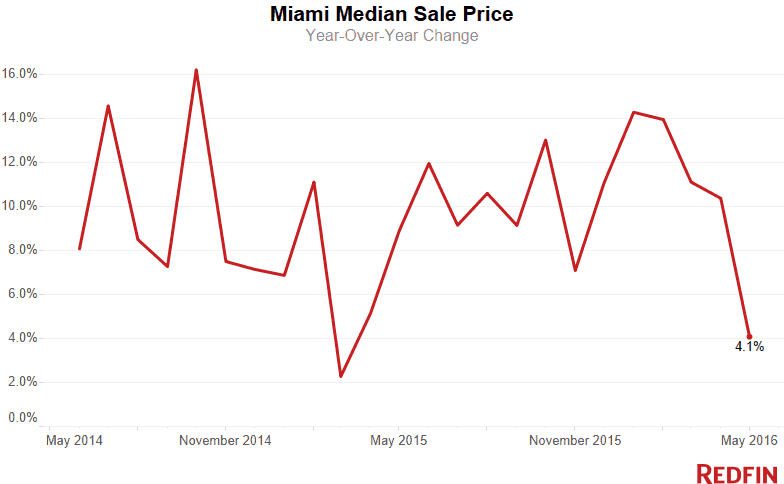
Miami home prices rose 4.1 percent in May to a median $255,000 from a year earlier, an abrupt slowdown following five months of rapid growth.
Sales, which have lagged their 2015 pace all year, fell 17.2 percent. It was the fourth-straight month of double-digit, year-over-year declines.
The number of homes hitting the market for the first time in May rose 8.5 percent, the biggest jump since February but not enough to make a difference for buyers. The total inventory of properties for sale fell for the third month, shrinking 1.8 percent year over year.
Homes found buyers 18 days faster in May than they did a year prior, staying on the market for a median 52 days.
Condos
Condo prices dropped for the third-straight month, falling 6.6 percent to $170,625. Sales fell nearly 23 percent, the fourth month of dramatic declines.
New units flooded the market (up 16.8 percent from last year), contributing to a 6.8 percent increase in the total number of condos for sale. That translated to more than 10 months of supply, giving buyers strong leverage to negotiate lower prices.
“I recently negotiated a 10 percent price reduction from the list price on a Miami condo for my client,” Miami Redfin agent Aaron Drucker said. “The seller recognized that with the huge number of condos for sale on the market right now, he’d have to adjust his expectations and make a better deal.”
Condos that did sell found buyers 17 days faster than they did a year earlier. Fewer than one in 10 sold for more than asking price.
Single-Family Homes
Single-family home prices surged 10.3 percent to a new high of $307,750 in May. Sales dropped 15.2 percent as buyers backed away from rising prices.
With only about a four-month supply of single-family houses up for sale, those Miami sellers have the upper hand. While more sellers planted for-sale signs in May, there still weren’t enough of them. The total inventory of single-family houses for sale slid 8.1 percent from a year earlier.
“The market in Miami is currently favoring single-family residence sellers and condo buyers,” Drucker said. “Sometimes I’ll advise clients to sell their single-family homes and then, instead of trying to find a comparable single-family residence, look in the condo market. That gives them the best of both worlds.”
With single-family homes in demand, they sold 15 days faster in May than a year earlier.
Neighborhood Trends
Sunny Isles Beach had one of the largest jumps in median sale price, increasing 22.7 percent to $460,000. This area also had one of the steepest declines in home sales, down 43.8 percent.
South Point continued to fetch some of the highest prices with a $884,500 median sale price in May. A typical home there spent 146 days on the market.
Hialeah had one of the fastest housing markets, with homes finding buyers in just 30 days on average. Hialeah was also one of the most affordable neighborhoods with a median sale price of $175,550 in May.
| Place | Median Sale Price | Year-Over-Year | Homes Sold | Year-Over-Year | Inventory | Year-Over-Year | New Listings | Median Days on Market | Avg Sale-to-List |
|---|---|---|---|---|---|---|---|---|---|
| Andover | $151,824 | NA | 1 | NA | 4 | NA | 7 | 69 | 72.3% |
| Aventura | $311,000 | -5.3% | 284 | -19.8% | 1,336 | 20.0% | 717 | 138 | 93.9% |
| Bal Harbour | $710,000 | -11.2% | 11 | -15.4% | 192 | 40.2% | 37 | 102 | 94.7% |
| Bay Harbor Islands | $387,500 | 29.2% | 8 | -11.1% | 143 | 36.2% | 24 | 23 | 92.0% |
| Bay Point | $2,025,000 | -25.3% | 2 | 0.0% | 16 | 60.0% | 8 | 444 | 86.8% |
| Bayshore | $975,000 | 31.8% | 23 | -46.5% | 129 | 27.7% | 59 | 246 | 91.6% |
| Biscayne Park | $285,000 | -20.5% | 1 | -87.5% | 30 | 36.4% | 8 | 9 | 95.3% |
| Biscayne Point | $240,000 | -14.3% | 17 | -37.0% | 71 | 6.0% | 44 | 61 | 95.5% |
| Brentwood | $180,000 | 44.0% | 3 | 0.0% | 2 | -71.4% | 6 | 65 | 98.7% |
| Brickell | $342,500 | -16.5% | 178 | -43.9% | 1,438 | 13.1% | 663 | 142 | 94.6% |
| Coral Gables | $635,000 | 22.1% | 75 | -28.6% | 592 | 10.4% | 139 | 78 | 95.6% |
| Coral Way | $368,000 | 11.5% | 171 | -25.0% | 420 | -5.8% | 346 | 63 | 95.3% |
| Cutler Bay | $239,175 | 11.8% | 74 | -10.8% | 217 | -32.8% | 110 | 41 | 97.3% |
| Doral | $275,500 | -6.6% | 55 | -23.6% | 813 | 18.9% | 160 | 75 | 95.5% |
| Downtown | $385,000 | 8.2% | 107 | -33.5% | 781 | 12.0% | 352 | 165 | 95.0% |
| Eastern Shores | $176,250 | 15.2% | 28 | -9.7% | 109 | 17.2% | 60 | 122 | 94.7% |
| El Portal | $346,500 | 4.7% | 4 | -33.3% | 22 | 83.3% | 5 | 57 | 94.6% |
| Fisher Island | $21,500,000 | 633.1% | 1 | -75.0% | 60 | 17.6% | 4 | 3 | 79.1% |
| Flamingo-Lummus | $218,000 | 4.1% | 105 | -30.0% | 462 | 17.6% | 239 | 108 | 94.7% |
| Hialeah | $175,550 | 15.3% | 314 | -9.8% | 249 | -38.8% | 409 | 30 | 97.8% |
| Highland Village | $73,000 | -28.4% | 2 | 100.0% | NA | NA | 1 | 55 | 97.9% |
| Homestead | $179,000 | 18.5% | 189 | -7.3% | 569 | -38.9% | 263 | 42 | 96.9% |
| Kendall | $244,500 | 12.2% | 98 | -13.3% | 329 | -25.4% | 108 | 58 | 96.1% |
| Key Biscayne | $1,100,000 | 0.9% | 21 | 0.0% | 304 | 38.2% | 50 | 175 | 99.6% |
| Keystone Point | $1,017,500 | 49.0% | 10 | -41.2% | 53 | 47.2% | 28 | 108 | 92.4% |
| La Gorce | $1,760,000 | 17.3% | 10 | -52.4% | 93 | 55.0% | 33 | 203 | 87.9% |
| Lakewood Estates | $159,500 | NA | 1 | NA | NA | NA | 1 | 91 | 94.1% |
| Little Haiti | $185,000 | 12.1% | 49 | -25.8% | 106 | 14.0% | 88 | 48 | 95.3% |
| Little Havana | $167,000 | 1.2% | 52 | 6.1% | 88 | -9.3% | 76 | 46 | 95.8% |
| Miami Lakes | $310,000 | 3.4% | 89 | -8.2% | 109 | -7.6% | 122 | 46 | 97.0% |
| Miami Shores | $396,000 | 10.0% | 71 | -31.1% | 152 | 2.0% | 134 | 76 | 95.5% |
| Miami Springs | $335,000 | 6.3% | 9 | -47.1% | 42 | -2.3% | 11 | 37 | 97.6% |
| New Belle Meade | $564,000 | -69.0% | 3 | 50.0% | 1 | 0.0% | 1 | 134 | 96.1% |
| Normandy Isle | $215,000 | -25.6% | 27 | -34.2% | 73 | 25.9% | 39 | 92 | 95.7% |
| North Bay Village | $265,000 | -3.3% | 21 | 16.7% | 228 | 33.3% | 42 | 77 | 95.1% |
| North Shore | $297,000 | -13.9% | 73 | -34.2% | 330 | 28.4% | 188 | 128 | 95.0% |
| Northeast Coconut Grove | $665,000 | 15.6% | 133 | -14.2% | 337 | 14.2% | 245 | 70 | 95.2% |
| Overtown | $129,000 | 9.3% | 6 | -40.0% | 17 | -29.2% | 12 | 33 | 98.9% |
| Palm Island | $8,760,000 | 121.5% | 2 | -33.3% | 21 | 61.5% | 4 | 477 | 87.7% |
| Palmetto Bay | $492,500 | 2.1% | 34 | -22.7% | 174 | 29.8% | 59 | 35 | 96.3% |
| Pinecrest | $1,187,500 | 43.9% | 18 | -21.7% | 229 | 39.6% | 47 | 52 | 94.3% |
| South Miami | $417,000 | -6.0% | 61 | 8.9% | 84 | 2.4% | 83 | 47 | 95.1% |
| South Point | $884,500 | 0.2% | 70 | 6.1% | 318 | 57.4% | 167 | 146 | 93.5% |
| Southwest Coconut Grove | $750,000 | 9.7% | 45 | 18.4% | 125 | 14.7% | 75 | 85 | 93.8% |
| Sunny Isles Beach | $460,000 | 22.7% | 45 | -43.8% | 1,201 | 46.3% | 137 | 111 | 93.7% |
| Sweetwater | $167,500 | -1.2% | 6 | 0.0% | 14 | -12.5% | 6 | 20 | 98.4% |
| The Roads | $469,950 | 0.5% | 32 | 33.3% | 48 | -23.8% | 70 | 49 | 93.0% |
| Upper Eastside | $446,000 | 20.7% | 64 | 0.0% | 233 | 100.9% | 132 | 72 | 94.4% |
| Venetian Islands | $640,000 | -22.4% | 21 | -8.7% | 83 | 22.1% | 34 | 160 | 91.1% |
| West Avenue | $292,000 | -8.2% | 69 | -41.0% | 306 | 15.0% | 152 | 99 | 94.2% |
| West Flagler | $250,000 | 12.8% | 64 | -24.7% | 92 | -17.1% | 94 | 40 | 99.1% |
| West Miami | $290,000 | 12.6% | 3 | -50.0% | 17 | 41.7% | 6 | 8 | 103.1% |
| Wynwood-Edgewater | $354,750 | -2.8% | 88 | -36.2% | 611 | 44.8% | 262 | 85 | 95.6% |
| Miami, FL | $255,000 | 4.1% | 1,269 | -17.2% | 7,839 | -1.8% | 2,186 | 52 | 96.8% |
NOTE: Not all neighborhoods are listed, but totals for Miami encompass the entire city. Data is based on listing information and might not reflect all real estate activity in the market. Neighborhood-specific data is measured over a three-month span that ended May 31. City-specific data is measured over a one-month span that also ended May 31.
For more information, contact Redfin journalist services:
Phone: 206-588-6863
Email: press@redfin.com
See Redfin’s data center to find out what’s happening in other cities.
To be added to Redfin’s press release distribution list, please click here.


