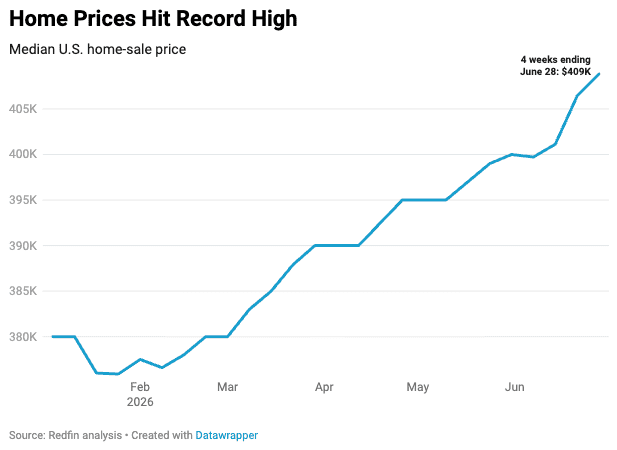
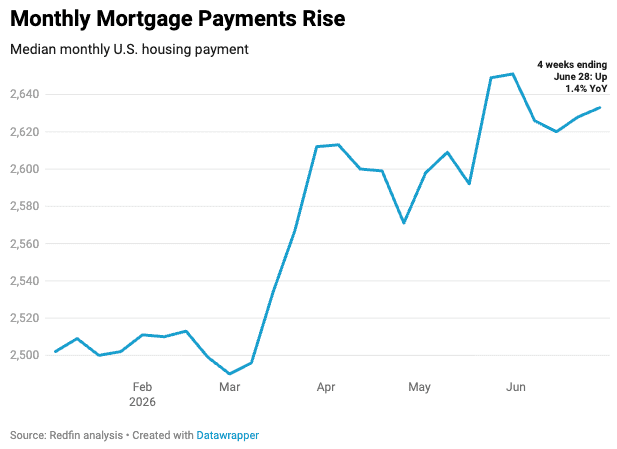
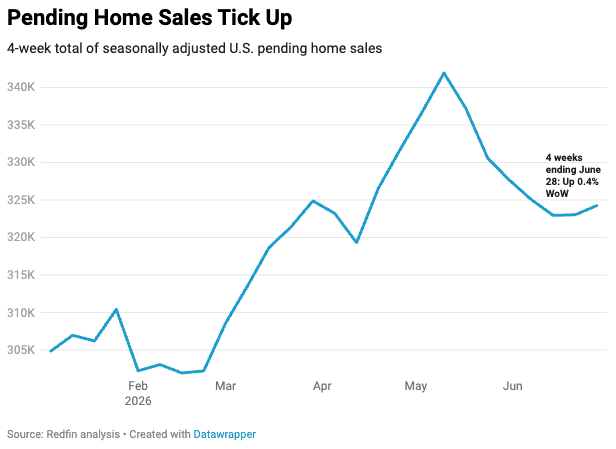
The median U.S. housing payment posted its first year-over-year increase since October during the four weeks ending June 28 as home prices and mortgage rates rose. Pending home sales crept up 0.4% week over week.
We’re taking a break from analysis this week, but please see the tables and charts below for this week’s housing-market data. Happy 4th of July weekend!
For Redfin economists’ takes on the housing market, please visit Redfin’s “From Our Economists” page.
Leading indicators
| Indicators of homebuying demand and activity | ||||
| Value (if applicable) | Recent change | Year-over-year change | Source | |
| Daily average 30-year fixed mortgage rate | 6.54% (June 30) | Down from 6.65% one week earlier | Down from 6.86% | Mortgage News Daily |
| Weekly average 30-year fixed mortgage rate | 6.49% (week ending June 25) | Up slightly from 6.47% one week earlier | Down from 6.77% | Freddie Mac |
| Mortgage-purchase applications (seasonally adjusted) | Up 1% from a week earlier (as of week ending June 26) | Up 3% | Mortgage Bankers Association | |
| Google searches of “homes for sale” | Up about 8% from a month earlier (as of June 29) | Up 8% | Google Trends | |
| Touring activity | Up 18% from the start of the year (as of June 29) | At this time last year, it was up 32% from the start of 2025 | ShowingTime | |
Key housing-market data
| U.S. highlights: Four weeks ending June 28, 2026
Redfin’s national metrics include data from 900+ U.S. metro areas and are based on homes listed and/or sold during the period. Weekly housing-market data goes back through 2021. Subject to revision. |
||||
| Four weeks ending June 28, 2026 | Year-over-year change | Week-over-week change (where applicable) | Notes | |
| Median sale price | $408,838 | 2.5% | Record high | |
| Median asking price (seasonally adjusted) | $404,414 | 3.7% | ||
| Median monthly mortgage payment (seasonally adjusted) | $2,633 at a 6.49% mortgage rate | 1.4% | ||
| Pending sales (seasonally adjusted) | 324,251 | 2% | 0.4% | |
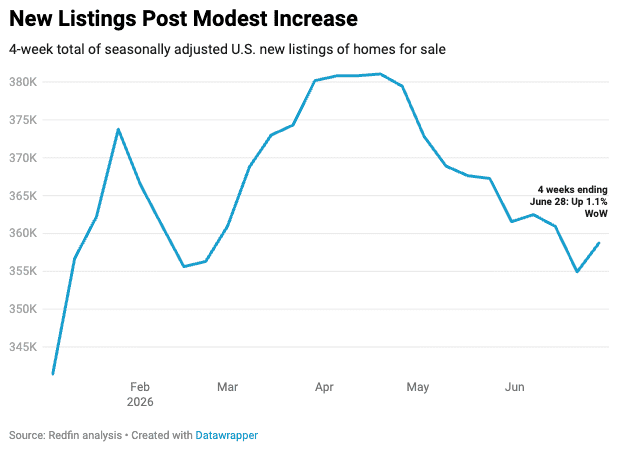
| New listings (seasonally adjusted) | 358,736 | 1.7% | 1.1% | |
| Active listings (seasonally adjusted) | 1,476,146 | -0.1% | -0.1% | |
| Months of supply | 3.5 | -0.2 pts. | 4 to 5 months of supply is considered balanced, with a lower number indicating seller’s market conditions | |
| Share of homes off market in two weeks | 35.8% | Essentially unchanged | ||
| Median days on market | 39 | +1 day | ||
| Share of home listings with price drops | 20.2% | Down from about 21% | ||
| Share of homes sold above list price | 28.8% | Essentially unchanged | ||
| Average sale-to-list price ratio | 99.1% | Essentially unchanged | ||
|
Metro-level highlights: Four weeks ending June 28, 2026 Redfin’s metro-level data includes the 50 most populous U.S. metros. Select metros may be excluded from time to time to ensure data accuracy. |
|||
|---|---|---|---|
| Metros with biggest year-over-year increases | Metros with biggest year-over-year decreases |
Notes |
|
| Median sale price | San Francisco (10.8%)
West Palm Beach, FL (10.6%) Pittsburgh (9.1%) Philadelphia (8.7%) Detroit (8.2%) |
Seattle (-5.3%)
San Jose, CA (-4%) Riverside, CA (-1.8%) Portland, OR (-1%) Dallas (-0.6%) |
Declined in 8 metros |
| Pending sales | San Francisco (17%)
Austin, TX (14.2%) West Palm Beach, FL (10.9%) Milwaukee (10.8%) Cincinnati (9.5%) |
Seattle (-14.7%)
Houston (-14%) Detroit (-11.3%) Warren, MI (-8.6%) Atlanta (-5.3%) |
|
| New listings | Philadelphia (15.7%)
Anaheim, CA (15.2%) St. Louis (12.4%) Pittsburgh (11.9%) Boston (11.4%) |
Dallas (-11.8%)
Fort Worth, TX (-8.2%) Jacksonville, FL (-7.3%) Atlanta (-5%) San Jose, CA (-4.2%) |
|
Refer to our metrics definition page for explanations of all the metrics used in this report.