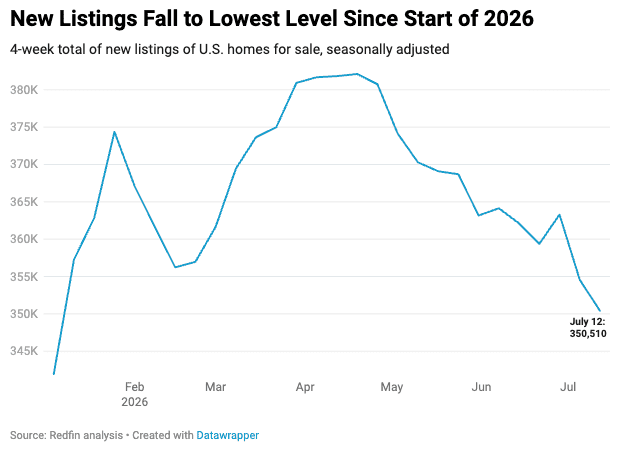
Would-be sellers backed off, too, with new listings falling to their lowest level since the start of 2026.
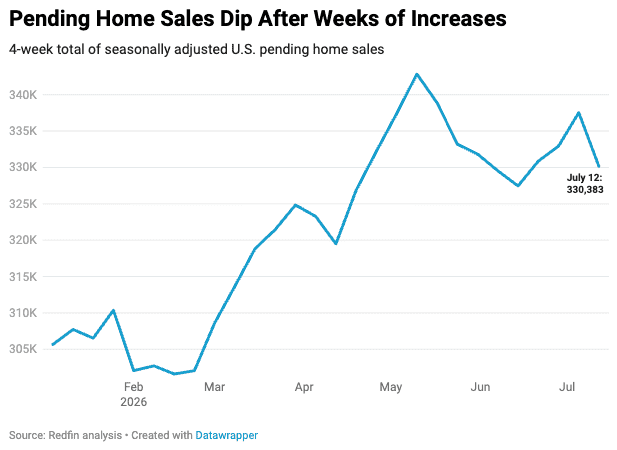
U.S. pending home sales fell 2.2% week over week during the four weeks ending July 12, the first decline in a month.
Some house hunters backed off due to stubbornly high housing costs. The weekly average mortgage rate rose back up to 6.49% after dipping to 6.43% the previous week, and the daily average rate shot up to its highest level in nearly a year. The median home-sale price was just about $800 shy of the all-time high. Another factor is the shaky global economy, which grew more uncertain last week as the U.S-Iran ceasefire ended and oil prices jumped. But note that the decline may also reflect normal week-to-week volatility rather than a major shift in demand.
On the selling side, new listings fell 1.2% week over week to their lowest level since the start of the year. While there are still hundreds of thousands more sellers than buyers in the market, fresh listings are sliding because some homeowners are opting to stay put rather than try to sell during a time of subdued demand.
“First-time buyers are having a tough time breaking into the market,” said Christine Kooiker, a Redfin Premier agent in Grand Rapids, MI. “High mortgage rates mean that even homes in the most affordable price point–under $350,000 in the Grand Rapids area–are a stretch for a lot of buyers, and they’re hard to find and competitive. A lot of move-up buyers are sitting on the sidelines, too, because they’re locked into low mortgage rates or can’t find a new home they love. High-income buyers and retirees who spend the summer in Michigan are most active, scooping up newly built single-family homes and luxury condos.”
For Redfin economists’ takes on the housing market, please visit Redfin’s “From Our Economists” page.
Leading indicators
| Indicators of homebuying demand and activity | ||||
| Value (if applicable) | Recent change | Year-over-year change | Source | |
| Daily average 30-year fixed mortgage rate | 6.64% (July 15) | Up from 6.6% one week earlier | Down from 6.83% | Mortgage News Daily |
| Weekly average 30-year fixed mortgage rate | 6.49% (week ending July 9) | Up from 6.43% one week earlier | Down from 6.72% | Freddie Mac |
| Mortgage-purchase applications (seasonally adjusted) | Down 7% from a week earlier (as of week ending July 10) | Down 2% | Mortgage Bankers Association | |
| Google searches of “homes for sale” | Up about 8% from a month earlier (as of July 11) | Down 3% | Google Trends | |
| Touring activity | Up 20% from the start of the year (as of July 11) | At this time last year, it was up 33% from the start of 2025 | ShowingTime | |
Key housing-market data
| U.S. highlights: Four weeks ending July 12, 2026
Redfin’s national metrics include data from 900+ U.S. metro areas and are based on homes listed and/or sold during the period. Weekly housing-market data goes back through 2021. Subject to revision. |
||||
| Four weeks ending July 12, 2026 | Year-over-year change | Week-over-week change (where applicable) | Notes | |
| Median sale price | $408,804 | 2.2% | About $800 shy of record high | |
| Median asking price (seasonally adjusted) | $402,533 | 2.7% | ||
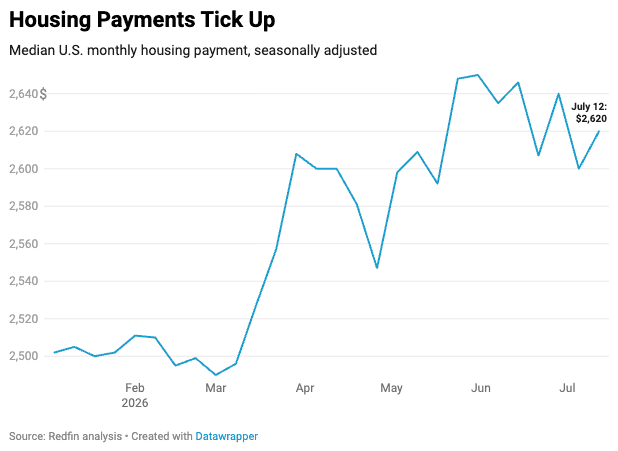
| Median monthly mortgage payment (seasonally adjusted) | $2,620 at a 6.49% mortgage rate | 0.8% | ||
| Pending sales (seasonally adjusted) | 330,383 | 4.6% | -2.2% | |
| New listings (seasonally adjusted) | 350,510 | 0.5% | -1.2% | |
| Active listings (seasonally adjusted) | 1,484,523 | 0.6% | -0.2% | |
| Months of supply | 3.4 | -0.2 pts. | 4 to 5 months of supply is considered balanced, with a lower number indicating seller’s market conditions | |
| Share of homes off market in two weeks | 32.7% | Essentially unchanged | ||
| Median days on market | 40 | +1 day | ||
| Share of home listings with price drops | 19.8% | Down from 21% | ||
| Share of homes sold above list price | 28.4% | Essentially unchanged | ||
| Average sale-to-list price ratio | 99.1% | Up slightly | ||
|
Metro-level highlights: Four weeks ending July 12, 2026 Redfin’s metro-level data includes the 50 most populous U.S. metros. Select metros may be excluded from time to time to ensure data accuracy. |
|||
|---|---|---|---|
|
Metros with biggest year-over-year increases |
Metros with biggest year-over-year decreases |
Notes |
|
| Median sale price |
West Palm Beach, FL (8.5%) San Francisco (7.2%) Philadelphia (7.2%) Baltimore (5.6%) Pittsburgh (5.3%) |
Seattle (-4%) San Jose, CA (-3.9%) Los Angeles (-0.3%) Indianapolis (-0.3%) Riverside, CA (-0.3%) Fort Worth, TX (-0.1%) |
Declined in 6 metros |
| Pending sales | Austin, TX (13.7%)
Boston (12.1%) Nassau County, NY (11.7%) New York (9.5%) West Palm Beach, FL (9.1%) |
Houston (-14.4%)
Seattle (-12.1%) Denver (-5.2%) Phoenix (-3.2%) Virginia Beach, VA (-2.4%) |
|
| New listings | Anaheim, CA (13.6%)
St. Louis (12.9%) Pittsburgh (9.8%) Cincinnati (9.6%) Austin, TX (9.5%) |
Fort Worth, TX (-11.6%)
Dallas (-10.8%) Miami (-8.9%) Atlanta (-8.3%) Charlotte, NC (-6.4%) |
|
Refer to our metrics definition page for explanations of all the metrics used in this report.