
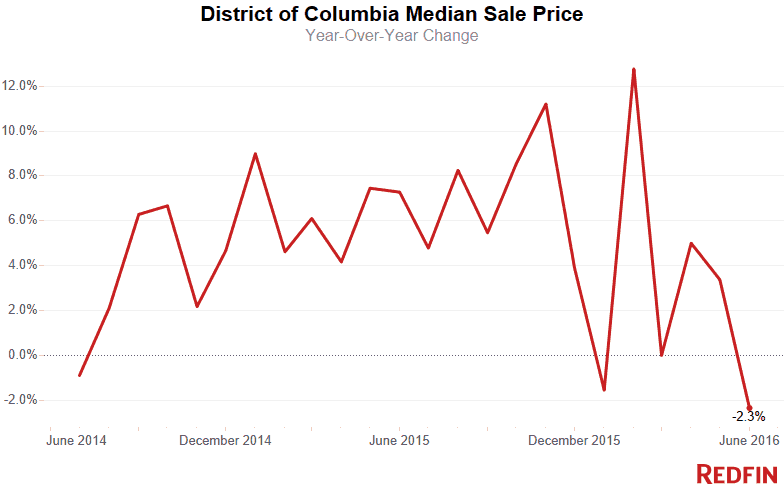
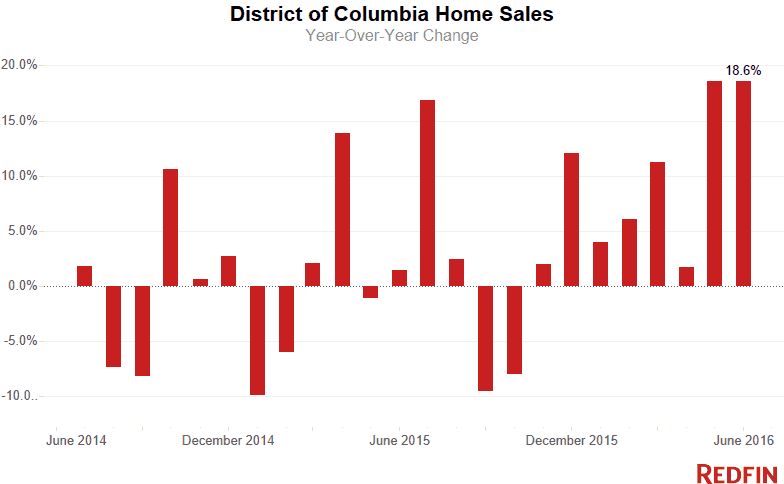
Washington, D.C. home prices fell 2.3 percent in June from a year earlier—the third time prices have fallen in the past two years. The typical home sold for $550,000 as home sales made an impressive 18.6 percent leap since last year.
In June, 1,058 homes were sold in The District.This is the largest number of home sales recorded in any month since Redfin began tracking data in January 2009.
The overall number of properties for sale in The District declined 5.1 percent since last June resulting in just 1.3 months of supply on the market—the lowest level on record since 2009.
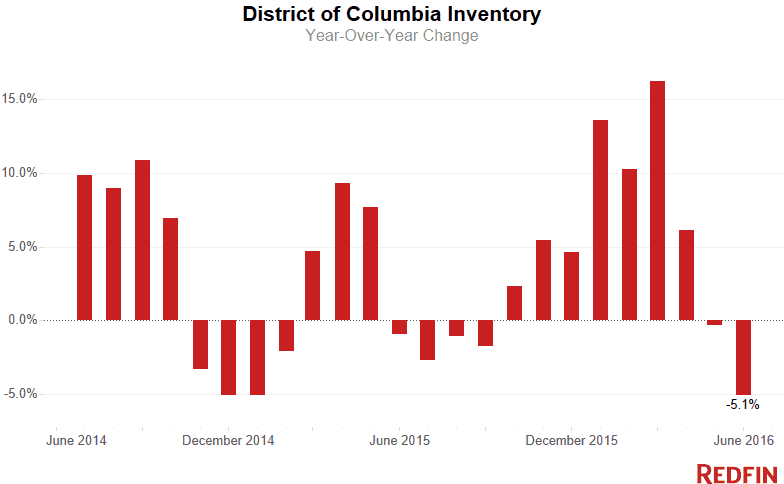
“I’d pay attention to the fact that sales were up and inventory was down,” Redfin real estate agent Dan Galloway said. “Buyers are still moving.”
“Buyers should take advantage of the remainder of the summer,” Galloway said. “The political class is out campaigning, which means the pool of buyers will be smaller and there will be less competition.”
What’s Happening in the D.C. Metro Region?
Across the broader D.C., Maryland and Virginia region, the median sale price grew 1.8 percent in June from last year, to $387,000. Home sales fell 12.8 percent year over year.
The number of homes listed in the region fell 2.5 percent, pushing the total number of properties for sale down by 18 percent from last year. The region had a 2.1-month supply of homes for sale.
The typical home found a buyer in 21 days. Buyers continued to pay more than the asking price on one in four homes.
Washington, D.C., Neighborhood Trends
One reason for the decline in D.C. home prices was a reversal in several neighborhoods that had strong price growth in May but either fell or softened in June. The median sale price in Mount Pleasant, which posted double-digit growth in May, fell 8.1 percent in June from last year. Prices also tumbled in Georgetown (-6.6%), Edgewood (-27.3%) and Adams Morgan (-10.7%) among others.
Despite the fact that prices have declined in Mount Pleasant, it remained one of the district’s hottest neighborhoods with the typical home selling in six days and for nearly 4 percent above the asking price.
Other hot ‘hoods were American University Park, Chevy Chase-DC, Petworth and Logan Circle-Shaw. In each of these neighborhoods the typical home sold in under 10 days and more than half of all the homes sold in June went for more than asking.
See our city page for the most up-to-date data on Washington-area home prices.
Here’s what’s happening in your neighborhood:
| Place | Median Sale Price | Year-Over-Year | Homes Sold | Year-Over-Year | Inventory | Year-Over-Year | New Listings | Median Days on Market | Avg Sale-to-List |
|---|---|---|---|---|---|---|---|---|---|
| 16th Street Heights | $660,000 | 4.7% | 49 | -15.5% | 30 | 0.0% | 90 | 10 | 99.2% |
| Adams Morgan / Kalorama Heights / Lanier Heights | $460,000 | -10.7% | 122 | -9.6% | 62 | -10.1% | 139 | 13 | 99.8% |
| Alexandria | $487,000 | 3.6% | 595 | -0.7% | 1,158 | -9.9% | 643 | 16 | 98.8% |
| American University Park / Friendship Heights / Tenleytown | $940,000 | -3.7% | 60 | 7.1% | 14 | -26.3% | 67 | 7 | 103.3% |
| Arlington | $623,500 | 9.4% | 344 | -2.6% | 657 | -11.2% | 361 | 14 | 99.5% |
| Atlas District | $700,000 | 0.0% | 85 | 49.1% | 31 | 0.0% | 84 | 15 | 99.8% |
| Bellevue / Congress Heights / Highlands | $188,500 | -24.4% | 38 | -5.0% | 34 | -24.4% | 42 | 46 | 97.3% |
| Benning Heights / Capitol View / Marshall Heights | $253,000 | 33.2% | 62 | 82.3% | 29 | -25.6% | 64 | 21 | 102.3% |
| Bethesda | $790,000 | -8.1% | 112 | -42.9% | 366 | 9.9% | 120 | 17 | 98.8% |
| Bloomingdale | $677,500 | -4.8% | 50 | 25.0% | 14 | -12.5% | 57 | 12 | 101.3% |
| Capitol Hill | $849,550 | 9.6% | 138 | 8.7% | 42 | -20.8% | 141 | 8 | 101.7% |
| Chevy Chase-DC | $1,010,000 | -3.1% | 54 | 10.2% | 29 | 3.6% | 78 | 7 | 102.0% |
| Chinatown / Mount Vernon Square / Penn Quarter | $523,500 | 11.6% | 110 | 4.8% | 44 | -35.3% | 99 | 18 | 99.4% |
| Cleveland Park | $435,000 | -31.6% | 39 | 50.0% | 15 | -46.4% | 42 | 20 | 100.5% |
| College Park | $266,000 | 2.3% | 21 | -32.3% | 22 | -45.0% | 24 | 21 | 101.0% |
| Columbia Heights | $570,000 | 2.2% | 160 | 40.4% | 65 | -1.5% | 148 | 12 | 100.4% |
| Congress Heights | $237,575 | -27.5% | 16 | 14.3% | 17 | -26.1% | 16 | 46 | 99.7% |
| Deanwood | $230,000 | 7.0% | 25 | 31.6% | 20 | 25.0% | 34 | 24 | 98.3% |
| Dupont Circle | $424,900 | 2.6% | 131 | 7.4% | 62 | 10.7% | 149 | 12 | 99.5% |
| Eckington | $609,000 | 6.8% | 36 | 71.4% | 21 | -8.7% | 42 | 11 | 99.1% |
| Edgewood | $465,000 | -27.3% | 35 | 150.0% | 13 | 0.0% | 41 | 10 | 104.1% |
| Fairlawn / Twining / Randle Highlands / Penn Branch | $319,500 | 16.2% | 48 | 29.7% | 33 | -29.8% | 56 | 31 | 99.5% |
| Foggy Bottom / George University / West End | $409,000 | -14.0% | 72 | -11.1% | 51 | -21.5% | 94 | 16 | 99.7% |
| Fort Totten / Lamont Riggs / Pleasant Hill / Queens Chapel | $430,000 | 1.5% | 51 | 15.9% | 11 | -50.0% | 41 | 15 | 99.4% |
| Foxhall / Palisades / Spring Valley / Wesley Heights | $1,451,125 | 20.9% | 70 | 0.0% | 61 | -6.2% | 103 | 10 | 98.9% |
| Georgetown | $1,035,000 | -6.6% | 80 | 21.2% | 76 | 26.7% | 120 | 16 | 97.8% |
| Glover Park / Cathedral Heights / McLean Gardens | $481,500 | 14.0% | 136 | 9.7% | 99 | 25.3% | 164 | 22 | 98.4% |
| Greenway / Benning / Dupont Park / River Terrace | $283,000 | 39.8% | 19 | 18.8% | 13 | -40.9% | 34 | 29 | 98.0% |
| Hill East | $725,000 | 6.8% | 77 | 4.0% | 19 | -36.7% | 83 | 11 | 101.2% |
| Historic Anacostia | $285,000 | 11.8% | 19 | 171.4% | 7 | -12.5% | 14 | 21 | 100.2% |
| Howard University / Le Droit Park | $700,000 | 18.1% | 73 | -8.8% | 35 | 12.9% | 88 | 9 | 101.3% |
| Kingman Park | $490,000 | 10.4% | 53 | 20.4% | 19 | -13.6% | 54 | 18 | 100.4% |
| Logan Circle-Shaw | $674,900 | 4.6% | 107 | 11.5% | 46 | 39.4% | 137 | 8 | 102.3% |
| Logan Circle-Shaw | $686,000 | 6.4% | 123 | 9.8% | 53 | 32.5% | 154 | 8 | 102.1% |
| Massachusetts Avenue Heights | $699,500 | 89.1% | 51 | 45.7% | 31 | -6.1% | 59 | 19 | 98.5% |
| Mount Pleasant | $719,500 | -8.1% | 38 | 35.7% | 7 | 16.7% | 49 | 6 | 103.8% |
| Navy Yard | $468,000 | -19.0% | 15 | -16.7% | 6 | 50.0% | 17 | 14 | 99.7% |
| NoMa | $715,000 | 1.4% | 47 | 67.9% | 13 | -18.8% | 28 | 14 | 98.3% |
| Petworth | $660,000 | 9.1% | 83 | -2.4% | 40 | 14.3% | 115 | 7 | 100.8% |
| Pleasant Plains | $640,000 | 18.5% | 36 | -7.7% | 10 | -9.1% | 32 | 14 | 102.3% |
| Rockville | $455,500 | -14.5% | 178 | -50.6% | 439 | -23.4% | 195 | 14 | 99.1% |
| Silver Spring | $359,500 | -6.6% | 276 | -50.2% | 580 | -26.4% | 295 | 20 | 99.5% |
| Southwest / Waterfront | $319,950 | -1.2% | 58 | -10.8% | 24 | 26.3% | 65 | 12 | 99.5% |
| Stanton Park | $675,000 | -7.4% | 128 | 42.2% | 45 | -6.2% | 141 | 8 | 101.3% |
| Takoma | $495,000 | 8.2% | 17 | 112.5% | 1 | -66.7% | 13 | 11 | 101.3% |
| Trinidad / Arboretum / Ivy City | $440,000 | 4.4% | 59 | -3.3% | 51 | 54.5% | 76 | 40 | 99.4% |
| Truxton Circle | $722,450 | 10.9% | 16 | 0.0% | 7 | 0.0% | 17 | 65 | 100.8% |
| Union Station / Kingman Park / Stanton Park | $630,000 | 0.5% | 195 | 37.3% | 75 | 4.2% | 204 | 11 | 100.8% |
| Van Ness / Forest Hills / Wakefield | $502,500 | -7.6% | 42 | 0.0% | 29 | 31.8% | 53 | 20 | 99.2% |
| Woodley Park | $540,000 | 2.3% | 25 | 38.9% | 11 | 22.2% | 30 | 11 | 100.7% |
| Woodridge | $525,000 | NA | 1 | NA | NA | NA | NA | 278 | 100.0% |
| Woodridge-Fort Lincoln | $494,000 | 7.9% | 34 | 41.7% | 12 | -14.3% | 26 | 25 | 100.0% |
| Washington, DC | $550,000 | -2.3% | 1,058 | 18.6% | 1,368 | -5.1% | 988 | 13 | 100.2% |
NOTE: Not all neighborhoods are listed, but totals for Washington, D.C., encompass entire city. Data is based on listing information and might not reflect all real estate activity in the market. Neighborhood-specific data is measured over the three months ended June 30. Inventory measures listings active as of June 30.
For more information, contact Redfin journalist services:
Phone: 206-588-6863
Email: press@redfin.com
See Redfin’s data center to find out what’s happening in other cities.
To be added to Redfin’s press release distribution list, subscribe here.


