
In the first three months of 2018, Denver posted a “net outflow” of Redfin users for the first time, meaning that more Denver-based Redfin users were searching for homes in other metro areas than Redfin users elsewhere looking to move in. Of all Denverites using Redfin, 20 percent were searching for homes in another metro, up from 15 percent during the same time period a year earlier. Nationally, 23.9 percent of Redfin.com users looked to relocate to another metro area last quarter, up from 19.8 percent a year earlier.
Seattle, which is grappling with a controversial tax related to the city’s housing crisis, has seen two consecutive quarters of net outflow, based on Redfin user data. In the first quarter, 12 percent of Seattle-based Redfin users were looking in other metro areas, up from 9 percent during the same period last year.
Home searches are a forward-looking indicator of what is likely to happen to a city’s population. We saw this in 2015 in the Bay Area, when more Bay Area Redfin users were searching elsewhere. By 2016, the U.S. Census Bureau showed San Francisco had lost residents. Now we see signs that Denver and Seattle, cities that once attracted those fleeing high home prices, are becoming unaffordable as well.
Moving Out – Metros with the Highest Net Outflow of Redfin Users:
| Table: Top 10 Metros by Net Outflow of Users and Their Top Destinations | |||||||
| Rank | Metro* | Net Outflow:† Q1 2018 | Q1 2017 | Portion of Local Users Searching Elsewhere | Top Destination | Top Out-of-State Destination | |
|---|---|---|---|---|---|---|---|
| 1 | San Francisco, CA | 15,137 | 15,028 | 20.7% | Sacramento, CA | Seattle, WA | |
| 2 | New York, NY | 11,707 | 7,106 | 33.9% | Boston, MA | Boston, MA | |
| 3 | Los Angeles, CA | 7,189 | 5,328 | 15.3% | San Diego, CA | Las Vegas, NV | |
| 4 | Washington, DC | 4,209 | 3,999 | 10.9% | Philadelphia, PA | Philadelphia, PA | |
| 5 | Seattle, WA | 2,270 | -1,203 | 12.3% | Los Angeles, CA | Los Angeles, CA | |
| 6 | Chicago, IL | 2,023 | 2,617 | 9.3% | Phoenix, AZ | Phoenix, AZ | |
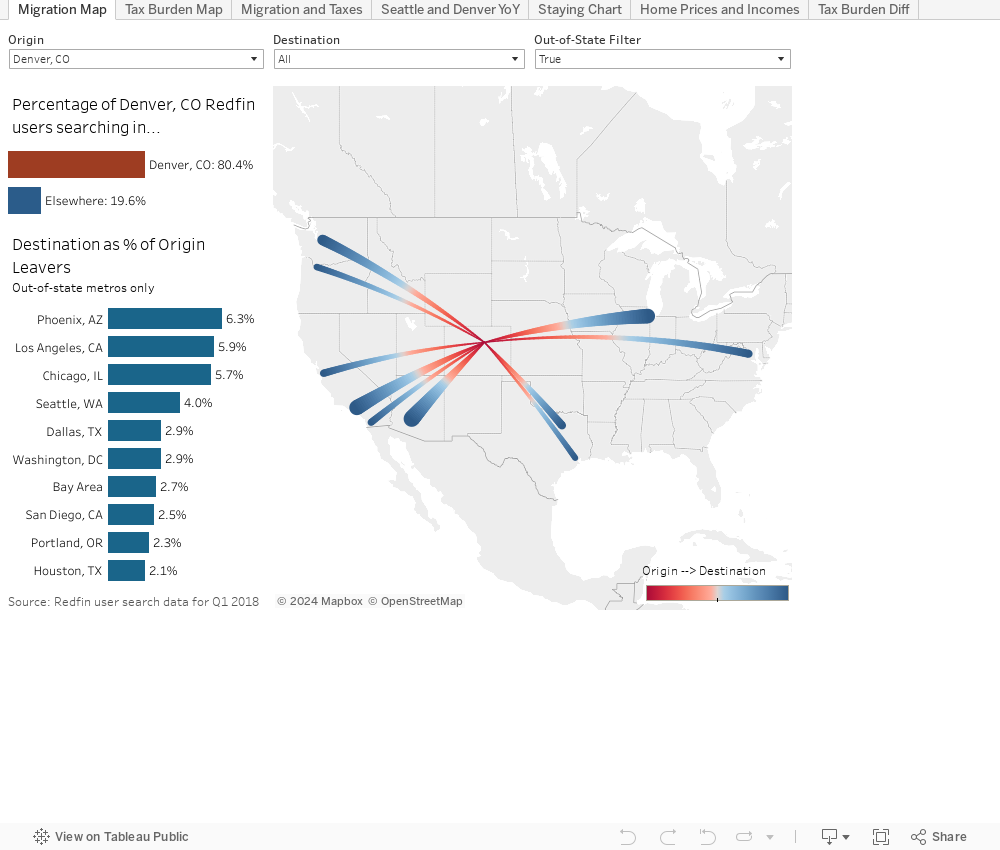
| 7 | Denver, CO | 309 | -424 | 19.6% | Colorado Springs, CO | Phoenix, AZ | |
| 8 | Houston, TX | 297 | 816 | 26.1% | Austin, TX | Chicago, IL | |
| 9 | Eugene, OR | 245 | -97 | 45.6% | Portland, OR | Seattle, WA | |
| 10 | Detroit, MI | 131 | -75 | 25.9% | Chicago, IL | Chicago, IL | |
| *Combined statistical areas with at least 500 users in Q1 2018 †Negative values indicate a net inflow; among the one million users sampled for this analysis only |
|||||||
Census data shows that Denver peaked at 40,000 net domestic migrations in 2015, meaning that many more people moved to Denver than left. Since then, while still positive, the net migration has declined each year. Looking ahead, based on Redfin user search trends, we expect Denver to see a negative net migration, or a loss of residents, in the 2019 Census.
Meanwhile in Seattle, the Census data reveal peak net domestic migration in 2016, a year later than Denver, and the decline in 2017 was less dramatic. Redfin search data, however, shows users increasingly looking to leave the Seattle area. Since October 2017, more Seattleites are looking at homes elsewhere than the other way around.

Where are they going?
Residents looking to leave Seattle and Denver last quarter were mostly looking in areas that were more affordable and less competitive. Los Angeles looks like an exception on the surface, because the metro area on average is more expensive than Denver and Seattle. However, when we looked at the county level, we saw that the most common areas homebuyers were looking at were more affordable areas of the LA market, like the Inland Empire (Riverside County, CA).
Phoenix was a top destination for both Seattle and Denver last quarter, and had the largest net gain of Redfin users looking to move to the area from elsewhere. This was up significantly—34 percent—from a year ago. Phoenix is also much more affordable, with a median home sale price of $257,000 as of April, compared to $415,000 in Denver and $580,000 in Seattle.
The rate of home-price growth in Denver and Seattle is staggering, with Denver up 64 percent and Seattle up 76 percent over the last five years—more than double the national growth rate of 37 percent. They also both consistently hold the top spots for the fastest housing market, in terms of how long homes stay on the market. These competitive forces serve as a likely cause for the uptick in out-migration.
Major cities in Texas, as well as Chicago and Portland are also attractive to those leaving Seattle and Denver. This has resulted in a disbursement of wealth throughout the country to cities that have made it easier to build new housing.

Which Cities Will be Next?
Below are the 10 metros that are the most likely to receive big inflows of new residents in the next year from expensive coastal markets, based on the number of users looking to relocate there versus leave. With these new residents, economic growth and rising home prices will likely follow, as we saw in Seattle and Denver.
Moving In – Metros with the Highest Net Inflow of Redfin Users:
| Table: Top 10 Metros by Net Inflow of Users and Their Top Origins | ||||||
| Rank | Metro* | Net Inflow:† Q1 2018 | Q1 2017 | Portion of Searches from Users Outside the Metro | Top Origin | Top Out-of-State Origin |
|---|---|---|---|---|---|---|
| 1 | Phoenix, AZ | 4,117 | 2,744 | 33.6% | Los Angeles, CA | Los Angeles, CA |
| 2 | Sacramento, CA | 3,169 | 4,089 | 39.5% | San Francisco, CA | Seattle, WA |
| 3 | Las Vegas, NV | 2,925 | 2,476 | 43.6% | Los Angeles, CA | Los Angeles, CA |
| 4 | Atlanta, GA | 2,713 | 1,506 | 26.3% | New York, NY | New York, NY |
| 5 | Miami, FL | 2,295 | 1,202 | 27.7% | New York, NY | New York, NY |
| 6 | Austin, TX | 1,807 | 1,189 | 26.7% | San Francisco, CA | San Francisco, CA |
| 7 | Dallas, TX | 1,556 | 2,071 | 23.0% | Los Angeles, CA | Los Angeles, CA |
| 8 | Portland, OR | 1,511 | 1,556 | 17.4% | San Francisco, CA | San Francisco, CA |
| 9 | Tampa, FL | 1,187 | 878 | 43.9% | Washington, DC | Washington, DC |
| 10 | San Diego, CA | 1,159 | 1,109 | 24.3% | Los Angeles, CA | Seattle, WA |
| *Combined statistical areas with at least 500 users in Q2 2018 †Negative values indicate a net outflow; among the one million users sampled for this analysis only |
||||||
The new destinations will be at risk for becoming unaffordable over time as well, unless they build enough new homes to keep up with the influx of people. Cities like Las Vegas, Atlanta and Austin are building thousands of new housing units to accommodate this growth.
Meanwhile Sacramento, Portland and San Diego are good examples of markets experiencing early signs of slowing growth, with smaller net inflows of Redfin users in the first quarter of this year than in the same time period in 2017. These metro areas have not expanded housing as rapidly to dampen growth in housing costs.
Below are charts showing the top origins of people migrating to these cities.

Find Your City
Below is an interactive tool to see where people are looking to move and where people are coming from for 80 U.S. metros. Find the city you’re interest in by clicking on the drop down menu:
Methodology
Redfin analyzed a sample of more than 1 million Redfin.com users searching for homes across 75 metro areas from January through March. Users must have viewed at least 10 listings during the quarter. We also excluded locations that in aggregate represented less than 20 percent of a user’s searches. We determined the home metro by mapping the user’s IP address of the most common location they searched from. If a user was searching in more than one metro, we accounted for the share of searches in each metro. Combined Statistical Areas (as defined here) must have had at least 500 users either searching from or in that metro during the first quarter.
It’s worth noting that net inflow and outflow data does not account for Redfin’s market share or the population of metro areas. In metros where Redfin has a larger number of website visitors, we may have a higher volume of inbound and outbound searches than in metros that are smaller or where Redfin has a smaller user base. The U.S. Census Bureau measures net migration flows, which is a common practice when analyzing migratory patterns.


