
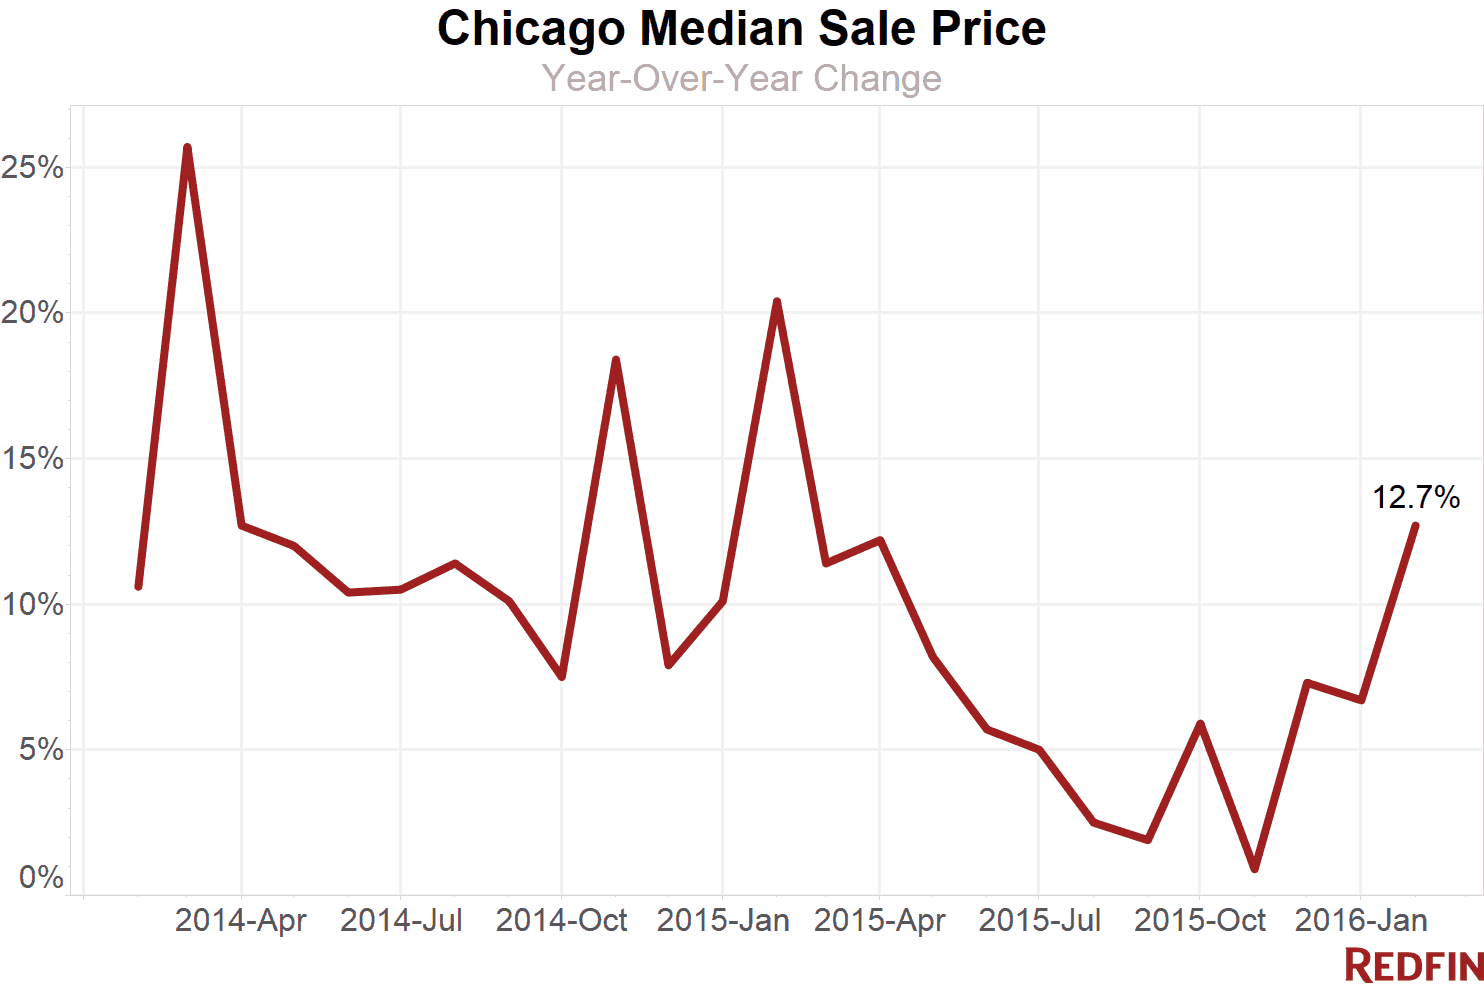
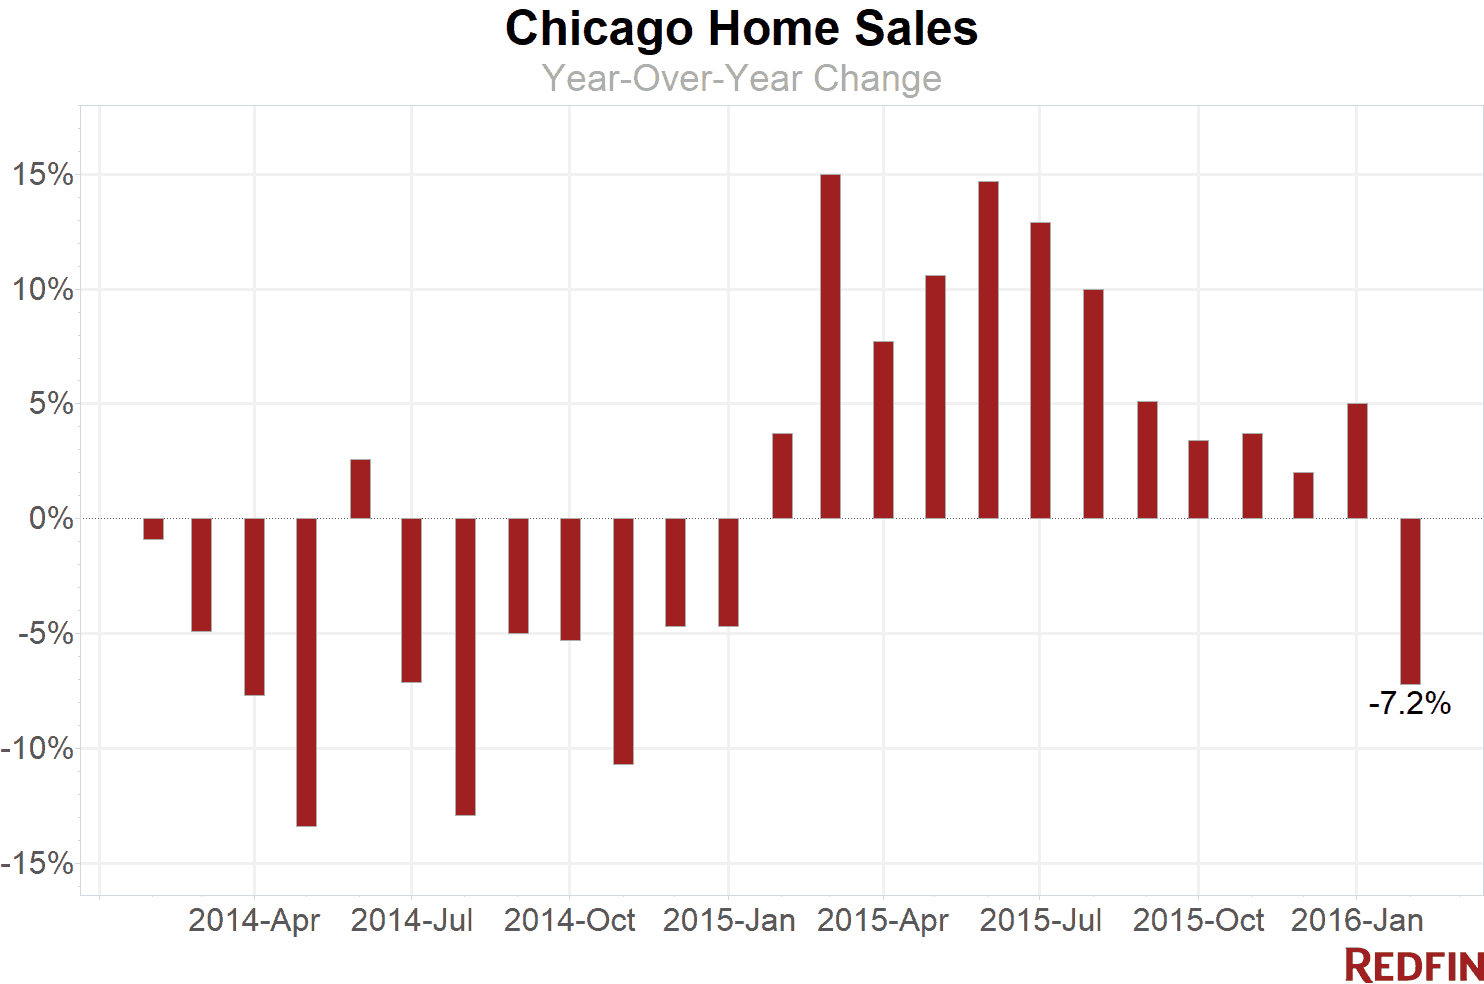
Chicago home prices were up 12.7 percent in February compared to a year earlier, with the typical home selling for $225,000. Sales dropped for the first time in more than a year, falling 7.2 percent.
After a seven-month drought of inventory, the city finally saw an increase in the number of homes for sale. Inventory rose 7.8 percent year over year and new listings shot up 10.2 percent. The typical home sold in 39 days in February, five days faster than a year earlier, and more than one in five sellers got more than their asking price.
So far, sellers are benefiting from high prices and low inventory. However, with more homes coming on the market in February, buyers are gaining a greater selection, a dynamic that might drive sales higher this spring.
February saw a 5.4-month supply of houses for sale, a volume the city hasn’t seen since 2012, but less than the six months that represents a market balanced between buyers and sellers. Even though more houses are going up for sale, they’re finding buyers quickly and sellers still have the upper hand.
“Three of the five condos I recently listed in the West Loop and South Loop resulted in bidding wars,” said Redfin real estate agent Jacqueline Colando. “That’s pretty representative of the area. Since those neighborhoods consist mostly of condos, many of my selling clients are moving to the suburbs to get more space for their dollar.”
Hot Neighborhoods
Ukrainian Village, named 2016’s Hottest Neighborhood, had the highest median sale price in the city at $534,000. Wicker Park, directly to the north, was the second-most expensive neighborhood in the city, with a typical home selling for $517,500. North Center, Streeterville and Bucktown rounded out the top five.
Tri-Taylor retained its long-standing dominance in price appreciation, posting a 92 percent increase year over year, due largely to increased development in the area. A typical Tri-Taylor home sold for $338,500. Pullman (66%), Little Village (56%) and Edgewater (54%) all saw price gains of 50 percent or more.
Homes sold fastest in the West Loop and Andersonville, finding buyers in only 14 days. On the other end of the spectrum, a typical home in Hyde Park sat on the market for 83 days, the longest in the city.
“Many of the condos in Hyde Park have very high association dues, sometimes as much as $1500 per month, since the buildings are nearly 100 years old and need constant upkeep,” said Redfin agent Lamar Austin. “And the single-family homes in the neighborhood are mostly older mansions, still large, expensive to maintain and priced over a million dollars. In either situation, it takes a little longer to find a buyer.”
The slower market time didn’t seem to hurt pricing, though. Hyde Park homes appreciated 10 percent from last year, with a typical home selling for $183,250.
See our city page for the most up-to-date data on Chicago home prices.
Here’s what’s happening in your neighborhood:
| Neighborhood | Median Sale Price | Year-Over-Year | Homes Sold | Year-Over-Year | Inventory | Year-Over-Year | New Listings | Median Days on Market | Avg Sale-to-List |
|---|---|---|---|---|---|---|---|---|---|
| Albany Park | $245,000 | 13.4% | 84 | 13.5% | 117 | 17.0% | 133 | 48 | 97.4% |
| Andersonville | $406,000 | -6.1% | 33 | 94.1% | 45 | 4.7% | 53 | 14 | 97.2% |
| Archer Heights | $170,000 | -3.1% | 25 | 25.0% | 21 | 50.0% | 15 | 28 | 96.6% |
| Austin | $88,250 | 11.0% | 116 | 0.0% | 136 | -1.4% | 171 | 28 | 101.2% |
| Avondale | $287,000 | -9.7% | 65 | -31.6% | 86 | 11.7% | 106 | 27 | 98.2% |
| Beverly | $236,000 | 2.7% | 57 | 54.1% | 94 | 40.3% | 88 | 28 | 97.4% |
| Bridgeport | $351,500 | 32.6% | 46 | -9.8% | 68 | 36.0% | 61 | 32 | 96.8% |
| Brighton Park | $147,100 | 13.2% | 42 | -17.6% | 44 | 15.8% | 57 | 26 | 97.4% |
| Bucktown | $486,250 | -2.1% | 78 | 20.0% | 66 | 8.2% | 99 | 26 | 97.4% |
| Clearing | $181,750 | 25.3% | 60 | 0.0% | 62 | -11.4% | 81 | 30 | 96.4% |
| Edgewater | $230,125 | 53.7% | 156 | 8.3% | 216 | -6.5% | 236 | 42 | 96.1% |
| Edison Park | $260,000 | -15.2% | 25 | -16.7% | 45 | 12.5% | 36 | 42 | 94.7% |
| Englewood | $20,000 | -11.1% | 51 | -1.9% | 153 | -9.5% | 150 | 47 | 98.1% |
| Garfield Ridge | $172,000 | 1.2% | 83 | 0.0% | 115 | 51.3% | 127 | 29 | 98.0% |
| Gold Coast | $390,000 | 40.2% | 103 | 7.3% | 205 | -0.5% | 186 | 34 | 94.5% |
| Humboldt Park | $181,500 | -11.5% | 120 | 0.0% | 147 | 8.1% | 197 | 25 | 101.8% |
| Hyde Park | $183,250 | 10.4% | 59 | 63.9% | 73 | -31.1% | 60 | 83 | 94.7% |
| Irving Park | $273,500 | 7.3% | 120 | 29.0% | 171 | 17.1% | 195 | 50 | 97.3% |
| Jefferson Park | $245,000 | 7.7% | 61 | 3.4% | 79 | 21.5% | 100 | 41 | 96.1% |
| Kenwood | $192,500 | 13.6% | 36 | 28.6% | 55 | -17.9% | 61 | 58 | 96.3% |
| Lakeview | $362,000 | -3.5% | 322 | 2.2% | 588 | 13.5% | 691 | 36 | 97.1% |
| Lincoln Park | $453,858 | 5.5% | 124 | 6.0% | 178 | 17.1% | 196 | 31 | 95.9% |
| Lincoln Square | $317,000 | -9.4% | 23 | -37.8% | 87 | 52.6% | 95 | 50 | 96.4% |
| Logan Square | $396,000 | 21.8% | 135 | 16.4% | 151 | 65.9% | 224 | 16 | 98.2% |
| McKinley Park | $190,000 | 40.7% | 29 | 52.6% | 22 | 29.4% | 34 | 21 | 99.5% |
| Montclare | $200,000 | 17.6% | 27 | -18.2% | 28 | -24.3% | 32 | 36 | 97.7% |
| Mount Greenwood | $199,222 | 8.9% | 25 | -41.9% | 70 | 62.8% | 73 | 35 | 97.7% |
| Near North Side | $402,500 | 0.6% | 471 | 1.1% | 839 | 10.4% | 887 | 47 | 96.6% |
| North Center | $512,500 | 22.3% | 36 | -26.5% | 80 | 14.3% | 99 | 26 | 96.3% |
| Old Town | $377,500 | 15.8% | 64 | 20.8% | 82 | 13.9% | 102 | 36 | 95.6% |
| Portage Park | $260,000 | 2.0% | 133 | 6.4% | 131 | 4.0% | 174 | 29 | 96.8% |
| Pullman | $74,750 | 66.1% | 12 | -7.7% | 17 | -10.5% | 20 | 32 | 94.9% |
| Ravenswood | $304,000 | -23.0% | 51 | 6.3% | 72 | 24.1% | 94 | 35 | 98.0% |
| Rogers Park | $146,000 | -4.3% | 98 | 14.0% | 163 | 14.8% | 164 | 37 | 96.9% |
| Roscoe Village | $462,500 | -1.6% | 54 | -11.5% | 116 | 54.7% | 158 | 16 | 97.2% |
| Sauganash | $310,000 | -11.9% | 25 | 92.3% | 37 | 12.1% | 51 | 61 | 94.1% |
| South Lawndale / Little Village | $109,000 | 55.7% | 33 | -10.8% | 44 | -4.3% | 54 | 27 | 99.8% |
| South Loop | $338,000 | 1.8% | 204 | 15.3% | 265 | 13.7% | 366 | 37 | 99.6% |
| South Shore | $61,999 | 24.0% | 65 | -27.8% | 124 | -9.5% | 135 | 68 | 96.4% |
| Streeterville | $490,000 | 10.1% | 126 | 2.4% | 236 | -5.6% | 230 | 63 | 95.8% |
| The Loop | $327,000 | -10.3% | 110 | -6.8% | 197 | 11.3% | 220 | 39 | 98.7% |
| Tri-taylor | $338,500 | 92.1% | 11 | -8.3% | 9 | -43.8% | 12 | 71 | 98.2% |
| Ukrainian Village | $534,000 | 6.8% | 18 | -14.3% | 39 | 25.8% | 47 | 22 | 97.7% |
| Uptown | $237,500 | 17.6% | 112 | -12.5% | 194 | -3.5% | 235 | 32 | 96.5% |
| West Loop | $365,000 | 1.4% | 108 | -18.8% | 124 | 44.2% | 183 | 14 | 100.2% |
| West Town | $455,000 | 4.6% | 278 | -0.4% | 356 | 31.9% | 521 | 20 | 98.6% |
| Wicker Park | $517,500 | 10.0% | 72 | -4.0% | 81 | 37.3% | 119 | 22 | 98.3% |
| Chicago, IL | $225,000 | 12.7% | 1,645 | -7.2% | 8,801 | 7.8% | 4,603 | 39 | 98.1% |
NOTE: Not all neighborhoods are listed, but totals for Chicago encompass entire city. Data is based on listing information and might not reflect all real estate activity in the market. Neighborhood-specific data is measured over a three-month span that ended Feb. 29. Inventory measures listings active as of Feb. 29.
For more information, contact Redfin journalist services
Phone: 206-588-6863
Email: press@redfin.com
See Redfin’s data center to find out what’s happening in other cities.
To be added to Redfin’s press release distribution list, subscribe here.


