
Today’s new construction homes become tomorrow’s housing market. Without affordable new construction, we find ourselves in a housing market marked by low inventory, high prices and bidding wars—and one where first-time homebuyers are often priced out.
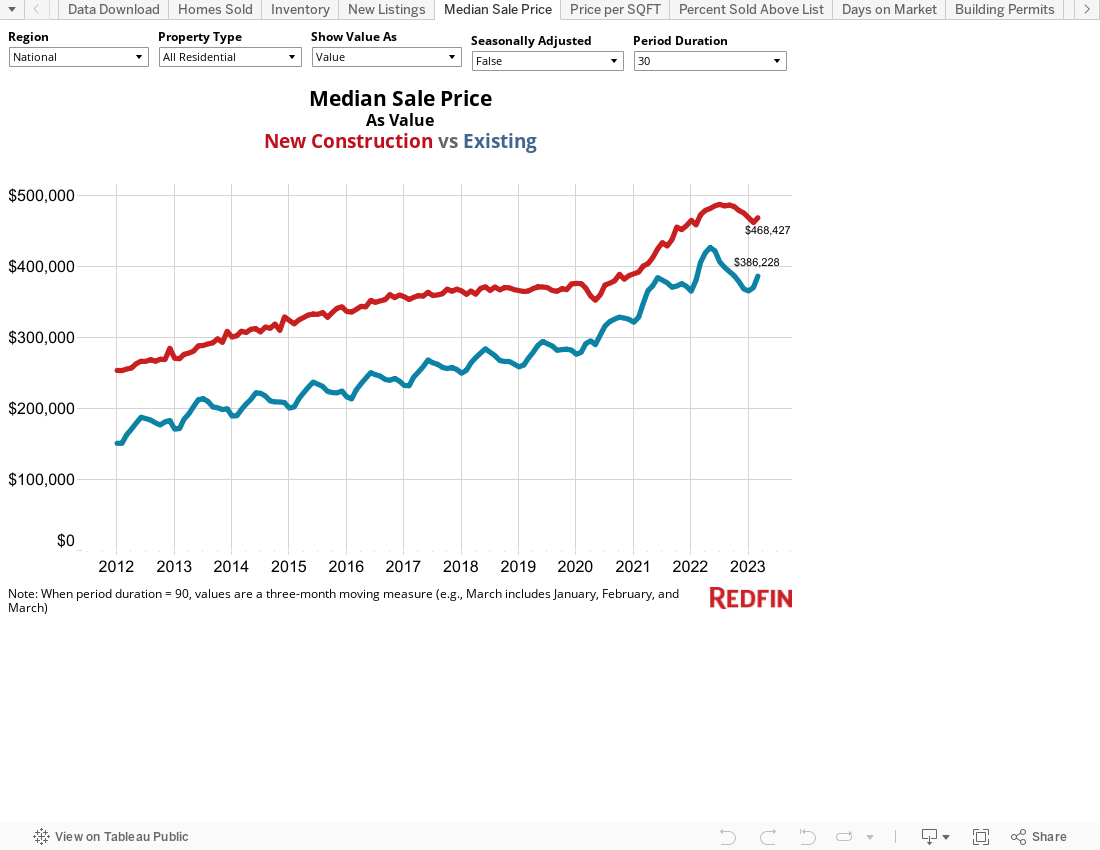
The average price of a new construction home that sold in the three months through September1 was $374,000. Compared with existing homes, new construction homes sold at an average premium in September of $87,000.2
However, new home price growth has slowed throughout this year. New home prices are up 3.3 percent year over year, which is down from a growth rate of 5.3 percent in January. In contrast, existing home prices grew by 7.9 percent in September compared with 6.6 percent price growth in January.
The national average cost to a builder constructing a new home—which includes the estimated cost of labor plus materials—surpassed $200,000, or $240,000 for single-family units, in August this year, which is the highest since the Census began reporting it in 1988.3
Construction costs are rising in part because the availability of construction workers is still 25 percent below the peak in 2006 and there is also less competition among homebuilders.
“After almost a decade of underproduction, we are finally seeing a slow steady increase in single-family housing starts, up 9 percent from a year ago,” said Redfin chief economist Nela Richardson. “But high building costs are limiting the construction of homes that today’s buyers can afford. This is why even in the midst of extreme inventory shortages for existing homes, new homes are sitting on the market instead of selling.”
The labor shortage has been made worse by the recent hurricanes, though builders’ confidence has rebounded after a small dip in September. Renters in the rental market have suffered though as potential first-time buyers are priced out and continue to rent—rental vacancy rates hit a 31-year low last year.
Housing material costs have also been rising, with lumber prices recently hitting their highest level on record since January 2003. Prices will likely rise further as a new tax on Canadian lumber of up to 24 percent has been imposed by the Trump Administration.
If You Build It They Will Come
New homes represent a growing share of the market over the past five years—rising from one in 13 homes for sale in September 2012 to one in eight homes in September 2017. With high prices though, the growing share of new construction homes is worsening the housing affordability crisis as starter homes have disappeared.
“We would love to build more affordable starter homes, but when high-end homes cost the same to build and are far more profitable, we lose the incentive to build smaller units,” said Isaac Stocks of Azure Northwest Homes, a Seattle-area home builder.
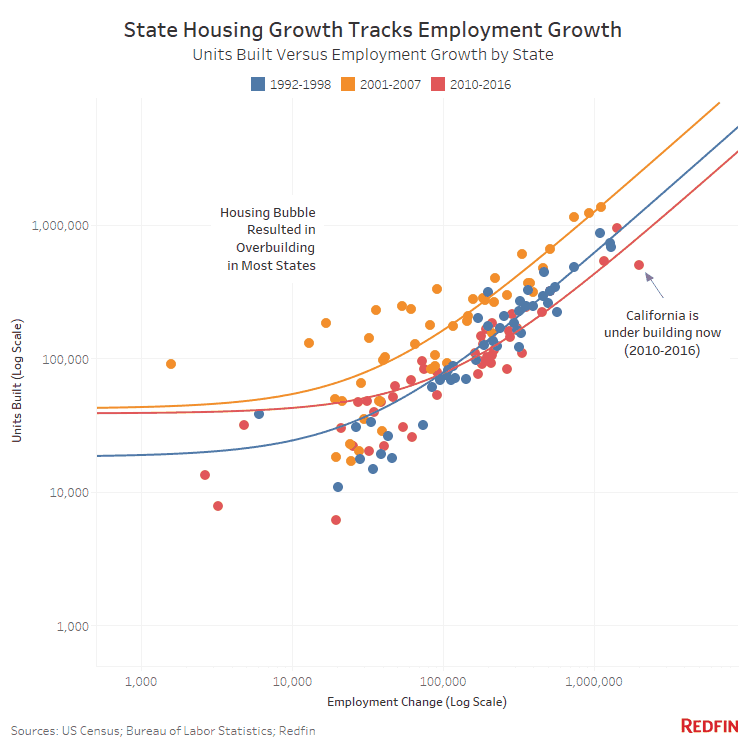
California—the state most emblematic of the nation’s housing affordability crisis—has built the fewest number of apartments and for-sale units per new resident of all states between 2010 and 2016, with just one unit for every four new residents.4 This has resulted in a large number of California residents moving to other states.
Other states, by contrast, average more than double that at one new unit for every 1.8 new residents during this period, which is still lower than the 1.6 average of the 1990s (the housing boom of the 2000s averaged one new unit for every 1.4 new residents).
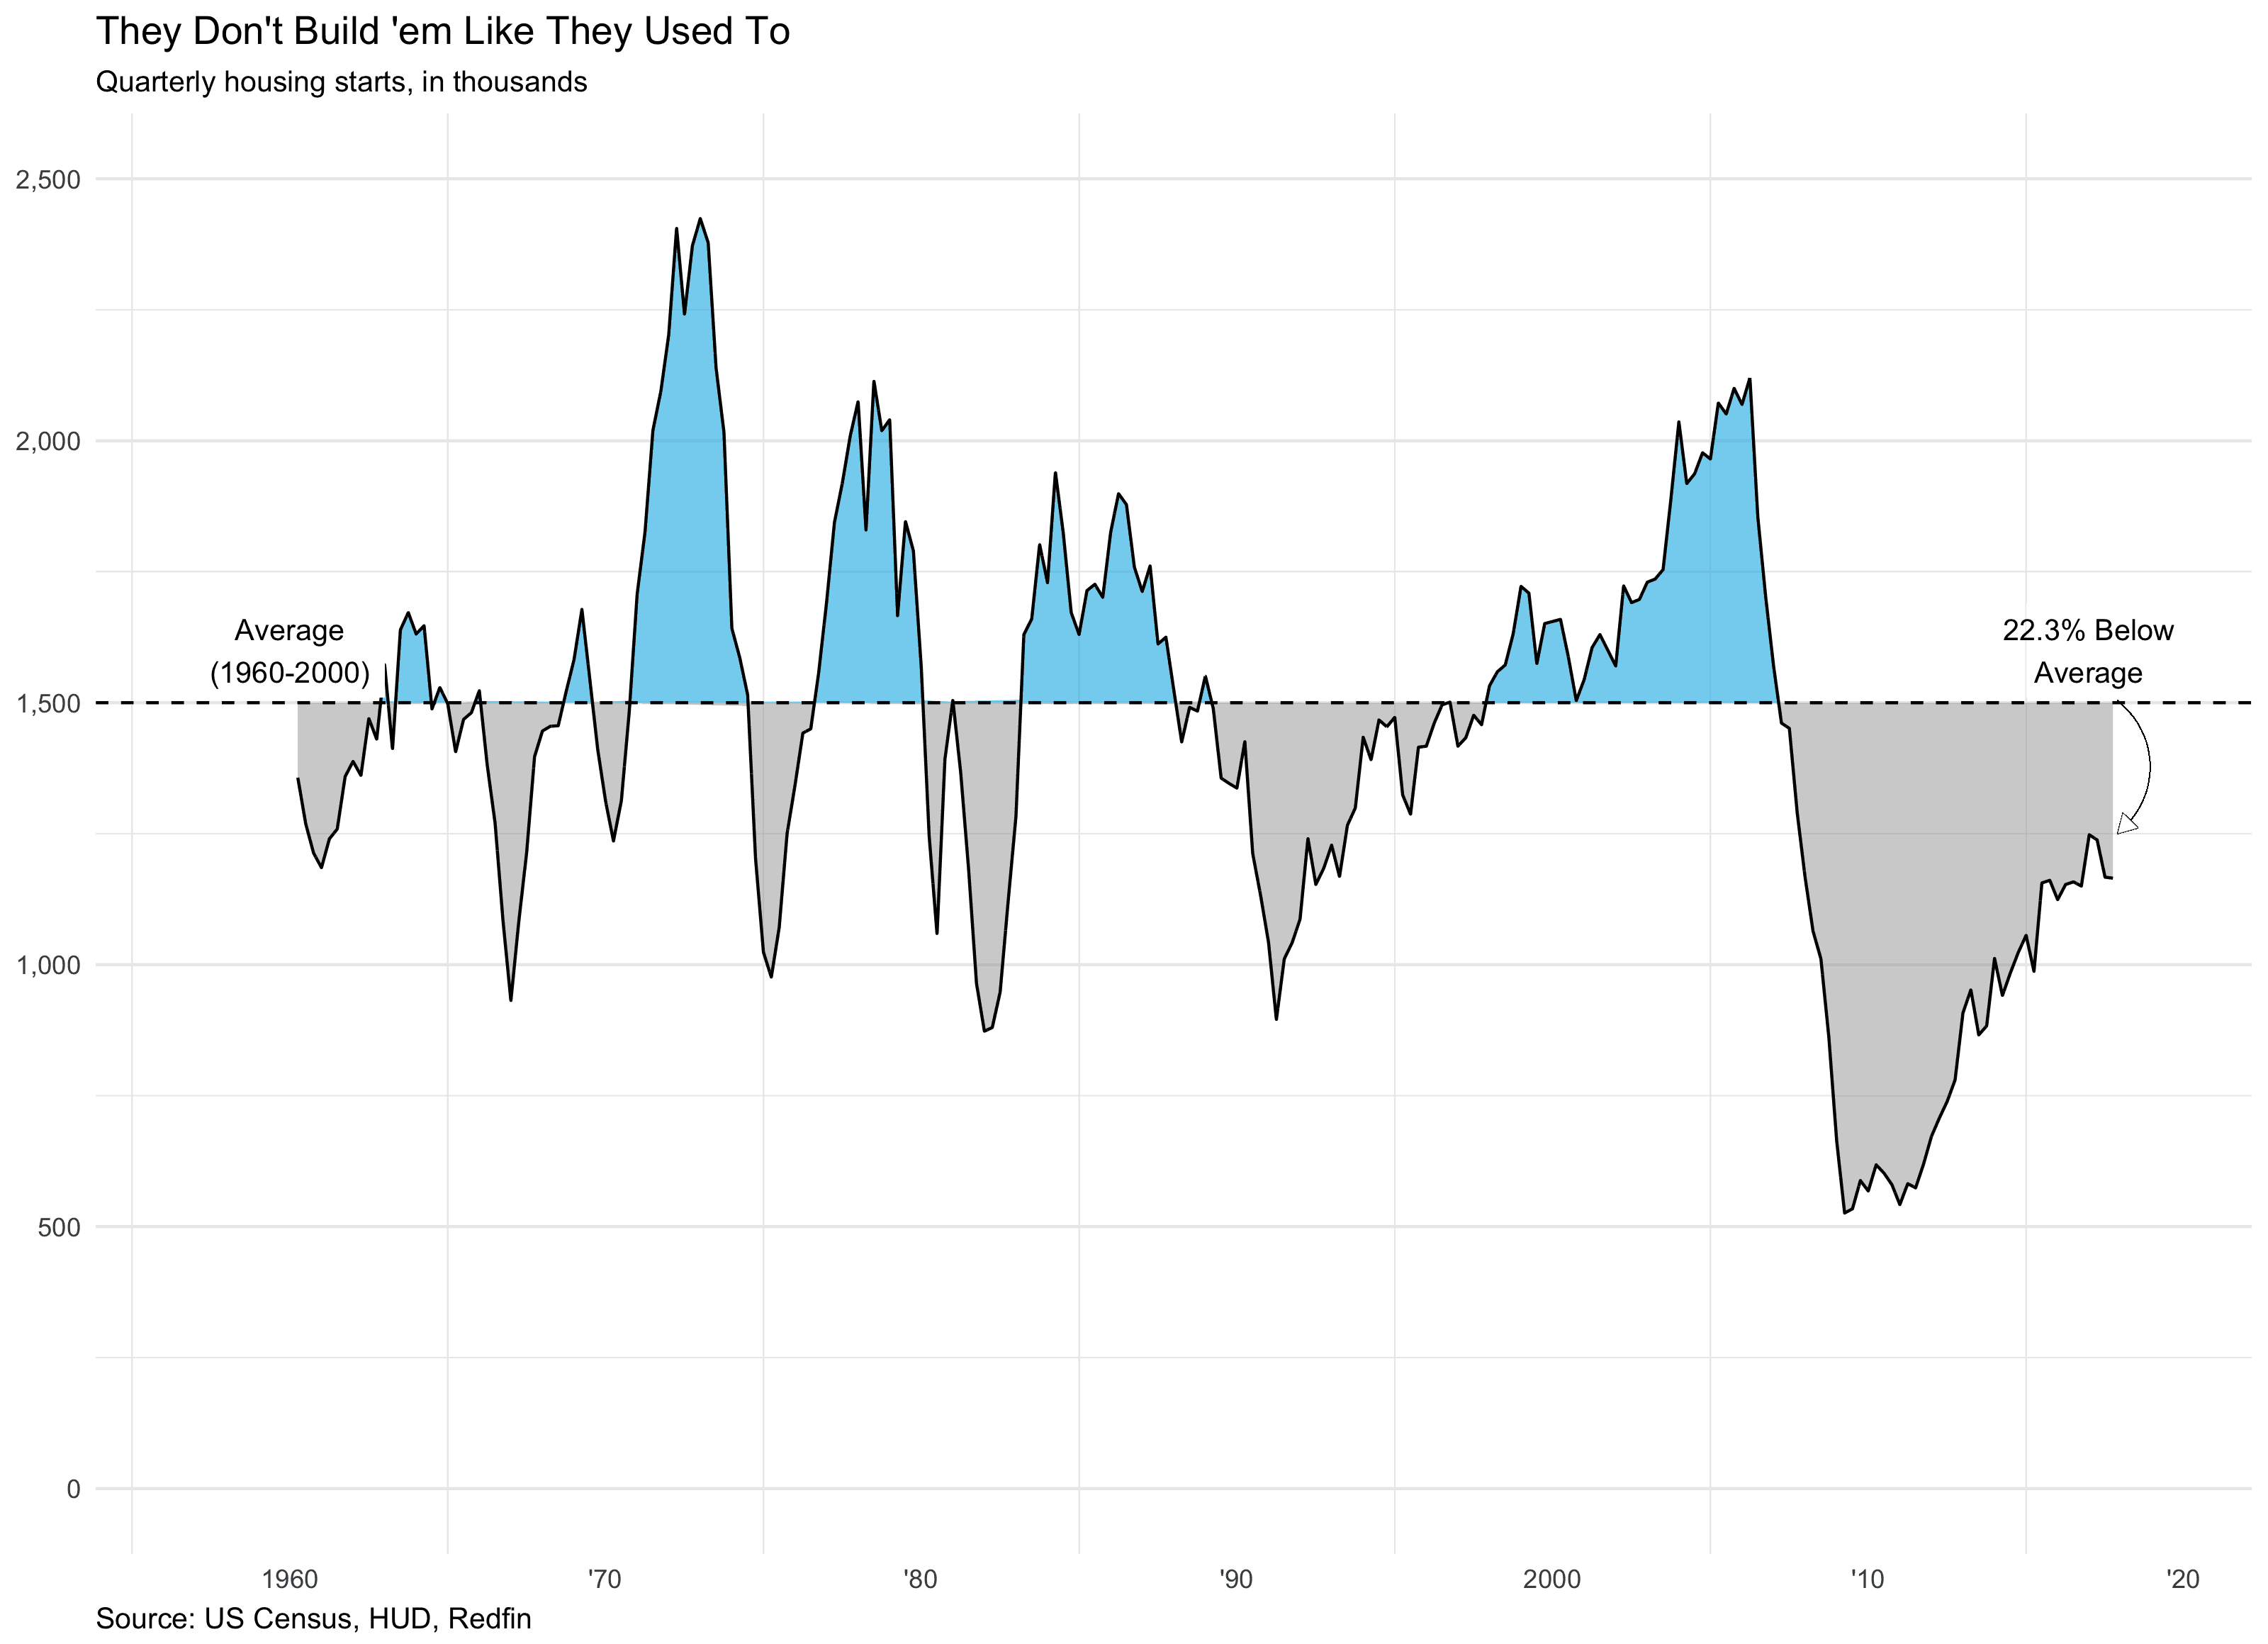
Housing starts—the number of new residential homes that have begun construction—are still 22 percent below their long-term average (see chart). Single-family building permits, which offer a look at what is in the pipeline for new home construction,5 were up 9.7 percent year-to-date through September, while multi-family units6 are 3.6 percent lower year-to-date. More than three-fourths of the nearly 100 metro areas Redfin tracks had positive growth in the first eight months of the year in single-family permits compared to last year. Therefore, single-family housing starts are expected to continue to grow into next year, and new single-family homes will add to inventory in 2018.
Metro-Level Highlights for New Construction in the Third Quarter:7
- Nashville, TN had the highest portion of new home sales over the last three months, with 24 percent of all homes sold being new construction. Raleigh, NC and Austin, TX each followed closely behind at 23.2 percent and 18.9 percent, respectively.
- The four metro areas with the lowest shares of new construction sales were all in New York and New Jersey led by Buffalo, NY at just 0.8 percent of home sales followed by Camden, NJ (1.5%), Hudson Valley, NY (1.6%) and Rochester, NY (1.6%). Six of the following seven lowest-ranked metro areas were in California—each with under one in 40 home sales being new construction.
- The metro areas with the highest year-over-year price growth per square foot for new construction sales last quarter were Birmingham, AL (21.9%), Hudson Valley, NY (21.0%) and Long Island, NY (17.4%). The California Bay Area metros of San Francisco and San Jose each posted negative price growth per square foot for new construction homes—falling 6.2 percent and 4.2 percent year-over-year.
- The estimated cost of constructing a new unit during the months of June, July and August this year was the highest in Long Island, NY at an average of $451,000 per home. Honolulu, HI ($451,000), Tucson, AZ ($272,000), and San Francisco ($269,000) rounded out the top four for the average cost per unit permitted.
- Austin, TX, Raleigh, NC and Nashville, TN are building the most homes per capita at 29, 28 and 27 units per 10,000 residents, respectively. In contrast, Allentown, PA and Long Island, NY had far fewer new homes in the pipeline at only 0.5 and 1.1 units permitted per ten thousand residents respectively.
- A look at the total volume of building permits reveals that the metro areas poised to build the most new homes in the coming months are Houston, TX (10,000), Dallas, TX (9,400), Phoenix, AZ (7,800), and Atlanta, GA (7,700).
- Those with the largest year-over-year increase in units permitted include Oakland, CA (142%), Riverside-San Bernardino, CA (96.7%) and Tacoma, WA (76.9%).
In conjunction with its inaugural quarterly report on new residential construction, Redfin is making available on its Data Center a downloadable set of monthly data on new construction prices, sales, inventory and other new residential market statistics. Redfin is also releasing building permit data—provided by the Census—allowing users to analyze average construction costs and compare the number of units built per capita across regions. Both datasets are available for download at the National, Metro, and County Levels since 2012.
1. September throughout this report is a rolling three-month measure and includes July, August, and September for all new construction data.↩
2. This is up 17 percent from four years prior. The price premium varies considerably when accounting for size and location however. New homes are being built larger than existing as the price per square foot premium was about 2 percent lower for new construction homes, but they also tend to be further away from the urban core; in the Nashville metro area, for example, new construction homes bought in 2017 were typically 22.9 percent further from the city-center than existing homes.↩
3. The average permit valuation for constructing each single-family home varies widely from just $88,000 in Norwich, CT to more than one million dollars in San Francisco in August.↩
4. Four states (Connecticut, Illinois, Vermont, and West Virginia) experienced a decline in population from 2010 to 2016, yet still built tens of thousands of units each during this time period.↩
5. The average length of time between authorization (i.e. a permits) and a housing start is about 1 month and most starts are completed within a six months for single-family or about one year for multi-family properties.↩
6. Multi-family units include buildings containing 5 or more units and are largely apartments, but may include condo towers. The complete breakdown of the data is available here.↩
7. Only metropolitan divisions with populations greater than 750,000 people were included in this highlights section.↩


