
-
The typical home purchased in high-opportunity U.S. neighborhoods went for $470,000 last year—$130,000 more than the typical home in low-opportunity areas.
-
The price premium for opportunity is highest in segregated parts of the Midwest and South; in Detroit, homes in high-opportunity areas are nearly four times more expensive than those in low-opportunity areas.
-
High-opportunity neighborhoods often have highly-rated schools and low levels of crime—and are disproportionately white.
-
Offering customized home-search assistance can help low-income families move into high-opportunity areas, research shows.
The typical home that sold in a high-opportunity U.S. neighborhood in 2022 went for $470,000, or 38.2% more than the typical home that sold in a low-opportunity neighborhood, which went for $340,000.
That’s according to a Redfin analysis of home sales in 100 of the most populous U.S. metropolitan areas. We sorted each neighborhood into one of three tiers—low opportunity, intermediate opportunity and high opportunity. A high-opportunity neighborhood is defined as one where children who grew up in low-earning households went on to become higher earning adults than the typical person who grew up in their metro at the same time.
People in high-opportunity neighborhoods are more likely than those in low-opportunity neighborhoods to live among highly rated schools, professional networking opportunities, large numbers of college graduates and low rates of poverty and crime. High-opportunity neighborhoods also have larger concentrations of two-parent households, along with high levels of income inequality and segregation—meaning they tend to skew wealthy and white. The methodology Redfin uses to measure opportunity was developed by Harvard University researcher Raj Chetty.
“It’s prohibitively expensive for many families—particularly those of color—to access the neighborhoods that offer children the best shot at financial success,” said Redfin Deputy Chief Economist Taylor Marr. “Where you grow up lays the groundwork for your future. Kids raised in low-opportunity neighborhoods have a lower chance of getting a good education and well-paying job, growing a robust professional network, building wealth through home equity and staying out of harm’s way. That can perpetuate a cycle of segregation and wealth inequality that can last for generations, with their children and grandchildren often grappling with the same disadvantages.”
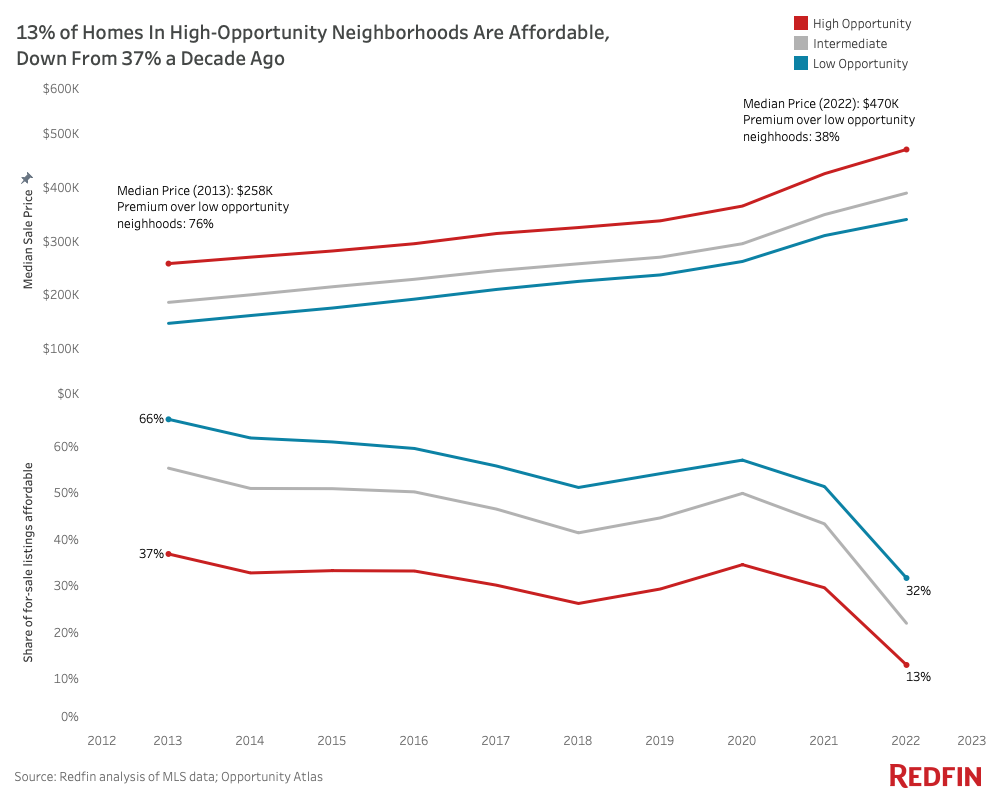
The price premium of high-opportunity neighborhoods has shrunk over time, but that’s not because these areas have become more affordable. It’s because many low-opportunity neighborhoods have gentrified and become less affordable.
Data Summary
All data represents 2022 unless otherwise noted
| High-opportunity neighborhoods | Intermediate-opportunity neighborhoods | Low-opportunity neighborhoods | |
| Median sale price | $470,000 | $389,000 | $340,000 |
| Median sale price increase since 2012 | 100% | 136% | 174% |
| Median monthly mortgage payment | $3,359 | $2,763 | $2,387 |
| Median household income (2021) | $107,907 | $87,485 | $71,462 |
| Share of total for-sale homes | 39.5% | 34.7% | 25.8% |
| Share of for-sale homes affordable* on median income | 13% | 21.9% | 31.7% |
| Share of for-sale homes affordable* on median Black household income | 4.2% | 8.9% | 15.6% |
| Share of for-sale homes affordable* on median white household income | 19.1% | 29.7% | 41.3% |
| Share of for-sale homes affordable* on median Hispanic household income | 7.5% | 13.9% | 23.5% |
| Share of for-sale homes affordable* on median Asian household income | 25.3% | 34.9% | 44.7% |
| Share of population that’s nonwhite (2021) | 35.2% | 43.3% | 61.4% |
*We define an affordable home as one where the monthly mortgage payment would not exceed 30% of household income. We assume a 5% down payment and the average 30-year-fixed mortgage rate during the month the home was listed for sale.
High-Opportunity Neighborhoods Have More Homes for Sale, But Those Homes Are Less Affordable—Especially for Families of Color
The good news is the lion’s share (39.5%) of U.S. homes for sale are in high-opportunity neighborhoods. The bad news is high-opportunity neighborhoods are rarely affordable. Just 13% of homes for sale in high-opportunity neighborhoods last year were affordable on their metro area’s median income, compared with 31.7% in low-opportunity neighborhoods. Affordability has fallen across the board due to surging home prices; the median sale price in high-opportunity neighborhoods has grown 100% since 2012, while the median sale price in low-opportunity neighborhoods has jumped 174%.
White families have an easier time gaining access to these areas than many families of color. Just 4.2% of homes for sale in high-opportunity neighborhoods were affordable for the typical Black household in 2022. The share was nearly five times higher (19.1%) for the typical white household.
On average, just over one-third (35.2%) of residents in the high-opportunity neighborhoods Redfin analyzed are nonwhite, compared with nearly two-thirds (61.4%) in low-opportunity neighborhoods.
The Price Premium for Opportunity Is Highest in Segregated Midwestern and Southern Metros
In Detroit, the median home sale price in high-opportunity neighborhoods was $240,000 in 2022. That’s 269% higher than the $65,00 median sale price in Detroit’s low-opportunity neighborhoods—the largest premium of the metros Redfin analyzed. Next came Memphis, TN, where high-opportunity neighborhoods held a 187% premium. Rounding out the top five are Akron, OH (169%), Milwaukee (149%) and Birmingham, AL (143%).
Many of the metros where high-opportunity neighborhoods carry hefty home-price premiums grapple with relatively high levels of segregation. Milwaukee and Detroit both rank among the five most segregated metros based on 2020 Census data; Memphis and Birmingham are also near the top of the list.
“The barriers to entry in high-opportunity neighborhoods often ensure that the same families continue to have the best shot at upward economic mobility generation after generation,” Marr said.
New York was the only metro where it was less expensive (by 6.7%) to live in a high-opportunity neighborhood. The median sale price of high-opportunity neighborhoods in New York was $695,000, compared with $745,000 in low-opportunity neighborhoods. For a table with the full metro-level breakdown, scroll to the bottom of this report.
In Detroit, High-Opportunity Neighborhoods Are Nearly Four Times More Expensive and Predominantly White
Detroit’s high-opportunity neighborhoods overlap with the metro’s predominantly white, suburban areas, while low-opportunity neighborhoods overlap with predominantly nonwhite parts of the urban core. 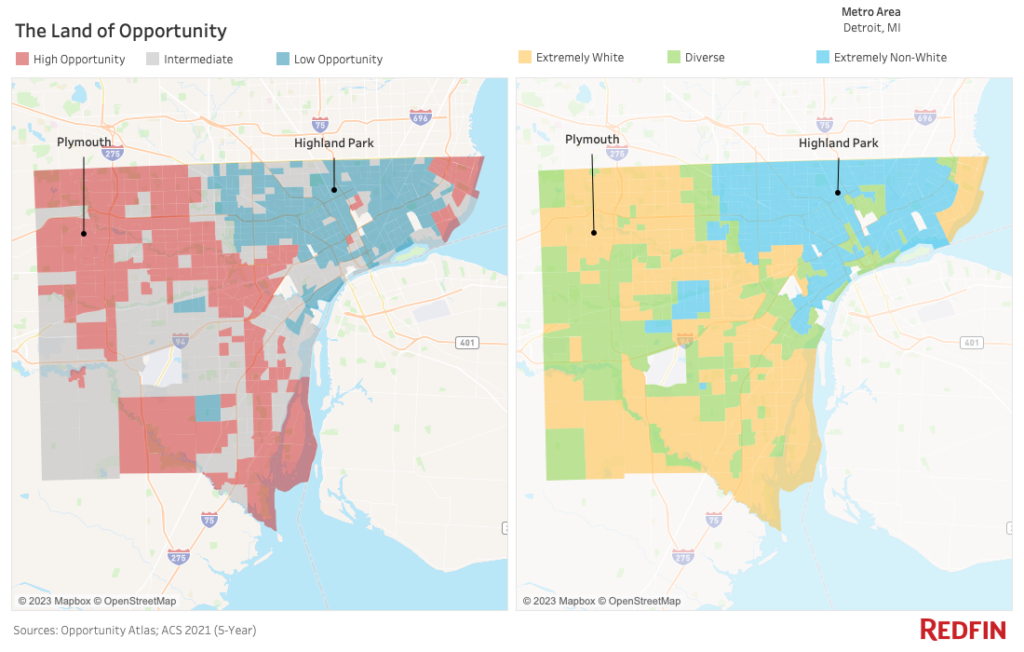
Plymouth, a city of about 10,000 located a short drive west of Detroit, is one example of a high-opportunity neighborhood in the Detroit metro area.
“Plymouth screams suburbia. It has a quaint little downtown, cute restaurants and coffee shops, highly-rated high schools and an ice-sculpture festival every winter,” said Kate McNeill, Redfin’s market manager in Detroit. “It stands in contrast to some neighborhoods closer to downtown, where there has been less development despite increasing home prices in recent years.”
McNeill continued: “Take Highland Park, a majority Black area that has seen its population decline by 24% in the past decade or so. Much of that is due to disinvestment and a lack of city services. When you walk around Highland Park, many homes have been boarded up and abandoned.”
Detroit’s housing market, like that of many U.S. cities, has a history of racial discrimination. In the 1930s, the federally sponsored policy known as redlining effectively barred many nonwhite residents from obtaining mortgages and purchasing homes. Racial covenants also prevented people who weren’t white from moving into many areas. In northwest Detroit, developers built a six-foot-high wall to separate a white neighborhood from a Black neighborhood. It still stands today as a historical marker.
While discrimination in the housing market was outlawed in the 1960s, segregation and racial bias continued to flourish. In 1967, violent riots over police abuse and discrimination broke out between Detroit’s Black community and the local police department. Scores of the city’s white residents subsequently left for the suburbs in an exodus commonly known as “white flight.” In the years to follow, much of the investment money in the Detroit area flowed into white neighborhoods. Many Black residents continue to have trouble accessing home loans, in part because lenders often prioritize high-priced areas. Black people represent about 80% of the population, but get 51% of Detroit’s mortgages, according to a 2020 article from the Wall Street Journal.
A consortium of nonprofits in 2021 joined forces to build more resources for Detroit homeowners, including foreclosure prevention, financial counseling, and assistance for low-income families that want to achieve homeownership. And in 2020, Detroit announced a $48 million fund to create affordable housing. The first project was completed last year.
Opportunities for Change: Provide Home-Search Assistance, Subsidize Affordable Housing and Reform Zoning Laws
While low-income families are often concentrated in low-opportunity neighborhoods, research has shown this is rarely a function of choice. Oftentimes, they end up in low-opportunity areas because there are barriers in the home-search process that prevent them from moving to a high-opportunity neighborhood. A 2020 study of housing-voucher recipients in Washington State found just that:
“Many families reported that they had limited time and resources to search for housing, as they were facing challenges such as domestic violence, mental health conditions, or holding multiple jobs while caring for children as single parents,” wrote the researchers, led by Columbia University’s Peter Bergman and Raj Chetty. “Redesigning affordable housing policies to provide customized assistance in housing search could reduce residential segregation and increase upward mobility substantially.”
In the study, low-income housing-voucher recipients in Washington’s King County (which includes Seattle) were offered services including customized rental search assistance, landlord engagement and short-term financial assistance. They could choose to use their housing voucher in any neighborhood within the housing authority’s jurisdiction. Of the families who received the aforementioned services, 53% chose to lease units in high-opportunity neighborhoods, compared with just 15% of families who did not receive the services.
These strategies used to help renters in Seattle could also be employed to help first-time buyers everywhere navigate the home-search process, Redfin’s Marr said.
”Local leaders should seek to remove barriers that prevent low-income families from moving into high-opportunity neighborhoods, while also investing in low-opportunity neighborhoods,” Marr said. “In addition to offering assistance during the home-search process, governments can invest more in public schools in low-opportunity neighborhoods, offer affordable housing subsidies and reform zoning laws to allow for more housing in high-opportunity neighborhoods.”
Metro-Level Summary: 2022
The table below includes the 100 most populous U.S. metro areas for which there was sufficient data.
| U.S. Metro Area | Median Sale Price: Low-Opportunity Neighborhoods | Median Sale Price: High-Opportunity Neighborhoods | Price Premium of High-Opportunity Neighborhoods |
| Akron, OH | $104,000 | $280,000 | 169.2% |
| Albany, NY | $212,000 | $318,000 | 50.0% |
| Albuquerque, NM | $269,000 | $355,000 | 32.0% |
| Allentown, PA | $210,000 | $359,000 | 71.0% |
| Anaheim, CA | $850,000 | $1,200,000 | 41.2% |
| Atlanta, GA | $310,000 | $466,000 | 50.3% |
| Austin, TX | $465,000 | $575,000 | 23.7% |
| Bakersfield, CA | $277,500 | $405,000 | 45.9% |
| Baltimore, MD | $222,500 | $450,000 | 102.2% |
| Baton Rouge, LA | $198,000 | $286,123 | 44.5% |
| Birmingham, AL | $145,000 | $352,500 | 143.1% |
| Boise City, ID | $434,900 | $570,000 | 31.1% |
| Boston, MA | $564,000 | $770,000 | 36.5% |
| Bridgeport, CT | $390,000 | $790,000 | 102.6% |
| Buffalo, NY | $148,750 | $285,000 | 91.6% |
| Camden, NJ | $245,000 | $372,500 | 52.0% |
| Cape Coral, FL | $324,250 | $499,000 | 53.9% |
| Charleston, SC | $415,300 | $490,000 | 18.0% |
| Charlotte, NC | $320,000 | $455,000 | 42.2% |
| Chicago, IL | $265,000 | $358,000 | 35.1% |
| Cincinnati, OH | $203,000 | $315,000 | 55.2% |
| Cleveland, OH | $120,000 | $275,000 | 129.2% |
| Colorado Springs, CO | $380,000 | $557,013 | 46.6% |
| Columbia, SC | $245,000 | $295,100 | 20.4% |
| Columbus, OH | $205,000 | $390,000 | 90.2% |
| Dallas, TX | $318,000 | $519,900 | 63.5% |
| Dayton, OH | $120,000 | $254,400 | 112.0% |
| Denver, CO | $550,000 | $650,000 | 18.2% |
| Des Moines, IA | $185,000 | $310,000 | 67.6% |
| Detroit, MI | $65,000 | $240,000 | 269.2% |
| El Paso, TX | $228,000 | $239,350 | 5.0% |
| Elgin, IL | $232,000 | $369,000 | 59.1% |
| Fort Lauderdale, FL | $348,650 | $540,000 | 54.9% |
| Fort Worth, TX | $300,000 | $406,588 | 35.5% |
| Frederick, MD | $450,000 | $689,950 | 53.3% |
| Fresno, CA | $285,000 | $470,000 | 64.9% |
| Gary, IN | $145,000 | $310,000 | 113.8% |
| Grand Rapids, MI | $235,000 | $365,000 | 55.3% |
| Greensboro, NC | $186,500 | $320,000 | 71.6% |
| Greenville, SC | $270,000 | $340,000 | 25.9% |
| Hartford, CT | $235,000 | $350,000 | 48.9% |
| Honolulu, HI | $758,000 | $850,000 | 12.1% |
| Houston, TX | $312,000 | $370,000 | 18.6% |
| Indianapolis, IN | $177,000 | $340,000 | 92.1% |
| Jacksonville, FL | $280,000 | $435,000 | 55.4% |
| Kansas City, MO | $186,000 | $395,000 | 112.4% |
| Knoxville, TN | $263,155 | $385,000 | 46.3% |
| Lake County, IL | $207,000 | $440,000 | 112.6% |
| Lakeland, FL | $311,454 | $338,860 | 8.8% |
| Las Vegas, NV | $368,000 | $489,900 | 33.1% |
| Little Rock, AR | $150,000 | $245,000 | 63.3% |
| Los Angeles, CA | $660,000 | $1,036,000 | 57.0% |
| Louisville, KY | $175,500 | $340,000 | 93.7% |
| McAllen, TX | $199,000 | $235,000 | 18.1% |
| Memphis, TN | $115,000 | $330,000 | 187.0% |
| Miami, FL | $430,000 | $623,515 | 45.0% |
| Milwaukee, WI | $153,250 | $381,000 | 148.6% |
| Minneapolis, MN | $310,000 | $430,000 | 38.7% |
| Montgomery County, PA | $332,500 | $511,418 | 53.8% |
| Nashville, TN | $395,500 | $550,000 | 39.1% |
| Nassau County, NY | $512,000 | $720,000 | 40.6% |
| New Brunswick, NJ | $415,000 | $525,000 | 26.5% |
| New Haven, CT | $223,500 | $384,326 | 72.0% |
| New Orleans, LA | $290,000 | $325,000 | 12.1% |
| New York, NY | $745,000 | $695,000 | -6.7% |
| Newark, NJ | $370,000 | $585,000 | 58.1% |
| North Port, FL | $372,000 | $562,500 | 51.2% |
| Oakland, CA | $750,000 | $1,375,000 | 83.3% |
| Oklahoma City, OK | $162,500 | $290,000 | 78.5% |
| Omaha, NE | $180,000 | $362,000 | 101.1% |
| Orlando, FL | $335,000 | $426,700 | 27.4% |
| Oxnard, CA | $704,000 | $940,000 | 33.5% |
| Philadelphia, PA | $200,000 | $326,000 | 63.0% |
| Phoenix, AZ | $385,000 | $550,000 | 42.9% |
| Pittsburgh, PA | $151,000 | $280,000 | 85.4% |
| Portland, OR | $495,000 | $635,100 | 28.3% |
| Providence, RI | $345,000 | $450,000 | 30.4% |
| Raleigh, NC | $394,812 | $520,000 | 31.7% |
| Richmond, VA | $250,000 | $429,000 | 71.6% |
| Riverside, CA | $479,000 | $645,000 | 34.7% |
| Rochester, NY | $145,000 | $260,000 | 79.3% |
| Sacramento, CA | $450,000 | $665,000 | 47.8% |
| Salt Lake City, UT | $440,000 | $650,000 | 47.7% |
| San Antonio, TX | $249,799 | $384,990 | 54.1% |
| San Diego, CA | $725,000 | $980,000 | 35.2% |
| San Francisco, CA | $1,525,000 | $1,820,000 | 19.3% |
| San Jose, CA | $1,189,000 | $1,725,000 | 45.1% |
| Seattle, WA | $719,000 | $999,950 | 39.1% |
| St. Louis, MO | $147,500 | $305,000 | 106.8% |
| Stockton, CA | $395,000 | $610,000 | 54.4% |
| Tacoma, WA | $484,500 | $629,985 | 30.0% |
| Tampa, FL | $350,000 | $415,000 | 18.6% |
| Tucson, AZ | $285,000 | $406,000 | 42.5% |
| Tulsa, OK | $170,000 | $300,000 | 76.5% |
| Virginia Beach, VA | $255,000 | $389,500 | 52.7% |
| Warren, MI | $220,000 | $332,000 | 50.9% |
| Washington, D.C. | $450,000 | $695,000 | 54.4% |
| West Palm Beach, FL | $350,000 | $575,000 | 64.3% |
| Wilmington, DE | $239,000 | $385,000 | 61.1% |
| Worcester, MA | $310,000 | $475,000 | 53.2% |
| National | $340,000 | $470,000 | 38.2% |
Methodology
For this analysis, we started with data from Opportunity Insights—a nonprofit at Harvard University—that provides a way to identify neighborhoods (census tracts) offering children the best chance to rise out of poverty. Across the 100 most populous metropolitan divisions (referred to as metro areas in the report) for which we had housing data from public records or Redfin.com, we put each neighborhood into one of three groups—high, intermediate or low opportunity—based on average adult earnings (as of 2015) for children raised in that neighborhood.
A high-opportunity neighborhood is defined as one where children who grew up in low-earning households (earnings in the bottom quarter of U.S. household incomes) in the 1980s—specifically those born between 1978 and 1983—went on to become higher earning adults (top third of each metro area’s household income) than the typical person who grew up in their metro at the same time. Intermediate-opportunity neighborhoods are those where children of low-earning households had adult earnings in the middle third of their metro’s household income, and low-opportunity neighborhoods are those where children of low-earning households had adult earnings in the bottom third of their metro’s household income.
We looked at the price of all 2+ bedroom homes (excluding multi-unit property sales) sold each year in each neighborhood to compare the price differences of high-opportunity and low-opportunity areas. Using median household incomes in each county (and for each race of head of household), we were able to estimate how affordable listings were in each neighborhood category. All national figures are a weighted (by housing units, listings, or sales) average of the metro-level metrics.
We define an affordable home as one where the monthly mortgage payment would not exceed 30% of the metro’s median household income. We assume a 5% down payment and the average 30-year-fixed mortgage rate during the month the home was listed for sale. We also assumed a 1.25% annual property-tax rate, a homeowner’s insurance rate equal to 0.75% of the purchase price. Income data overall and by race came from U.S. Census Bureau’s 2021 American Community Survey.


