Sun Belt cities including Phoenix, Tampa and Las Vegas attracted scores of house hunters during the pandemic, driving up home prices. Now their housing markets are among the fastest-cooling in the nation, giving buyers the flexibility to bow out.
Nationwide, roughly 64,000 home-purchase agreements fell through in August, equal to 15.2% of homes that went under contract that month. That’s up from 12.1% a year earlier and is comparable with July’s revised rate of 15.5%. The percentage has now hovered around 15% for the past three months—the highest level on record with the exception of March and April 2020, when the onset of the coronavirus pandemic brought the housing market to a near standstill. Before the pandemic, it was consistently around 12%.
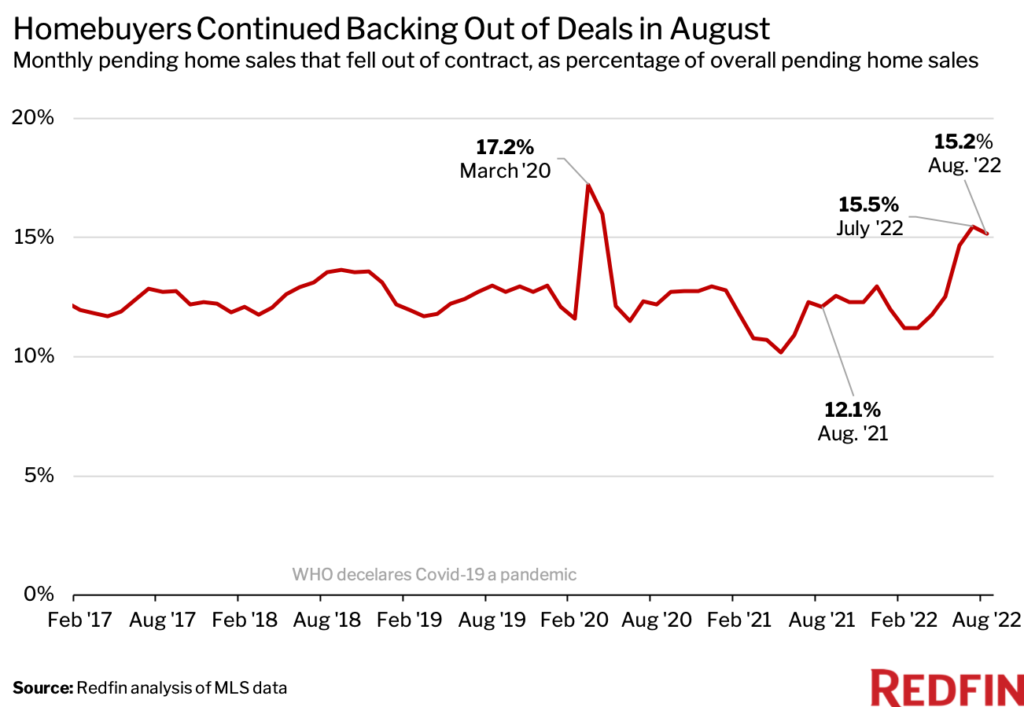
This is according to a Redfin analysis of MLS data going back through 2017. Please note that homes that fell out of contract during a given month didn’t necessarily go under contract the same month. For example, a home that fell out of contract in August could have gone under contract in July. This data is subject to revision.
Homebuyers were most likely to back out of deals in Sun Belt cities that surged in popularity and price during the pandemic, such as Phoenix, Tampa and Las Vegas. They were least likely to back out in pricey coastal hubs like San Francisco and New York, which went out of vogue during the pandemic but are now making a comeback as workers return to the office. Scroll down to the next section for full metro-level data.
A slowing housing market is allowing buyers to renege on deals because it often means they don’t need to waive important contract contingencies in order to compete like they did during last year’s homebuying frenzy. Including inspection, financing and appraisal contingencies in a contract means a buyer can cancel their purchase if there’s an issue with the home, they can’t get a mortgage or the appraisal is different from the agreed-upon amount. Some buyers may also be backing out of deals because they’re waiting to see if home prices fall.
“House hunters today are taking their time and exploring their options, whereas six months ago, they had to act quickly and pull out every stop to compete because homes were selling almost immediately,” said Tzahi Arbeli, a Redfin real estate agent in Las Vegas. “Homebuyers now will agree to buy a house and be doing the inspection, and then back out because they found another home they love more.”
Surging mortgage rates may also be a factor. The average 30-year-fixed mortgage rate hit 6.29% last week—the highest since 2008—sending the typical homebuyer’s monthly mortgage payment up 45% from a year ago.
“Some homebuyers are finding that by the time they go under contract and lock in their mortgage rates, rates could be much higher than they were when they toured the home and/or got pre-approved. That can kill the deal because the buyer is no longer financially comfortable with the purchase,” said Sam Chute, a Redfin real estate agent who works with sellers in Miami. “I advise sellers to price their homes competitively based on the current market because deals are falling through and buyers are no longer willing to pay pie-in-the-sky prices.”
Sun Belt Buyers Are Backing Out of Deals at the Highest Rate
In Jacksonville, FL, roughly 800 home-purchase agreements were called off in August, equal to 26.1% of homes that went under contract that month. That’s the highest percentage among 50 most populous U.S. metropolitan areas. Next came Las Vegas (23%), Atlanta (22.6%), Orlando, FL (21.9%), Fort Lauderdale, FL (21.7%), Phoenix (21.6%), Tampa, FL (21.5%), Fort Worth, TX (21.5%), San Antonio (21.1%) and Houston (20.6%).
All 10 metros above are located in the Sun Belt, which surged in popularity among homebuyers during the pandemic. Four of the 10 metros—Las Vegas, Phoenix, Tampa and San Antonio—have consistently ranked on Redfin’s list of top migration destinations. These areas initially attracted house hunters because they were relatively affordable, but an influx of demand caused prices to skyrocket, rendering them less attractive to many homebuyers. Jacksonville, Las Vegas, Orlando, Phoenix and Tampa are all among the fastest-cooling housing markets in the country right now, and San Antonio, Tampa and Phoenix have among the lowest rates of homebuyer competition.
Many of the metros where deal cancellations are least common are metros that saw people leave during the pandemic, including the Bay Area and New York. Newark, NJ had the lowest percentage of deal cancellations (2.7%), followed by San Francisco (4.2%), Nassau County, NY (6.1%), New York (7%), Montgomery County, PA (7.6%), San Jose, CA (8.2%), Milwaukee (8.9%), Oakland, CA (9.2%), Boston (10.1%) and Seattle (10.3%).
Eight of those 10 metros—all but Montgomery County and Milwaukee—experienced among the largest net outflows of house hunters in July and August. That’s based on net outflow, a measure of how many more Redfin.com users looked to leave than move in.
Metro-Level Summary: August 2022
The table below measures pending sales that fell out of contract as a percentage of overall pending sales, and is sorted from highest to lowest. It includes the 50 most populous U.S. metro areas.
 United States
 Canada