
Buyers backed off amid high mortgage rates and economic uncertainty. New listings were also down, with some prospective sellers staying put as price growth slowed.
Home sales dropped 19.3% year over year in July to their lowest level since the beginning of the pandemic, when the housing market was at a near standstill. That’s also the biggest annual decline in U.S. home sales in more than a year, a reflection of the continued cooling effects of 5.4%-plus mortgage rates and nationwide economic uncertainty. Home sales dipped 4.1% from the previous month, the sixth-straight monthly decline. Some prospective homebuyers were sidelined because they were priced out of the market; others were wary of potential home-value declines in the near future.
Home prices increased at their slowest pace since June 2020, rising 7.7%. Price growth dipping into the single digits after two years of double-digit increases reflects months of slumping homebuyer demand, homes sitting on the market longer than before and dwindling competition.
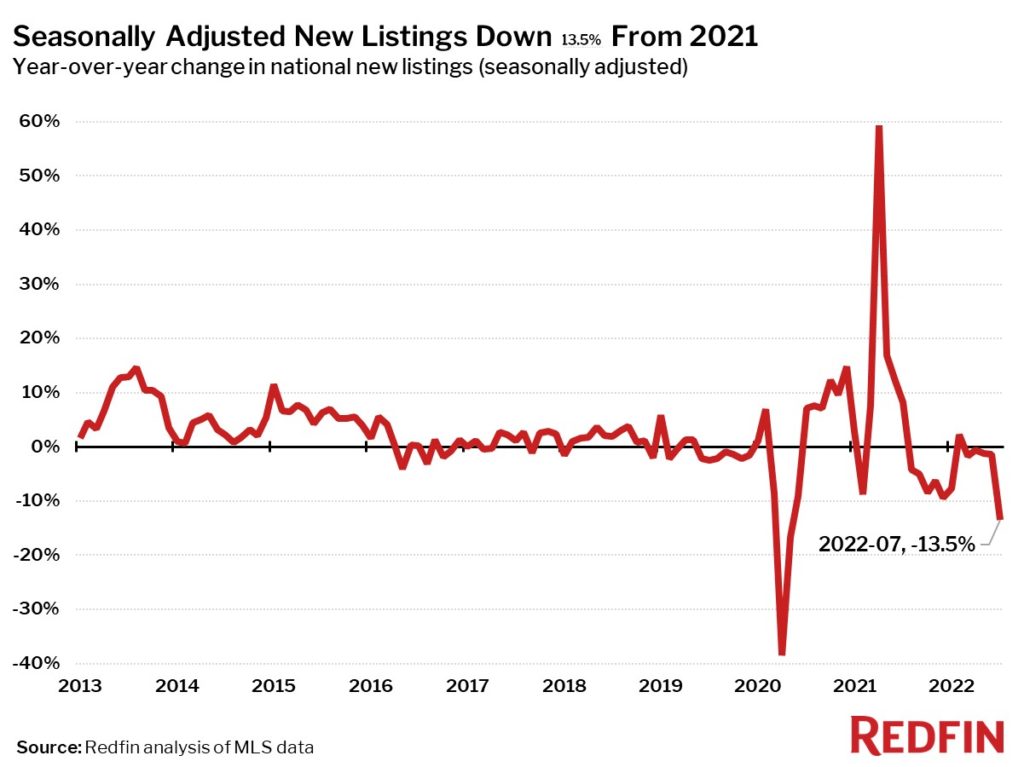
Sellers also backed off, with many hesitant to sell for less than what they would have gotten at the height of the pandemic homebuying frenzy. Plus, many homeowners are staying put because they have a low mortgage rate compared to today’s rates. New listings dropped 13.5% year over year, the biggest decline in over a year. Many of the sellers who did list their homes had to settle for less. Twenty-one percent of sellers dropped their asking price in July, the highest share since at least 2012, when Redfin started tracking this data.
“The buyers who are still in the game are finally getting a break from bidding wars, which means they can be picky,” said Raleigh, NC Redfin agent Pam Lewis. “Three months ago, buyers were saying, ‘get me a building with four walls and I’ll make it work.’ Now they have some choices. They don’t want a home if it doesn’t have the fenced-in yard or guest room on their wish list, and they want a $20,000 price reduction if a home has been on the market for more than a week. I’m telling buyers they’re not likely to see their property values decrease over time, but they may not appreciate as fast as homeowners have become accustomed to in the past few years.”
July Highlights
| Market Summary | July 2022 | Month-Over-Month | Year-Over-Year |
| Median sale price | $412,700 | -3.3% | 7.7% |
| Homes sold, seasonally adjusted | 501,100 | -4.1% | -19.3% |
| New listings, seasonally adjusted | 626,900 | -0.3% | -13.5% |
| All homes for sale, seasonally adjusted | 1,513,900 | 1.6% | 3.9% |
| Median days on market | 21 | 3 | 6 |
| Months of supply | 2.1 | 0.4 | 0.7 |
| Sold above list | 47.3% | -8.0 pp† | -8.2 pp† |
| Median off-market Redfin Estimate | $419,600 | 0.0% | 19.6% |
| Average sale-to-list | 101.0% | -1.2 pp† | -1.2 pp† |
| Share of for-sale homes with a price drop | 20.9% | 4.1 pp† | 9.7 pp† |
| Average 30-year fixed mortgage rate | 5.41% | -0.11 pp† | +2.54 pp† |
† – “pp” = percentage-point change
Metro-Level Highlights
Competition
- Indianapolis was the fastest market, with half of all homes pending sale in just 5 days, the same as a year earlier. Oklahoma City was the next fastest market, with 7 median days on market., followed by Denver, CO, Grand Rapids, MI and Omaha, NE at 8 days apiece.
- The most competitive market in July was Rochester, NY where 78.1% of homes sold above list price, followed by 76.2% in Buffalo, NY, 70.9% in Newark, NJ, 70.6% in Worcester, MA, and 69.8% in Hartford, CT.
Prices
- Cape Coral, FL had the nation’s highest price growth, rising 27% since last year to $399,900. Tampa, FL had the second highest growth at 24.5% year-over-year price growth, followed by North Port, FL (24%), Greensboro, NC (22.2%), and Fort Lauderdale, FL (21%).
- Sale prices declined in two metros in July, both in the Bay Area: San Francisco (-6.5%), and Oakland, CA (-1.5%).
Sales
- Home sales declined annually in every U.S. metro. Sales declined least in Grand Rapids, MI, where they were down 5.7%, followed by Buffalo, NY, (-8.1%). Oklahoma City rounded out the top three with sales down 8.6% from a year ago.
- San Jose, CA saw the largest decline in sales since last year, falling 44.2%. Home sales in Boise, ID and San Diego declined by 42.0% and 41.2%, respectively.
Inventory
- North Port, FL had the biggest increase in the number of homes for sale, up 58% year over year, followed by Austin, TX (37%) and Nashville, TN (33%).
- Allentown, PA had the largest decrease in overall active listings, falling 42.9% since last July. Hartford, CT (-28%), Bridgeport, CT (-26%), and Greensboro, NC (-24%) also saw far fewer homes available on the market than a year ago.
Scroll down for national charts and market-by-market breakdowns. For downloadable data on all of the markets Redfin tracks, visit the Redfin Data Center. Refer to our metrics definition page for explanations of all the metrics used in this report.
![]()
![]()
![]()
![]()
![]()
![]()
![]()
Median Sale Price
| Redfin Metro | Median Sale Price | Month-Over-Month | Year-Over-Year |
|---|---|---|---|
| Albany, NY | $300,000 | 0.0% | 9.1% |
| Allentown, PA | $310,000 | -2.8% | 12.7% |
| Anaheim, CA | $980,000 | -3.4% | 8.0% |
| Atlanta, GA | $391,000 | -2.2% | 16.7% |
| Austin, TX | $517,500 | -3.3% | 7.4% |
| Bakersfield, CA | $350,000 | -2.2% | 9.4% |
| Baltimore, MD | $368,000 | -1.9% | 5.1% |
| Baton Rouge, LA | $265,000 | 2.3% | 9.9% |
| Birmingham, AL | $292,500 | -3.1% | 10.0% |
| Boise, ID | $510,300 | -2.8% | 7.0% |
| Boston, MA | $685,000 | -2.8% | 7.9% |
| Bridgeport, CT | $596,500 | -3.8% | 4.6% |
| Buffalo, NY | $244,000 | 1.7% | 8.4% |
| Camden, NJ | $310,000 | 0.3% | 17.0% |
| Cape Coral, FL | $399,900 | -3.6% | 27.0% |
| Charleston, SC | $400,000 | -7.1% | 14.3% |
| Charlotte, NC | $394,500 | -3.5% | 17.4% |
| Chicago, IL | $325,000 | -4.4% | 4.0% |
| Cincinnati, OH | $265,000 | -3.6% | 7.3% |
| Cleveland, OH | $219,700 | -1.8% | 9.9% |
| Columbus, OH | $320,000 | -3.0% | 10.8% |
| Dallas, TX | $435,000 | -4.8% | 14.5% |
| Dayton, OH | $205,000 | -3.7% | 14.5% |
| Denver, CO | $590,000 | -2.8% | 10.2% |
| Detroit, MI | $200,000 | -1.2% | 7.2% |
| El Paso, TX | $240,000 | 0.8% | 15.4% |
| Fort Lauderdale, FL | $415,000 | 1.2% | 21.0% |
| Fort Worth, TX | $382,000 | -0.9% | 19.7% |
| Frederick, MD | $525,000 | -4.5% | 3.0% |
| Fresno, CA | $400,000 | -3.6% | 9.6% |
| Grand Rapids, MI | $310,000 | 0.0% | 10.8% |
| Greensboro, NC | $275,000 | 0.0% | 22.2% |
| Greenville, SC | $320,000 | 3.2% | 19.0% |
| Hartford, CT | $316,800 | 0.6% | 9.2% |
| Honolulu, HI | $716,500 | -2.9% | 6.5% |
| Houston, TX | $345,000 | -2.0% | 12.4% |
| Indianapolis, IN | $290,000 | -2.4% | 12.9% |
| Jacksonville, FL | $375,500 | 0.1% | 20.4% |
| Kansas City, MO | $315,000 | -3.1% | 10.5% |
| Knoxville, TN | $340,000 | -2.9% | 15.6% |
| Lake County, IL | $322,000 | -8.0% | 3.9% |
| Las Vegas, NV | $430,000 | -4.4% | 13.6% |
| Los Angeles, CA | $862,500 | -3.6% | 5.2% |
| Louisville, KY | $258,000 | -1.4% | 5.3% |
| McAllen, TX | $228,000 | 1.3% | 16.0% |
| Memphis, TN | $290,000 | -3.7% | 13.7% |
| Miami, FL | $475,000 | -1.2% | 14.5% |
| Milwaukee, WI | $300,000 | -1.6% | 9.1% |
| Minneapolis, MN | $375,000 | -1.3% | 7.1% |
| Montgomery County, PA | $450,000 | 0.0% | 11.0% |
| Nashville, TN | $457,500 | -0.5% | 18.2% |
| Nassau County, NY | $630,000 | 0.7% | 7.7% |
| New Brunswick, NJ | $478,700 | -0.1% | 12.6% |
| New Haven, CT | $320,000 | 0.0% | 10.7% |
| New Orleans, LA | $280,000 | -8.9% | 3.1% |
| New York, NY | $710,000 | 0.0% | 5.2% |
| Newark, NJ | $535,000 | -1.8% | 9.2% |
| North Port, FL | $474,900 | -2.1% | 24.0% |
| Oakland, CA | $950,000 | -6.9% | -1.5% |
| Oklahoma City, OK | $254,200 | -2.2% | 13.0% |
| Omaha, NE | $290,000 | 0.2% | 16.0% |
| Orlando, FL | $395,000 | -1.3% | 17.9% |
| Oxnard, CA | $835,000 | -0.5% | 9.9% |
| Philadelphia, PA | $280,000 | -5.7% | 1.8% |
| Phoenix, AZ | $468,000 | -3.2% | 14.0% |
| Pittsburgh, PA | $235,000 | -2.1% | 4.4% |
| Portland, OR | $560,000 | -1.6% | 8.9% |
| Providence, RI | $420,000 | -1.2% | 10.5% |
| Raleigh, NC | $450,000 | 0.0% | 19.4% |
| Richmond, VA | $365,000 | 0.8% | 13.2% |
| Riverside, CA | $550,000 | -3.5% | 7.8% |
| Rochester, NY | $222,000 | 0.0% | 11.0% |
| Sacramento, CA | $589,000 | -1.8% | 6.2% |
| Salt Lake City, UT | $525,000 | -2.8% | 10.5% |
| San Antonio, TX | $335,000 | -2.9% | 13.0% |
| San Diego, CA | $830,000 | -3.5% | 9.2% |
| San Francisco, CA | $1,495,500 | -5.4% | -6.5% |
| San Jose, CA | $1,400,000 | -6.7% | 2.6% |
| Seattle, WA | $789,500 | -3.1% | 6.0% |
| St. Louis, MO | $250,000 | -4.9% | 6.4% |
| Stockton, CA | $530,000 | -5.0% | 4.8% |
| Tacoma, WA | $565,000 | 0.0% | 11.9% |
| Tampa, FL | $386,000 | -1.5% | 24.5% |
| Tucson, AZ | $360,000 | -1.4% | 18.0% |
| Tulsa, OK | $251,000 | -4.0% | 11.6% |
| Virginia Beach, VA | $320,000 | -1.5% | 8.5% |
| Warren, MI | $297,000 | -1.9% | 6.5% |
| Washington, D.C. | $530,000 | -3.6% | 5.0% |
| West Palm Beach, FL | $435,000 | -5.4% | 16.0% |
| Worcester, MA | $420,000 | 0.0% | 12.9% |
| National | $412,700 | -3.3% | 7.7% |
Homes Sold
| Redfin Metro | Homes Sold | Month-Over-Month | Year-Over-Year |
|---|---|---|---|
| Albany, NY | 914 | -2.6% | -18.5% |
| Allentown, PA | 948 | -3.7% | -17.1% |
| Anaheim, CA | 2,007 | -16.2% | -38.1% |
| Atlanta, GA | 8,402 | -16.1% | -25.0% |
| Austin, TX | 2,681 | -21.7% | -31.9% |
| Bakersfield, CA | 703 | -18.1% | -21.3% |
| Baltimore, MD | 3,605 | -15.1% | -26.0% |
| Baton Rouge, LA | 993 | -9.4% | -24.9% |
| Birmingham, AL | 1,381 | -19.3% | -21.4% |
| Boise, ID | 1,050 | -14.3% | -42.0% |
| Boston, MA | 4,544 | -20.1% | -22.7% |
| Bridgeport, CT | 1,312 | -6.6% | -25.1% |
| Buffalo, NY | 1,075 | 4.2% | -8.1% |
| Camden, NJ | 1,701 | -12.1% | -19.2% |
| Cape Coral, FL | 1,691 | -23.4% | -26.4% |
| Charleston, SC | 1,421 | -16.9% | -27.8% |
| Charlotte, NC | 3,985 | -19.8% | -18.7% |
| Chicago, IL | 8,860 | -19.2% | -23.5% |
| Cincinnati, OH | 2,801 | -10.3% | -13.1% |
| Cleveland, OH | 2,766 | -9.4% | -17.4% |
| Columbus, OH | 2,945 | -6.8% | -14.3% |
| Dallas, TX | 5,622 | -13.0% | -19.4% |
| Dayton, OH | 1,143 | -5.2% | -12.3% |
| Denver, CO | 4,445 | -18.0% | -28.3% |
| Detroit, MI | 1,820 | -12.2% | -11.0% |
| El Paso, TX | 805 | -10.6% | -9.2% |
| Fort Lauderdale, FL | 2,687 | -21.9% | -33.5% |
| Fort Worth, TX | 2,866 | -10.4% | -16.5% |
| Frederick, MD | 1,565 | -16.8% | -25.6% |
| Fresno, CA | 637 | -24.2% | -26.1% |
| Grand Rapids, MI | 1,479 | -0.9% | -5.7% |
| Greensboro, NC | 964 | -11.6% | -17.3% |
| Greenville, SC | 1,212 | -20.6% | -12.8% |
| Hartford, CT | 1,514 | -13.8% | -22.4% |
| Honolulu, HI | 814 | -16.3% | -23.2% |
| Houston, TX | 8,406 | -17.2% | -20.7% |
| Indianapolis, IN | 3,419 | -9.9% | -13.4% |
| Jacksonville, FL | 2,415 | -22.9% | -27.7% |
| Kansas City, MO | 3,343 | -11.9% | -16.1% |
| Knoxville, TN | 1,338 | -1.5% | -9.7% |
| Lake County, IL | 1,184 | -22.5% | -30.6% |
| Las Vegas, NV | 2,725 | -22.0% | -37.8% |
| Los Angeles, CA | 4,962 | -18.9% | -32.2% |
| Louisville, KY | 1,772 | -5.3% | -14.0% |
| McAllen, TX | 377 | -15.7% | -11.1% |
| Memphis, TN | 1,508 | -11.9% | -16.5% |
| Miami, FL | 2,492 | -22.3% | -37.2% |
| Milwaukee, WI | 2,063 | -9.0% | -18.7% |
| Minneapolis, MN | 5,595 | -15.3% | -18.9% |
| Montgomery County, PA | 2,387 | -17.3% | -24.0% |
| Nashville, TN | 3,228 | -21.7% | -21.3% |
| Nassau County, NY | 2,509 | -13.5% | -21.7% |
| New Brunswick, NJ | 3,128 | -11.5% | -18.4% |
| New Haven, CT | 1,044 | -12.5% | -18.4% |
| New Orleans, LA | 1,306 | -17.8% | -21.7% |
| New York, NY | 7,006 | -8.9% | -15.4% |
| Newark, NJ | 2,325 | -7.6% | -18.4% |
| North Port, FL | 1,766 | -18.8% | -23.6% |
| Oakland, CA | 2,053 | -18.0% | -37.3% |
| Oklahoma City, OK | 2,162 | -9.2% | -8.6% |
| Omaha, NE | 1,366 | -15.0% | -22.8% |
| Orlando, FL | 3,771 | -15.2% | -23.2% |
| Oxnard, CA | 641 | -15.7% | -32.2% |
| Philadelphia, PA | 2,163 | -21.2% | -21.3% |
| Phoenix, AZ | 5,681 | -25.8% | -33.3% |
| Pittsburgh, PA | 2,494 | -12.0% | -15.4% |
| Portland, OR | 3,061 | -18.8% | -32.6% |
| Providence, RI | 1,832 | -7.7% | -16.5% |
| Raleigh, NC | 2,288 | -14.5% | -10.1% |
| Richmond, VA | 1,886 | -13.7% | -22.1% |
| Riverside, CA | 4,095 | -20.8% | -32.2% |
| Rochester, NY | 1,167 | 0.6% | -10.6% |
| Sacramento, CA | 2,137 | -18.7% | -32.2% |
| Salt Lake City, UT | 1,083 | -25.6% | -36.7% |
| San Antonio, TX | 3,001 | -6.5% | -21.1% |
| San Diego, CA | 2,240 | -19.4% | -41.2% |
| San Francisco, CA | 874 | -18.9% | -33.2% |
| San Jose, CA | 1,045 | -25.2% | -44.2% |
| Seattle, WA | 3,604 | -22.3% | -37.3% |
| St. Louis, MO | 3,809 | -14.2% | -17.9% |
| Stockton, CA | 491 | -27.3% | -34.5% |
| Tacoma, WA | 1,253 | -20.3% | -30.0% |
| Tampa, FL | 5,041 | -18.6% | -24.4% |
| Tucson, AZ | 1,288 | -15.7% | -22.2% |
| Tulsa, OK | 1,344 | -5.2% | -15.7% |
| Virginia Beach, VA | 2,829 | -15.4% | -23.2% |
| Warren, MI | 3,443 | -15.0% | -17.8% |
| Washington, D.C. | 5,879 | -17.8% | -30.1% |
| West Palm Beach, FL | 2,290 | -22.6% | -35.7% |
| Worcester, MA | 1,120 | -15.4% | -15.5% |
| National | 501,100 | -4.1% | -19.3% |
New Listings
| Redfin Metro | New Listings | Month-Over-Month | Year-Over-Year |
|---|---|---|---|
| Albany, NY | 1,214 | -16.7% | -13.8% |
| Allentown, PA | 553 | -39.8% | -56.9% |
| Anaheim, CA | 2,565 | -17.1% | -29.2% |
| Atlanta, GA | 10,526 | -18.1% | -15.9% |
| Austin, TX | 4,796 | -18.8% | -4.1% |
| Bakersfield, CA | 978 | -11.5% | -9.4% |
| Baltimore, MD | 4,184 | -13.1% | -29.4% |
| Birmingham, AL | 1,706 | -14.4% | -19.0% |
| Boise, ID | 1,451 | -27.8% | -32.3% |
| Boston, MA | 4,743 | -29.8% | -15.2% |
| Bridgeport, CT | 1,284 | -24.8% | -26.0% |
| Buffalo, NY | 1,473 | -11.4% | -8.8% |
| Camden, NJ | 1,897 | -13.7% | -24.9% |
| Cape Coral, FL | 2,090 | -16.7% | -10.9% |
| Charleston, SC | 1,659 | -17.1% | -23.1% |
| Charlotte, NC | 4,991 | -6.4% | -9.2% |
| Chicago, IL | 10,263 | -19.3% | -25.8% |
| Cincinnati, OH | 3,126 | -15.9% | -18.6% |
| Cleveland, OH | 3,449 | -9.3% | -15.5% |
| Colorado Springs, CO | 1,936 | -13.0% | -9.3% |
| Columbus, OH | 3,269 | -15.3% | -22.6% |
| Dallas, TX | 8,237 | -17.8% | -6.7% |
| Dayton, OH | 1,250 | -15.0% | -19.4% |
| Denver, CO | 5,914 | -19.4% | -14.3% |
| Detroit, MI | 2,634 | -11.0% | -7.9% |
| El Paso, TX | 946 | -18.4% | -14.2% |
| Fort Lauderdale, FL | 3,782 | -10.2% | -6.9% |
| Fort Worth, TX | 4,141 | -14.6% | -8.4% |
| Frederick, MD | 1,639 | -20.9% | -34.1% |
| Fresno, CA | 909 | -10.9% | -13.0% |
| Grand Rapids, MI | 1,543 | -22.8% | -14.2% |
| Greensboro, NC | 788 | -27.8% | -37.5% |
| Greenville, SC | 1,447 | -16.5% | -11.7% |
| Hartford, CT | 1,604 | -19.8% | -23.7% |
| Honolulu, HI | 838 | -13.5% | -25.2% |
| Houston, TX | 12,410 | -10.1% | -8.8% |
| Indianapolis, IN | 3,946 | -18.2% | -10.9% |
| Jacksonville, FL | 3,281 | -16.9% | -17.5% |
| Kansas City, MO | 3,640 | -14.8% | -20.1% |
| Knoxville, TN | 1,245 | -22.2% | -24.2% |
| Lake County, IL | 1,242 | -23.4% | -36.6% |
| Las Vegas, NV | 5,096 | -11.0% | -2.3% |
| Los Angeles, CA | 6,103 | -21.5% | -31.6% |
| Louisville, KY | 1,998 | -15.2% | -18.9% |
| McAllen, TX | 642 | -8.3% | 15.7% |
| Memphis, TN | 1,803 | -16.8% | -12.6% |
| Miami, FL | 3,684 | -19.1% | -14.5% |
| Milwaukee, WI | 2,163 | -16.6% | -24.6% |
| Minneapolis, MN | 5,975 | -16.8% | -22.3% |
| Montgomery County, PA | 2,358 | -23.8% | -29.4% |
| Nashville, TN | 4,600 | -13.1% | 12.0% |
| Nassau County, NY | 3,065 | -21.2% | -19.1% |
| New Brunswick, NJ | 3,559 | -15.4% | -23.7% |
| New Haven, CT | 1,133 | -19.8% | -27.3% |
| New Orleans, LA | 1,604 | -21.0% | -19.6% |
| New York, NY | 7,585 | -22.8% | -19.9% |
| Newark, NJ | 2,464 | -20.8% | -19.2% |
| North Port, FL | 2,745 | -7.3% | 15.9% |
| Oakland, CA | 2,925 | -15.9% | -23.7% |
| Oklahoma City, OK | 2,756 | -7.7% | -6.6% |
| Omaha, NE | 1,426 | -17.4% | -16.9% |
| Orlando, FL | 5,273 | -14.5% | -5.2% |
| Oxnard, CA | 778 | -13.7% | -21.9% |
| Philadelphia, PA | 2,617 | -21.4% | -19.4% |
| Phoenix, AZ | 9,522 | -16.5% | -5.8% |
| Pittsburgh, PA | 3,097 | -10.5% | -13.2% |
| Portland, OR | 4,000 | -17.1% | -19.8% |
| Providence, RI | 1,948 | -22.3% | -26.5% |
| Raleigh, NC | 2,752 | -11.5% | -3.2% |
| Richmond, VA | 1,923 | -16.2% | -20.9% |
| Riverside, CA | 5,865 | -17.6% | -19.2% |
| Rochester, NY | 1,281 | -17.2% | -21.0% |
| Sacramento, CA | 3,166 | -11.5% | -18.5% |
| San Antonio, TX | 4,279 | -10.3% | -7.0% |
| San Diego, CA | 3,070 | -19.9% | -29.8% |
| San Francisco, CA | 1,168 | -20.9% | -22.5% |
| San Jose, CA | 1,453 | -14.6% | -28.8% |
| Seattle, WA | 4,969 | -21.0% | -18.6% |
| St. Louis, MO | 4,214 | -9.3% | -19.2% |
| Stockton, CA | 798 | -16.7% | -22.1% |
| Tacoma, WA | 1,715 | -19.4% | -16.2% |
| Tampa, FL | 7,429 | -11.8% | -3.0% |
| Tucson, AZ | 1,719 | -9.8% | -8.4% |
| Tulsa, OK | 1,673 | -10.8% | -15.5% |
| Virginia Beach, VA | 2,993 | -18.8% | -28.2% |
| Warren, MI | 4,670 | -14.0% | -13.9% |
| Washington, D.C. | 6,317 | -23.0% | -35.3% |
| West Palm Beach, FL | 3,464 | -14.3% | -4.4% |
| Worcester, MA | 1,294 | -17.8% | -11.0% |
| National | 626,900 | -0.3% | -13.5% |
All Homes for Sale
| Redfin Metro | All Homes for Sale | Month-Over-Month | Year-Over-Year |
|---|---|---|---|
| Albany, NY | 2,948 | 0.2% | -13.1% |
| Allentown, PA | 1,507 | -19.5% | -42.9% |
| Anaheim, CA | 7,171 | 0.2% | -10.4% |
| Atlanta, GA | 26,736 | 3.1% | 3.3% |
| Austin, TX | 13,726 | 10.7% | 36.8% |
| Bakersfield, CA | 2,605 | 4.2% | 17.5% |
| Baltimore, MD | 9,586 | 0.2% | -17.0% |
| Birmingham, AL | 4,619 | -1.9% | -11.8% |
| Boise, ID | 4,386 | 6.8% | -10.6% |
| Boston, MA | 11,753 | -6.9% | -6.7% |
| Bridgeport, CT | 4,371 | -3.6% | -25.7% |
| Buffalo, NY | 2,844 | 0.5% | -1.9% |
| Camden, NJ | 4,514 | -0.9% | -17.4% |
| Cape Coral, FL | 5,911 | 4.1% | 24.3% |
| Charleston, SC | 5,031 | -1.1% | -12.0% |
| Charlotte, NC | 11,998 | 8.7% | -5.5% |
| Chicago, IL | 36,446 | -5.0% | 9.2% |
| Cincinnati, OH | 8,344 | -2.1% | -12.4% |
| Cleveland, OH | 7,827 | 4.7% | -13.8% |
| Colorado Springs, CO | 4,632 | 9.1% | 28.9% |
| Columbus, OH | 8,253 | -0.2% | -10.6% |
| Dallas, TX | 20,329 | 6.7% | 18.5% |
| Dayton, OH | 2,994 | 0.8% | -1.8% |
| Denver, CO | 12,336 | 7.1% | 15.5% |
| Detroit, MI | 6,735 | 3.5% | 11.2% |
| El Paso, TX | 2,583 | 1.6% | -7.4% |
| Fort Lauderdale, FL | 11,409 | 1.6% | -12.7% |
| Fort Worth, TX | 9,759 | 8.6% | 14.2% |
| Frederick, MD | 3,649 | -5.5% | -22.7% |
| Fresno, CA | 2,133 | 6.7% | 12.4% |
| Grand Rapids, MI | 2,940 | -3.9% | 0.8% |
| Greensboro, NC | 2,195 | -9.4% | -24.3% |
| Greenville, SC | 4,083 | 1.8% | -2.6% |
| Hartford, CT | 4,148 | -3.6% | -28.0% |
| Honolulu, HI | 3,147 | -5.0% | -13.4% |
| Houston, TX | 31,537 | 7.9% | 8.2% |
| Indianapolis, IN | 7,944 | 1.5% | 6.8% |
| Jacksonville, FL | 8,641 | 3.7% | 1.6% |
| Kansas City, MO | 8,246 | -0.4% | -9.7% |
| Knoxville, TN | 3,929 | -1.7% | -11.2% |
| Lake County, IL | 4,248 | -7.7% | -1.5% |
| Las Vegas, NV | 13,925 | 13.4% | 28.0% |
| Los Angeles, CA | 19,171 | -2.6% | -14.2% |
| Louisville, KY | 4,418 | 1.9% | -3.5% |
| McAllen, TX | 2,074 | 6.4% | 16.3% |
| Memphis, TN | 4,486 | 1.5% | -8.6% |
| Miami, FL | 14,062 | 0.3% | -14.0% |
| Milwaukee, WI | 6,225 | -2.1% | -22.4% |
| Minneapolis, MN | 14,085 | -1.1% | -2.2% |
| Montgomery County, PA | 5,406 | -4.3% | -22.6% |
| Nashville, TN | 11,501 | 10.0% | 33.3% |
| Nassau County, NY | 9,508 | -1.0% | -13.4% |
| New Brunswick, NJ | 11,132 | -2.4% | -2.4% |
| New Haven, CT | 3,310 | -1.8% | -22.2% |
| New Orleans, LA | 4,766 | 1.3% | 0.9% |
| New York, NY | 35,095 | -3.6% | -12.4% |
| Newark, NJ | 7,538 | -0.1% | -13.3% |
| North Port, FL | 6,402 | 12.9% | 58.1% |
| Oakland, CA | 6,816 | 4.2% | 9.7% |
| Oklahoma City, OK | 6,068 | 9.1% | 13.4% |
| Omaha, NE | 2,856 | -2.1% | -6.6% |
| Orlando, FL | 12,210 | 8.2% | 18.9% |
| Oxnard, CA | 2,179 | 1.9% | -6.2% |
| Philadelphia, PA | 8,606 | -3.0% | -2.4% |
| Phoenix, AZ | 26,440 | 7.4% | 29.8% |
| Pittsburgh, PA | 10,254 | 0.6% | -6.8% |
| Portland, OR | 9,088 | 7.5% | 8.2% |
| Providence, RI | 4,894 | -3.3% | -15.2% |
| Raleigh, NC | 6,709 | 3.3% | 5.4% |
| Richmond, VA | 3,709 | -2.1% | -15.1% |
| Riverside, CA | 17,495 | 1.5% | 10.1% |
| Rochester, NY | 2,293 | -8.7% | -16.9% |
| Sacramento, CA | 7,765 | 8.2% | 17.0% |
| San Antonio, TX | 10,657 | 7.9% | 15.6% |
| San Diego, CA | 7,597 | 3.4% | -3.4% |
| San Francisco, CA | 3,432 | -2.7% | 2.0% |
| San Jose, CA | 3,567 | 0.0% | -2.6% |
| Seattle, WA | 10,984 | 6.6% | 18.7% |
| St. Louis, MO | 9,462 | 2.0% | -13.2% |
| Stockton, CA | 2,107 | 8.2% | 20.4% |
| Tacoma, WA | 3,810 | 7.9% | 24.2% |
| Tampa, FL | 16,300 | 10.1% | 24.5% |
| Tucson, AZ | 4,680 | 3.7% | 4.9% |
| Tulsa, OK | 3,449 | 7.2% | -4.3% |
| Virginia Beach, VA | 6,836 | -3.9% | -21.4% |
| Warren, MI | 10,562 | 5.8% | 2.4% |
| Washington, D.C. | 16,748 | -4.3% | -17.6% |
| West Palm Beach, FL | 11,092 | 3.0% | 4.0% |
| Worcester, MA | 2,901 | 0.3% | -4.8% |
| National | 1,513,900 | 1.6% | 3.9% |
Median Off-Market Redfin Estimate
| Redfin Metro | Estimate | Month-Over-Month | Year-Over-Year |
|---|---|---|---|
| Albany, NY | $246,500 | 1.7% | 9.2% |
| Allentown, PA | $291,700 | 1.5% | 18.5% |
| Anaheim, CA | $1,081,000 | 0.4% | 25.3% |
| Atlanta, GA | $358,200 | 1.1% | 28.9% |
| Austin, TX | $526,700 | -0.4% | 30.1% |
| Bakersfield, CA | $281,800 | 0.5% | 24.1% |
| Baltimore, MD | $351,400 | 0.6% | 13.2% |
| Baton Rouge, LA | $155,500 | 0.8% | 6.1% |
| Birmingham, AL | $182,600 | 1.2% | 17.3% |
| Boston, MA | $658,200 | 0.8% | 10.2% |
| Bridgeport, CT | $496,600 | 1.0% | 14.1% |
| Buffalo, NY | $211,300 | 1.3% | 19.9% |
| Camden, NJ | $299,100 | 1.4% | 21.2% |
| Charleston, SC | $348,500 | 1.5% | 25.8% |
| Charlotte, NC | $333,500 | 1.5% | 28.4% |
| Chicago, IL | $300,500 | 0.8% | 4.3% |
| Cincinnati, OH | $228,100 | 0.8% | 18.2% |
| Cleveland, OH | $192,800 | 1.1% | 17.6% |
| Columbus, OH | $270,000 | 1.1% | 18.1% |
| Dallas, TX | $399,800 | 0.9% | 32.2% |
| Dayton, OH | $169,100 | 0.9% | 15.2% |
| Denver, CO | $593,100 | 0.0% | 23.1% |
| Detroit, MI | $138,900 | 1.9% | 14.5% |
| Fort Lauderdale, FL | $394,200 | 1.8% | 26.7% |
| Fort Worth, TX | $332,900 | 1.0% | 29.3% |
| Frederick, MD | $530,900 | 0.5% | 12.9% |
| Fresno, CA | $383,500 | 0.9% | 22.9% |
| Grand Rapids, MI | $252,700 | 0.4% | 19.2% |
| Greensboro, NC | $200,700 | 1.5% | 21.5% |
| Greenville, SC | $234,500 | 1.6% | 25.3% |
| Hartford, CT | $291,800 | 1.3% | 18.0% |
| Houston, TX | $284,200 | 1.1% | 23.3% |
| Indianapolis, IN | $236,800 | 1.0% | 22.7% |
| Jacksonville, FL | $333,600 | 1.6% | 32.2% |
| Kansas City, MO | $257,100 | 0.7% | 20.4% |
| Knoxville, TN | $274,600 | 1.5% | 27.5% |
| Lake County, IL | $267,500 | 1.1% | 9.0% |
| Las Vegas, NV | $430,200 | 1.0% | 28.5% |
| Los Angeles, CA | $875,900 | 0.8% | 16.6% |
| Louisville, KY | $212,400 | 0.8% | 8.9% |
| Memphis, TN | $214,500 | 2.0% | 20.9% |
| Miami, FL | $449,900 | 1.7% | 25.9% |
| Milwaukee, WI | $270,600 | 0.8% | 14.6% |
| Minneapolis, MN | $351,900 | 0.4% | 14.0% |
| Montgomery County, PA | $430,200 | 1.0% | 15.7% |
| Nashville, TN | $427,800 | 1.4% | 33.0% |
| Nassau County, NY | $622,600 | 0.9% | 12.4% |
| New Brunswick, NJ | $479,200 | 1.4% | 19.1% |
| New Haven, CT | $302,500 | 1.3% | 19.1% |
| New Orleans, LA | $212,000 | 0.8% | 9.3% |
| Newark, NJ | $475,900 | 1.6% | 12.1% |
| North Port, FL | $408,300 | 1.5% | 44.9% |
| Oakland, CA | $1,109,600 | -0.6% | 18.3% |
| Oklahoma City, OK | $197,500 | 1.0% | 19.3% |
| Omaha, NE | $254,900 | 0.7% | 15.8% |
| Orlando, FL | $360,400 | 1.6% | 33.2% |
| Oxnard, CA | $839,900 | 0.5% | 19.6% |
| Philadelphia, PA | $241,800 | 0.6% | 7.8% |
| Phoenix, AZ | $473,700 | 0.9% | 37.3% |
| Pittsburgh, PA | $167,200 | 1.1% | 10.2% |
| Portland, OR | $550,200 | 0.2% | 18.4% |
| Providence, RI | $406,500 | 1.3% | 16.5% |
| Raleigh, NC | $405,900 | 1.3% | 34.2% |
| Richmond, VA | $311,900 | 1.1% | 15.9% |
| Riverside, CA | $519,500 | 0.7% | 26.2% |
| Rochester, NY | $198,300 | 1.0% | 19.4% |
| Sacramento, CA | $598,000 | 0.0% | 19.8% |
| Salt Lake City, UT | $564,500 | -0.3% | 29.4% |
| San Antonio, TX | $265,400 | 1.2% | 24.8% |
| San Diego, CA | $912,800 | 0.4% | 23.1% |
| San Francisco, CA | $1,637,100 | -0.7% | 11.8% |
| San Jose, CA | $1,664,300 | -0.7% | 22.9% |
| Seattle, WA | $829,100 | -0.8% | 21.2% |
| St. Louis, MO | $195,500 | 1.1% | 15.0% |
| Tacoma, WA | $543,300 | 0.1% | 20.1% |
| Tampa, FL | $353,200 | 1.5% | 38.2% |
| Tucson, AZ | $314,300 | 1.0% | 24.6% |
| Tulsa, OK | $172,200 | 1.0% | 15.0% |
| Virginia Beach, VA | $303,900 | 0.9% | 15.9% |
| Warren, MI | $274,900 | 1.1% | 13.0% |
| Washington, D.C. | $511,600 | 0.5% | 12.3% |
| West Palm Beach, FL | $435,300 | 1.6% | 36.2% |
| Worcester, MA | $381,400 | 1.3% | 15.9% |
| National | $420,800 | 0.1% | 19.8% |


