
Homebuyers across the country need to earn substantially more money than they did a year ago to buy a home, due to high mortgage rates and persistently high home prices. The increases are especially big in Florida.
A homebuyer must earn $107,281 to afford the $2,682 monthly mortgage payment on the typical U.S. home, up 45.6% from $73,668 a year ago. That’s due to mortgage rates that have more than doubled over the last 12 months, combined with persistently high home prices.
The average U.S. hourly wage grew by about 5% over that same period, and inflation is also cutting into would-be buyers’ budgets.
After remaining mostly unchanged for several years, the annual household income necessary to afford a monthly mortgage payment began climbing at the beginning of last year due to the pandemic homebuying boom and rapid rise in prices. Scroll to the end of this report for details on our methodology.
The income required to buy a home then skyrocketed in 2022 as mortgage rates rose at their fastest pace in history, reaching 7% by the end of October (though rates posted their biggest single-day decline on record on Thursday upon news that inflation cooled). Home prices also continued to increase for much of the year, though they’ve now started declining from their peak and year-over-year growth has now slowed to around 3%.
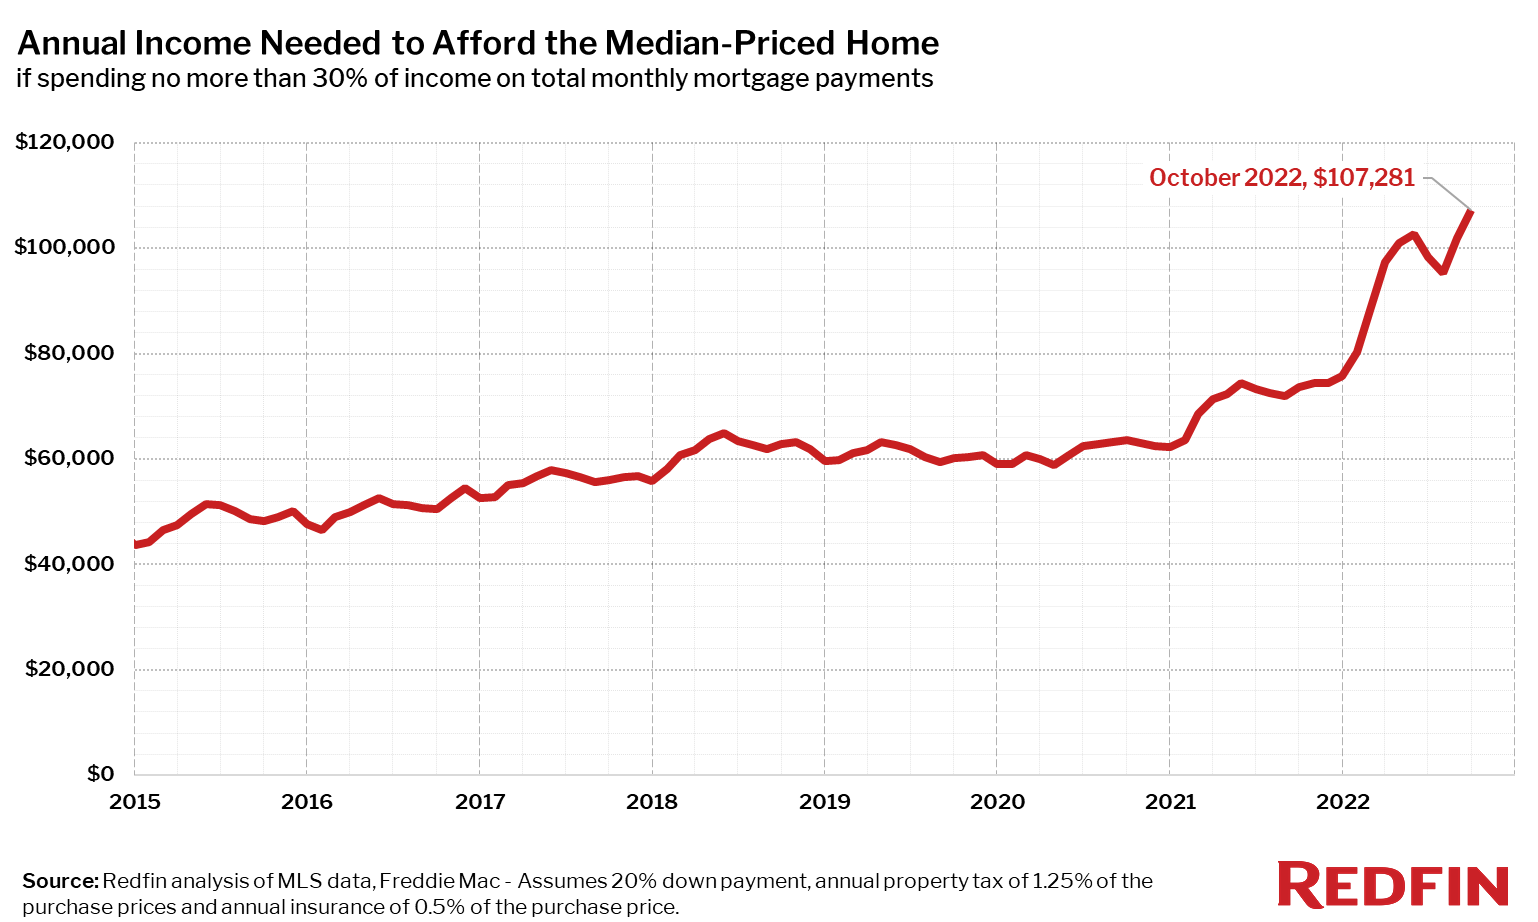
From February 2020 (just before the pandemic started) to October 2022, the monthly payment for an American family buying the median-priced home increased by roughly 70%. Affordability challenges are a major reason why home sales have slowed so dramatically over the last few months.
“High rates are making buyers rethink their priorities, as many of them can no longer afford the home they want in the location they want,” said Washington, D.C. Redfin agent Chelsea Traylor. “If you had a $900,000 budget a few months ago, rising rates mean it’s now around $700,000–and sellers aren’t dropping their prices enough to make up for the change. So buyers are searching further away from the city in more affordable areas or waiting for prices and/or rates to come down before making a move.”
“I’m encouraging buyers to think long term,” Traylor continued. “Prices are unlikely to fall drastically in the long run, so buying a home now–if you can afford the monthly payment–will still help you build wealth over time, especially if you plan to live in it for several years. Even though rates are high, another advantage of buying now is the lack of competition and opportunity to negotiate with sellers.”
Increases in income required to buy a home are especially eye-popping in Florida
Buyers in North Port, FL need to earn $131,535 annually to afford the metro area’s typical monthly mortgage payment of $3,288. That’s up 73.9% from $75,659 a year earlier, the biggest percent increase of any major U.S. metro.
It’s followed by Miami, where homebuyers need to earn $128,892, up 63.7% year over year. El Paso, TX ($64,580, up 63.6%), Tampa ($101,682, up 62.4%) and Cape Coral, FL ($104,943, up 60.6%) round out the top five.
Sixteen of the 20 metros where the income necessary to afford a home has increased most are in the Sun Belt. Sun Belt destinations have long been popular with homebuyers due to their relative affordability and warm weather, and remote work has made them even more popular, driving up prices in the process. Several Florida metros, including North Port and Cape Coral, were hit hard by Hurricane Ian in September, resulting in sharp drops in pending sales and new listings. It remains to be seen whether that will translate to outsized price declines.
Chicago area, Bay Area had smallest upticks in income necessary to afford a home
Buyers need to earn at least 50% more income to afford a home than they did a year ago in 40 of the 93 metros included in this analysis. They need to earn at least 30% more in all 93.
Lake County, IL–near Chicago–had the smallest gain in income necessary to afford the median-priced home, though buyers still need 33.5% more than a year ago.
The Bay Area also had smaller-than-average increases, but the income necessary to buy there is still enormous. Buyers need to earn $402,821 to pay San Francisco’s typical $10,071 monthly mortgage payment, up 33.6% from a year ago. It’s followed by San Jose ($363,265, up 36.1%) and Oakland ($247,559, up 36.2%). The increases are smaller in Lake County and the Bay Area than other places because they’re among the only parts of the country where home prices are falling year over year.
Homebuyers in 45 major metros need $100,000-plus income to afford the typical home
The incomes buyers need to purchase a home in San Francisco and San Jose are the highest in the country, followed by Anaheim, CA, where the typical buyer must earn $254,286 to afford the typical monthly mortgage payment of $6,357 (+42.1% YoY). Oakland and Los Angeles ($221,592, up 40.7%) round out the top five.
Homebuyers must earn at least $100,000 annually to buy a home in roughly half (45) of the metros in this analysis. That’s up from 16 metros a year ago.
Detroit requires the lowest income to afford the area’s median-priced home ($48,435), but that’s still up 42.3% from a year ago. It’s followed by Dayton, OH ($51,126, up 46.1%), Cleveland ($53,817, up 45.7%), Rochester, NY ($56,508, up 56.2%) and Pittsburgh ($57,853, up 41.7%).
| Annual income required to afford the median-priced home for sale, October 2022 vs. October 2021
Ranked by largest to smallest year-over–year change |
|||||||
| U.S. metro area | Annual income required to afford median-price home, October 2022 | Annual income required to afford median-price home, October 2021 | Year-ove-year change in income required to afford median-priced home | Median Sale Price, October 2022 | Median Sale Price, October 2021 | Monthly Mortgage Payment, October 2022 | Monthly Mortgage Payment, October 2021 |
| North Port, FL | $131,535 | $75,659 | 73.9% | $488,824 | $389,075 | $3,288 | $1,891 |
| Miami, FL | $128,892 | $78,755 | 63.7% | $479,000 | $405,000 | $3,222 | $1,969 |
| El Paso, TX | $64,580 | $39,475 | 63.6% | $240,000 | $203,000 | $1,615 | $987 |
| Tampa, FL | $101,682 | $62,615 | 62.4% | $377,880 | $322,000 | $2,542 | $1,565 |
| Cape Coral, FL | $104,943 | $65,338 | 60.6% | $390,000 | $336,000 | $2,624 | $1,633 |
| Omaha, NE | $75,344 | $47,253 | 59.4% | $280,000 | $243,000 | $1,884 | $1,181 |
| West Palm Beach, FL | $115,707 | $72,922 | 58.7% | $430,000 | $375,000 | $2,893 | $1,823 |
| Charleston, SC | $112,451 | $70,977 | 58.4% | $417,900 | $365,000 | $2,811 | $1,774 |
| Albuquerque, NM | $86,107 | $54,448 | 58.1% | $320,000 | $280,000 | $2,153 | $1,361 |
| Knoxville, TN | $87,453 | $55,420 | 57.8% | $325,000 | $285,000 | $2,186 | $1,386 |
| Fort Worth, TX | $97,409 | $61,838 | 57.5% | $362,000 | $318,000 | $2,435 | $1,546 |
| Jacksonville, FL | $97,651 | $62,123 | 57.2% | $362,900 | $319,469 | $2,441 | $1,553 |
| Fort Lauderdale, FL | $105,751 | $67,574 | 56.5% | $393,000 | $347,500 | $2,644 | $1,689 |
| Orlando, FL | $104,943 | $67,088 | 56.4% | $390,000 | $345,000 | $2,624 | $1,677 |
| Rochester, NY | $56,508 | $36,169 | 56.2% | $210,000 | $186,000 | $1,413 | $904 |
| Greensboro, NC | $69,693 | $44,725 | 55.8% | $259,000 | $230,000 | $1,742 | $1,118 |
| McAllen, TX | $60,544 | $38,882 | 55.7% | $225,000 | $199,950 | $1,514 | $972 |
| Charlotte, NC | $104,405 | $67,273 | 55.2% | $388,000 | $345,950 | $2,610 | $1,682 |
| Bridgeport, CT | $141,270 | $91,395 | 54.6% | $525,000 | $470,000 | $3,532 | $2,285 |
| Grand Rapids, MI | $78,035 | $50,559 | 54.3% | $290,000 | $260,000 | $1,951 | $1,264 |
| Birmingham, AL | $77,362 | $50,160 | 54.2% | $287,500 | $257,950 | $1,934 | $1,254 |
| Camden, NJ | $79,380 | $51,531 | 54.0% | $295,000 | $265,000 | $1,985 | $1,288 |
| Nashville, TN | $119,743 | $77,783 | 53.9% | $445,000 | $400,000 | $2,994 | $1,945 |
| Indianapolis, IN | $75,344 | $49,003 | 53.8% | $280,000 | $252,000 | $1,884 | $1,225 |
| Dallas, TX | $113,016 | $73,505 | 53.8% | $420,000 | $378,000 | $2,825 | $1,838 |
| Hartford, CT | $80,726 | $52,504 | 53.8% | $300,000 | $270,000 | $2,018 | $1,313 |
| Worcester, MA | $107,634 | $70,005 | 53.8% | $400,000 | $360,000 | $2,691 | $1,750 |
| Raleigh, NC | $115,136 | $75,015 | 53.5% | $427,880 | $385,768 | $2,878 | $1,875 |
| Tulsa, OK | $68,617 | $44,725 | 53.4% | $255,000 | $230,000 | $1,715 | $1,118 |
| Kansas City, MO | $80,726 | $52,698 | 53.2% | $300,000 | $271,000 | $2,018 | $1,317 |
| Columbus, OH | $80,726 | $53,139 | 51.9% | $300,000 | $273,267 | $2,018 | $1,328 |
| Greenville, SC | $83,416 | $55,032 | 51.6% | $310,000 | $283,000 | $2,085 | $1,376 |
| Allentown, PA | $76,620 | $50,559 | 51.5% | $284,743 | $260,000 | $1,916 | $1,264 |
| Oklahoma City, OK | $66,195 | $43,753 | 51.3% | $246,000 | $225,000 | $1,655 | $1,094 |
| Providence, RI | $111,670 | $73,894 | 51.1% | $415,000 | $380,000 | $2,792 | $1,847 |
| Atlanta, GA | $99,427 | $66,116 | 50.4% | $369,500 | $340,000 | $2,486 | $1,653 |
| Richmond, VA | $93,373 | $62,226 | 50.1% | $347,000 | $320,000 | $2,334 | $1,556 |
| Tucson, AZ | $93,373 | $62,226 | 50.1% | $347,000 | $320,000 | $2,334 | $1,556 |
| New Haven, CT | $80,726 | $53,816 | 50.0% | $300,000 | $276,750 | $2,018 | $1,345 |
| Columbia, SC | $66,464 | $44,336 | 49.9% | $247,000 | $228,000 | $1,662 | $1,108 |
| New Brunswick, NJ | $123,779 | $82,645 | 49.8% | $460,000 | $425,000 | $3,094 | $2,066 |
| Houston, TX | $88,798 | $59,310 | 49.7% | $330,000 | $305,000 | $2,220 | $1,483 |
| San Antonio, TX | $87,453 | $58,532 | 49.4% | $325,000 | $301,000 | $2,186 | $1,463 |
| Montgomery County, PA | $113,016 | $75,839 | 49.0% | $420,000 | $390,000 | $2,825 | $1,896 |
| Albany, NY | $76,757 | $51,531 | 49.0% | $285,250 | $265,000 | $1,919 | $1,288 |
| Bakersfield, CA | $95,525 | $64,171 | 48.9% | $355,000 | $330,000 | $2,388 | $1,604 |
| St. Louis, MO | $63,639 | $42,761 | 48.8% | $236,500 | $219,900 | $1,591 | $1,069 |
| Salt Lake City, UT | $137,368 | $92,367 | 48.7% | $510,500 | $475,000 | $3,434 | $2,309 |
| Las Vegas, NV | $110,325 | $74,186 | 48.7% | $410,000 | $381,500 | $2,758 | $1,855 |
| Denver, CO | $152,639 | $103,063 | 48.1% | $567,250 | $530,000 | $3,816 | $2,577 |
| Baton Rouge, LA | $68,346 | $46,184 | 48.0% | $253,995 | $237,500 | $1,709 | $1,155 |
| Buffalo, NY | $61,217 | $41,419 | 47.8% | $227,500 | $213,000 | $1,530 | $1,035 |
| Louisville, KY | $68,617 | $46,475 | 47.6% | $255,000 | $239,000 | $1,715 | $1,162 |
| Milwaukee, WI | $73,998 | $50,267 | 47.2% | $275,000 | $258,500 | $1,850 | $1,257 |
| Honolulu, HI | $198,854 | $135,148 | 47.1% | $739,000 | $695,000 | $4,971 | $3,379 |
| Virginia Beach, VA | $82,676 | $56,373 | 46.7% | $307,250 | $289,900 | $2,067 | $1,409 |
| Phoenix, AZ | $121,088 | $82,645 | 46.5% | $450,000 | $425,000 | $3,027 | $2,066 |
| Dayton, OH | $51,126 | $35,002 | 46.1% | $190,000 | $180,000 | $1,278 | $875 |
| Cleveland, OH | $53,817 | $36,937 | 45.7% | $200,000 | $189,950 | $1,345 | $923 |
| Seattle, WA | $205,312 | $140,982 | 45.6% | $763,000 | $725,000 | $5,133 | $3,525 |
| Nassau County, NY | $164,142 | $112,834 | 45.5% | $610,000 | $580,250 | $4,104 | $2,821 |
| Minneapolis, MN | $96,602 | $66,475 | 45.3% | $359,000 | $341,850 | $2,415 | $1,662 |
| Boston, MA | $169,524 | $116,665 | 45.3% | $630,000 | $599,950 | $4,238 | $2,917 |
| Portland, OR | $145,306 | $100,146 | 45.1% | $540,000 | $515,000 | $3,633 | $2,504 |
| Cincinnati, OH | $67,271 | $46,378 | 45.0% | $250,000 | $238,500 | $1,682 | $1,159 |
| Colorado Springs, CO | $121,088 | $83,617 | 44.8% | $450,000 | $430,000 | $3,027 | $2,090 |
| Washington, DC | $138,579 | $96,257 | 44.0% | $515,000 | $495,000 | $3,464 | $2,406 |
| Fresno, CA | $104,943 | $72,922 | 43.9% | $390,000 | $375,000 | $2,624 | $1,823 |
| Austin, TX | $128,354 | $89,256 | 43.8% | $477,000 | $459,000 | $3,209 | $2,231 |
| San Diego, CA | $212,577 | $148,225 | 43.4% | $790,000 | $762,250 | $5,314 | $3,706 |
| Riverside, CA | $143,338 | $100,146 | 43.1% | $532,688 | $515,000 | $3,583 | $2,504 |
| Tacoma, WA | $141,243 | $99,173 | 42.4% | $524,900 | $509,998 | $3,531 | $2,479 |
| New Orleans, LA | $74,788 | $52,533 | 42.4% | $277,933 | $270,150 | $1,870 | $1,313 |
| Detroit, MI | $48,435 | $34,030 | 42.3% | $180,000 | $175,000 | $1,211 | $851 |
| Anaheim, CA | $254,286 | $178,901 | 42.1% | $945,000 | $920,000 | $6,357 | $4,473 |
| Chicago, IL | $80,726 | $56,976 | 41.7% | $300,000 | $293,000 | $2,018 | $1,424 |
| Pittsburgh, PA | $57,853 | $40,836 | 41.7% | $215,000 | $210,000 | $1,446 | $1,021 |
| New York, NY | $178,942 | $126,398 | 41.6% | $665,000 | $650,000 | $4,474 | $3,160 |
| Oxnard, CA | $210,559 | $149,250 | 41.1% | $782,500 | $767,518 | $5,264 | $3,731 |
| Memphis, TN | $72,653 | $51,531 | 41.0% | $270,000 | $265,000 | $1,816 | $1,288 |
| Warren, MI | $72,653 | $51,531 | 41.0% | $270,000 | $265,000 | $1,816 | $1,288 |
| Baltimore, MD | $91,751 | $65,143 | 40.8% | $340,975 | $335,000 | $2,294 | $1,629 |
| Newark, NJ | $123,779 | $87,885 | 40.8% | $460,000 | $451,950 | $3,094 | $2,197 |
| Los Angeles, CA | $221,592 | $157,511 | 40.7% | $823,500 | $810,000 | $5,540 | $3,938 |
| Boise, ID | $131,852 | $94,311 | 39.8% | $490,000 | $484,995 | $3,296 | $2,358 |
| Sacramento, CA | $145,306 | $105,007 | 38.4% | $540,000 | $540,000 | $3,633 | $2,625 |
| Philadelphia, PA | $69,962 | $50,559 | 38.4% | $260,000 | $260,000 | $1,749 | $1,264 |
| Frederick, MD | $134,543 | $97,229 | 38.4% | $500,000 | $500,000 | $3,364 | $2,431 |
| Stockton, CA | $134,005 | $97,229 | 37.8% | $498,000 | $500,000 | $3,350 | $2,431 |
| Oakland, CA | $247,559 | $181,818 | 36.2% | $920,000 | $935,000 | $6,189 | $4,545 |
| San Jose, CA | $363,265 | $266,893 | 36.1% | $1,350,000 | $1,372,500 | $9,082 | $6,672 |
| San Francisco, CA | $402,821 | $301,409 | 33.6% | $1,497,000 | $1,550,000 | $10,071 | $7,535 |
| Lake County, IL | $73,998 | $55,420 | 33.5% | $275,000 | $285,000 | $1,850 | $1,386 |
| National | $107,281 | $73,668 | 45.6% | $398,687 | $378,837 | $2,682 | $1,842 |
Methodology
This is based on a Redfin analysis that compares median monthly mortgage payments in October 2022 and October 2021. A monthly mortgage payment is considered affordable if the homebuyer spends no more than 30% of their income on housing.
Monthly median mortgage payments are calculated assuming the buyer made a 20% down payment, and take that month’s median sale price and average mortgage-interest rate into account. The average mortgage rate in October 2022 was 6.9%, while the average rate in October 2021 was 3.1%.
The typical mortgage payments noted in this report include principal, interest, taxes and insurance. In this report, the word “homebuyer” is used to refer to someone who is taking out a loan to finance their purchase.
Editor’s note: A previous version of this report said the typical mortgage payments were calculated assuming a 5% down payment, and include principal and interest and exclude taxes and insurance. In fact, they were calculated assuming a 20% down payment and they include taxes and insurance.


