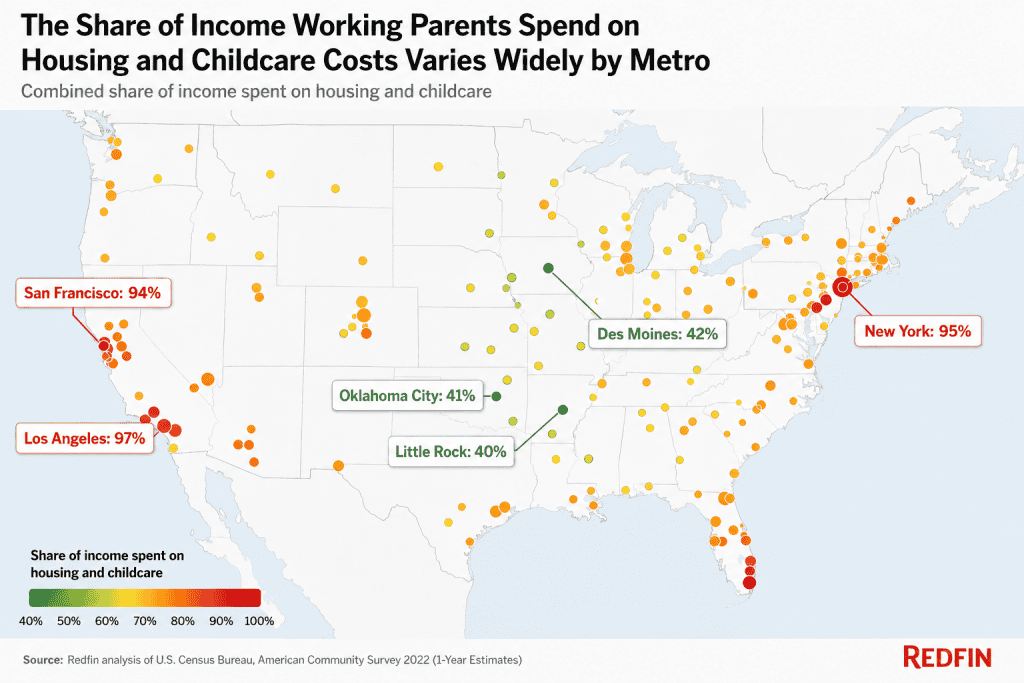
- Where a family lives can change the affordability equation: housing and childcare consume 40% of the typical working family’s income in Little Rock, compared with 97% in Los Angeles. That’s why Redfin has partnered with childcare marketplace Winnie to bring local childcare information to every for-sale home listing on Redfin.
- Childcare costs can ease as children enter public pre-K or kindergarten, but families may still face expenses, depending on where they live.
- Lower-cost metros in the Midwest and South, including Little Rock and Des Moines, give working families more breathing room, with housing and childcare consuming a smaller share of incomes.
- California and New York dominate the least affordable metros for working families, where sky-high housing costs and expensive childcare consume big chunks of household income.
- Childcare makes up the biggest share of the combined housing-and-childcare basket in several Middle America and Northeast metros, like Buffalo and Detroit, because low housing costs make childcare costs a bigger part of the overall budget.
Nationwide, the typical working family buying a home today would spend roughly half (52%) of their annual income on housing and childcare combined. But where a family lives can dramatically change how much of their budget goes toward these two major expenses.
Using data from Redfin and Winnie, the largest marketplace for childcare and early education in the U.S., we estimated the typical annual cost of buying a home today along with childcare for one child, and compared that to the median local household income for the nation’s 100 largest metro areas. Please see the end of this report for more on methodology.
Working families in Little Rock, AR spend just 39.8% of their income on housing and childcare combined–the lowest share among the 100 most populous U.S. metros. Housing and childcare cost the typical Little Rock working family $29,151 per year, compared with a median local income of $73,170.
Contrast that with Los Angeles, where the median-earning working family spends nearly all of their annual income (96.8%) on housing and childcare, the highest share in the nation. The typical cost of housing combined with childcare in the City of Angels is $94,613 per year, just about $3,000 less than the median local income of $97,775.
That wide range means families weighing where to live may want to look beyond home prices and consider childcare as part of the overall cost-of-living equation. A metro with relatively affordable housing may have more expensive childcare, while a higher-cost housing market may offer higher incomes or access to public programs that change the calculation.
“Families considering a move should weigh both of those big costs—as well as job opportunities—when deciding where to put down roots,” said Sara Mauskopf, co-founder and CEO of Winnie. “And cost is only part of the equation. Families should also make sure childcare is actually available near where they want to live. If care is scarce or unaffordable, an otherwise affordable area may not be a practical place for a family with young children.”
That’s why Redfin has partnered with Winnie to bring local childcare information to every for-sale home listing on Redfin. House hunters can now view daycare and preschool options closest to each listing, as well as key data points that paint a full picture of what childcare looks like in the area.
Childcare Math Can Change Over Time and Vary by Families’ Individual Circumstances
These comparisons are most relevant during the years when families are paying for full-time childcare, which is typically before children enter elementary school.
The amount families actually pay can vary substantially based on their circumstances and the programs available where they live; public pre-K and childcare subsidies can reduce families’ out-of-pocket costs. The option for public school starts in kindergarten in most places, but some, like California, Florida and Wisconsin, offer free universal pre-K, which helps ease the cost of childcare. Some places have programs for free childcare for younger kids and toddlers. In New York City, one of the most expensive places in the country, Mayor Zohran Mamdani has made universal childcare a signature policy, and has started rolling it out. The city of San Francisco offers free or low-cost childcare for many families.
That means the affordability picture isn’t necessarily static. A family may face a particularly expensive childcare bill for a few years, then see costs fall when a child becomes eligible for public pre-K or kindergarten.
Midwest and Southern Metros Leave Families With the Most Room in Their Budgets
The metros where housing and childcare consume the smallest share of income are concentrated in the Midwest and South, where home prices and daycare remain fairly affordable relative to local wages.
Working families in Little Rock, AR spend just 39.8% of their income on housing and childcare combined, the lowest share in the country, as stated above. Oklahoma City (40.8%), Des Moines, IA (41.8%), Warren, MI (42.2%) and St. Louis (42.2%) are the next-most affordable metro areas by this measure.
While incomes in these metros are generally lower than in coastal markets, housing costs and childcare costs are dramatically lower. The median home-sale price in Little Rock is just $254,054, compared with $408,000 nationwide, and its housing costs are the second-lowest in the country, after Detroit. The typical Little Rock working family spends roughly $9,600 per year on childcare–the lowest of all the metros in this analysis. That allows families to devote a much smaller share of their earnings to these essential expenses.
The calculus is different for different parts of the country. In Des Moines, childcare and housing costs are fairly low, but not near the lowest in the U.S. They eat up a small share of income because the area’s median income is relatively high at roughly $94,000, in the top half among the metros in this analysis.
The results underscore that for many working parents, the affordability equation depends not only on how much they earn, but also on how expensive it is to buy a home and pay for childcare where they live.
| 10 U.S. Metros Where Childcare and Housing Consume Smallest Share of Family Income | |||||
| Rank | U.S. metro area | Share of income spent on childcare and housing combined | Median annual childcare cost | Median annual housing cost | Median annual household income |
| 1 | Little Rock, AR | 39.8% | $9,612 | $19,539 | $73,170 |
| 2 | Oklahoma City, OK | 40.8% | $10,884 | $21,290 | $78,818 |
| 3 | Des Moines, IA | 41.8% | $13,464 | $25,835 | $93,984 |
| 4 | Warren, MI | 42.2% | $13,548 | $27,239 | $96,676 |
| 5 | St. Louis, MO | 42.2% | $13,872 | $23,552 | $88,593 |
| 6 | Baton Rouge, LA | 42.5% | $10,968 | $21,639 | $76,675 |
| 7 | Akron, OH | 43.2% | $13,896 | $20,133 | $78,753 |
| 8 | Tulsa, OK | 43.3% | $10,860 | $21,879 | $75,570 |
| 9 | Louisville, KY | 43.4% | $12,780 | $22,668 | $81,757 |
| 10 | Dayton, OH | 43.8% | $13,788 | $20,459 | $78,105 |
Here’s a video with commentary from Redfin Chief Economist Daryl Fairweather and Winnie co-founder and CEO Sara Mauskopf:
Working Families Feel the Biggest Affordability Squeeze in California and New York
After Los Angeles, New York is the most expensive metro area for working families. The typical family there spends 95% of their income on housing and childcare. It’s followed by three other expensive parts of California: San Francisco (94.2%), Anaheim (93.5%) and San Jose (83.1%).
All in all, seven of the 10 least affordable metros are in California, largely because of exceptionally high home prices—even in places with relatively high incomes. In San Francisco, for instance, housing and childcare combined total $152,646 annually, compared with a median local income of $162,118–the highest income in the country other than San Jose.
Springfield, MA stands out as the only Northeastern metro in the top 10 outside New York. While housing costs are more moderate than in coastal California, it has the fourth-most expensive childcare in the country–topped only by New York and two other Massachusetts metros, Boston and Worcester. Springfield’s median annual housing costs are $35,200, while the median childcare cost is $26,340. Childcare is particularly expensive in Massachusetts because there’s a shortage of available slots, strict staff-to-child ratio regulations, and high operational and labor costs. Many other parts of the country face the same issues, though perhaps to a lesser extent.
“High-income metros like San Francisco and San Jose offer bigger paychecks, but those gains are often offset by extraordinarily expensive homes,” said Yingqi Xu, senior economist at Redfin. “Meanwhile, markets with more affordable housing give working parents far more financial flexibility, even when local incomes are lower.”
| 10 U.S. Metros Where Childcare and Housing Consume Largest Share of Family Income | |||||
| Rank | U.S. metro area | Share of income spent on childcare and housing combined | Median annual childcare cost | Median annual housing cost | Median annual household income |
| 1 | Los Angeles, CA | 96.8% | $22,656 | $71,957 | $97,775 |
| 2 | New York, NY | 95% | $26,796 | $66,617 | $98,287 |
| 3 | San Francisco, CA | 94.2% | $22,668 | $129,978 | $162,118 |
| 4 | Anaheim, CA | 93.5% | $22,752 | $95,218 | $126,178 |
| 5 | San Jose, CA | 83.1% | $22,800 | $123,717 | $176,401 |
| 6 | San Diego, CA | 82.1% | $22,632 | $71,997 | $115,304 |
| 7 | Oxnard, CA | 77.1% | $22,668 | $69,227 | $119,133 |
| 8 | Springfield, MA | 75.3% | $26,340 | $35,200 | $81,734 |
| 9 | Miami, FL | 75.3% | $13,080 | $45,523 | $77,854 |
| 10 | Riverside, CA | 71% | $22,680 | $46,277 | $97,116 |
Housing and childcare consume a large share of family budgets in these places because both have become increasingly expensive. The median U.S. home-sale price has doubled over the last decade, and childcare costs have increased 40%; both outpace inflation.
High housing costs often make two incomes a necessity, but when both parents work, childcare becomes an unavoidable expense for families with young children. Today, two-thirds (68%) of U.S. mothers with children under six are in the labor force, up from just above 45% in the 1980s, reflecting the long-term shift toward dual-income households. It’s also important to note that about 35% of American families with minor children are headed by a single parent; paying for childcare is often necessary for those households, too.
For families considering a move, these comparisons can help provide a fuller picture of what it may cost to live in a particular metro during the early-childhood years—when housing and childcare are both significant expenses.
Where Housing Is Cheaper, Childcare Takes the Biggest Bite Out of Family Budgets
Childcare costs eat up the largest share of combined childcare-and-housing spending in a cluster of Rust Belt and Northeast metros. Buffalo, NY, where childcare costs make up 45.8% of the bucket, takes the lead. Neighboring Rochester, NY, at 44.7%, trails closely.
Rounding out the top five are Detroit (43.6%). Gary, IN (43%) and Springfield, MA (42.8%). What links these metros isn’t necessarily high dollar prices for childcare—it’s that housing costs are comparatively low, so childcare makes up a disproportionate slice of the combined basket. In cities where home prices and rents have stayed relatively affordable, the cost of childcare carries more relative weight.
In Buffalo, the typical working family spends $20,448 per year on childcare, the 31st-priciest of the 100 most populous metros. It makes up nearly half the combined childcare-and-housing basket because housing costs are low; the area’s median housing cost is one of the lowest in the country at $24,162 per year.
| 10 U.S. Metros Where Childcare Takes Up Biggest Share of Childcare-Housing Budget | |||||
| Rank | U.S. metro area | Childcare as share of combined childcare-and-housing costs | Median annual housing cost | Median annual childcare cost | Median annual household income |
| 1 | Buffalo, NY | 45.8% | $24,162 | $20,448 | $78,402 |
| 2 | Rochester, NY | 44.7% | $25,387 | $20,484 | $82,653 |
| 3 | Detroit, MI | 43.6% | $17,414 | $13,476 | $65,687 |
| 4 | Gary, IN | 43% | $21,939 | $16,560 | $82,274 |
| 5 | Springfield, MA | 42.8% | $35,200 | $26,340 | $81,734 |
| 6 | Bakersfield, CA | 42.2% | $31,078 | $22,728 | $76,180 |
| 7 | Birmingham, AL | 41.8% | $23,799 | $17,100 | $79,628 |
| 8 | Worcester, MA | 41.8% | $36,719 | $26,376 | $103,439 |
| 9 | Akron, OH | 40.8% | $20,133 | $13,896 | $78,753 |
| 10 | Pittsburgh, PA | 40.8% | $21,771 | $15,012 | $83,419 |
Childcare takes up the smallest share of the basket in areas with the priciest housing markets. In San Francisco, CA childcare takes up just 14.9% of the combined childcare-and-housing basket, the smallest of the metros in this analysis, followed closely by San Jose, CA (15.6%). Next come Anaheim, CA (19.3%) and Bridgeport, CT (22%). This metric says less about where childcare is expensive in dollar terms and more about the relative balance between the two costs—it’s a housing-affordability story as much as a childcare-affordability one.
Childcare Alone is Most Affordable in Texas, Least Affordable in Massachusetts and California
In Dallas, the typical working family spends 11% of their income on childcare alone–the lowest share among the 100 most popular U.S. metro areas. The average annual cost of childcare in Dallas is $11,376, the 13th least expensive in the nation. Dallas incomes, meanwhile, are in the top third nationwide; the typical family there earns roughly $103,000.
Charleston, SC, is the second-most affordable metro for childcare, with the typical family spending 11.4% of their income on it. The average annual cost of childcare is $10,500, and the median household income is $92,452. Austin, TX rounds out the three most affordable places, with a cost of $12,600 for childcare and a median income of $109,059.
On the other end of the spectrum is Springfield, MA, where working families spend roughly one-third (32%) of their income on childcare alone–the highest share of the 100 most populous metro areas. Springfield has the fourth-most expensive childcare costs in the country, while incomes are in the bottom quartile.
It’s followed by Bakersfield, CA (30%) and Fresno, CA (28%).
| 5 U.S. Metros Where Childcare Consumes SMALLEST Share of Family Income | ||||
| Rank | U.S. metro area | Childcare as share of income | Median annual cost of childcare | Median annual household income |
| 1 | Dallas, TX | 11.0% | $11,376 | $103,144 |
| 2 | Charleston, SC | 11.4% | $10,500 | $92,452 |
| 3 | Austin, TX | 11.6% | $12,600 | $109,059 |
| 4 | Montgomery County, PA | 12.2% | $15,600 | $127,721 |
| 5 | Atlanta, GA | 12.4% | $12,252 | $98,778 |
| 5 U.S. Metros Where Childcare Consumes BIGGEST Share of Family Income | ||||
| Rank | U.S. metro area | Childcare as share of income | Median annual cost of childcare | Median annual household income |
| 1 | Springfield, MA | 32.2% | $26,340 | $81,734 |
| 2 | Bakersfield, CA | 29.8% | $22,728 | $76,180 |
| 3 | Fresno, CA | 28.2% | $22,680 | $80,511 |
| 4 | New York, NY | 27.3% | $26,796 | $98,287 |
| 5 | Buffalo, NY | 26.1% | $20,448 | $78,402 |
Housing Alone is Most Affordable in Ohio, Least Affordable in California
The typical family in Akron, OH spends 25.6% of their income on housing alone–the lowest share of the metros in this analysis. Akron has the third-least-expensive housing costs in the nation, with an annual average of $20,133. The median income there is $78,753, the 20th-lowest of the 100 metros in this analysis, but the low cost of housing makes up for it.
Next comes Pittsburgh, where the typical household spends 26.1% of their income on housing: The average annual cost of housing is $21,771, and the median income is $83,419. It’s followed closely by another Ohio metro, Dayton, where the typical family spends 26.2% of their income on housing ($20,459 housing cost, $78,105 income).
San Francisco has the least affordable housing in the country. Families there spend 80.2% of their income on housing alone. Next come two more California metros: Anaheim (75.5%) and Los Angeles (73.6%).
While San Francisco has the second-highest median income in the country ($162,118), trailing only San Jose, it also has the highest housing costs. The typical home in San Francisco goes for about $1.7 million, and the typical annual housing cost is $129,978.
| 5 U.S. Metros Where Housing Consumes SMALLEST Share of Family Income | ||||
| Rank | U.S. metro area | Housing as share of income | Median annual cost of housing | Median annual household income |
| 1 | Akron, OH | 25.6% | $20,133 | $78,753 |
| 2 | Pittsburgh, PA | 26.1% | $21,771 | $83,419 |
| 3 | Dayton, OH | 26.2% | $20,459 | $78,105 |
| 4 | Detroit, MI | 26.5% | $17,414 | $65,687 |
| 5 | St. Louis, MO | 26.6% | $23,552 | $88,593 |
| 5 U.S. Metros Where Housing Consumes BIGGEST Share of Family Income | ||||
| Rank | U.S. metro area | Housing as share of income | Median annual cost of housing | Median annual household income |
| 1 | San Francisco, CA | 80.2% | $129,978 | $162,118 |
| 2 | Anaheim, CA | 75.5% | $95,218 | $126,178 |
| 3 | Los Angeles, CA | 73.6% | $71,957 | $97,775 |
| 4 | San Jose, CA | 70.1% | $123,717 | $176,401 |
| 5 | New York, NY | 67.8% | $66,617 | $98,287 |
Methodology
This report uses Winnie childcare cost data and Redfin housing market data to compare the typical annual cost of housing and childcare with median local household income across the nation’s 100 largest metropolitan areas.
Childcare costs are calculated using the median monthly cost of full-time daycare for one child, using the most recent data available. Median household income is from the U.S. Census Bureau’s American Community Survey. The monthly cost of owning a home comes from Redfin’s housing affordability data, which is based on MLS data. It combines the median home-sale price by metro area with the prevailing 30-year fixed mortgage rate, property taxes, home insurance and private mortgage insurance, and assumes a 15% down payment. Housing data is an average from January-June 2026.
For each of the 100 most populous U.S. metro areas, we express annual housing and childcare costs as shares of median local household incomes, and sum them up for the combined housing/childcare burden. The national figure represents the median across the 100 metros in this analysis.