
The housing market set a slew of records for prices, home-selling speed and competition in March, making it the hottest month for housing since at least 2012, when Redfin began tracking the national real estate data trends.
March was a month of records for the housing market, even considering the fact that year-over-year comparisons are now looking at the start of the pandemic.
- The national median home-sale price hit a record high of $353,000, up 17% from 2020, a record high rate of growth.
- The number of homes for sale fell to a record low, with a record year-over-year drop of 29%.
- The typical home sold in just 25 days, a record low.
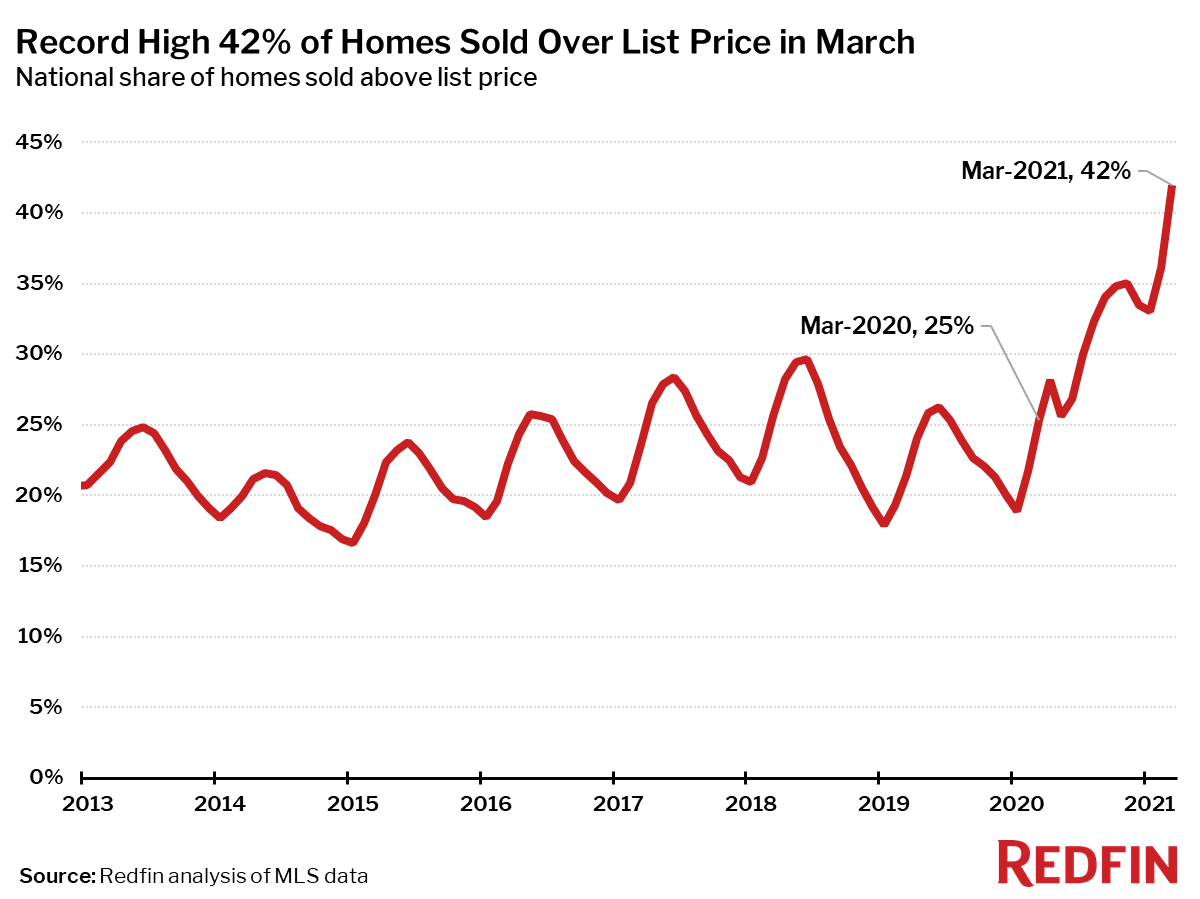
- 42% of homes sold above their list price, a record high.
- The average sale-to-list ratio, a measure of how close homes are selling to their asking prices, hit a record high, passing 100% for the first time.
The latest weekly data for April suggests that we may already be seeing the beginning of some seasonal slowing in the market, so March might be the most intense month for the housing market this year.
Note: Year-over-year comparisons of pending sales and new listings in this report are more a reflection of the fact that in March of 2020 stay-at-home-orders halted both home-buying and selling activity than of how the housing market has changed over the past year. Other measures like closed home sales and home prices were most impacted by this in April and May of last year, and will be reflected in the year-over-year data in the coming months.
“My family is looking for a home to buy in the Washington, D.C. area, so I know first-hand that the house hunt feels a lot like spinning the roulette wheel each week,” said Redfin Lead Economist Taylor Marr. “So why would we buy into the toughest market I’ve ever seen? Despite the intense competition and high prices we face, I still see more big gains to be made in home equity. Fundamentals like low mortgage rates and high demand for housing are fueling the record-high price gains, so I don’t believe that homes are overvalued. Waiting for the market to cool could take many months, and at that point we may have missed out on the opportunity to benefit from these super-low mortgage rates and price gains in the year ahead.”
Median sale prices increased from a year earlier in all but two of the 85 largest metro areas Redfin tracks. The only places prices didn’t increase were Honolulu, where they fell 4.7% from a year ago and San Francisco, where they were down 1.6%. The largest price increases were in Austin, TX (+28%), Fresno, CA (+23%) and North Port, FL (+23%), three popular destinations for newly-remote workers who have been leaving the most expensive metro areas during the pandemic in search of more affordable locales.

| Market Summary | March 2021 | Month-Over-Month | Year-Over-Year |
|---|---|---|---|
| Median sale price | $353,000 | 5.3% | 16.7% |
| Homes sold, seasonally-adjusted | 597,300 | -2.4% | 10.1% |
| Pending sales, seasonally-adjusted | 537,700 | -5.5% | 22.1% |
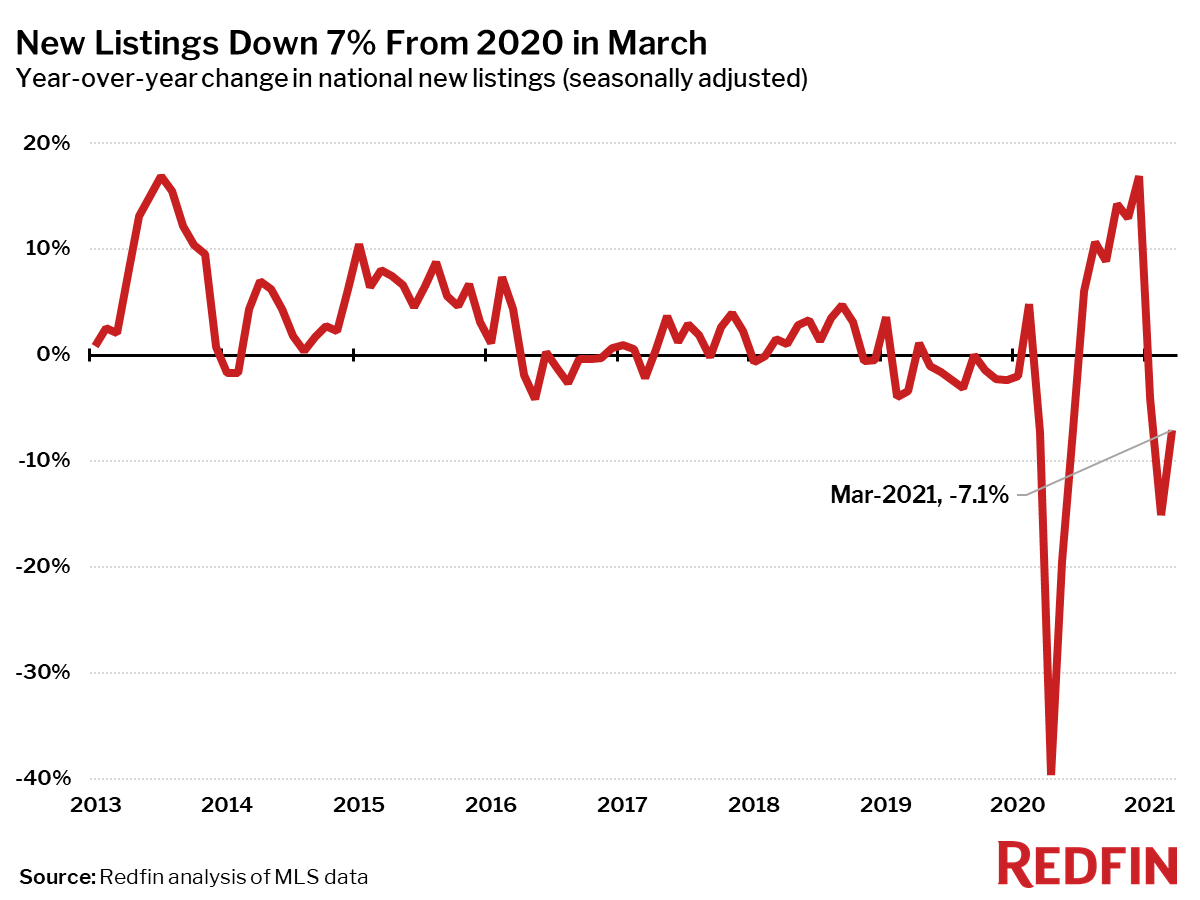
| New listings, seasonally-adjusted | 527,100 | -1.5% | -7.1% |
| All Homes for sale, seasonally-adjusted | 1,458,600 | -3.0% | -28.9% |
| Median days on market | 25 | -7 | -19 |
| Months of supply | 1.1 | -0.5 | -1.5 |
| Sold above list | 42.0% | 5.9 pts† | 16.6 pts† |
| Median Off-Market Redfin Estimate | $337,500 | 0.0% | 15.4% |
| Average Sale-to-list | 100.6% | 0.8 pts† | 2.0 pts† |
| Average 30-year fixed mortgage rate | 3.08% | 0.27 pts† | -0.37 pts† |
The number of homes sold in March was up from a year earlier in most of the 85 largest metro areas Redfin tracks, but 11 metros did see declines. The largest gains in sales were in New York (+58%), San Jose (+56%) and San Francisco (+55%). The metro areas where home sales fell the most were Rochester, NY (-9%), Grand Rapids, MI (-9%) and Dayton, OH (-7%). The number of homes for sale in all three of these metro areas has been falling by around 30% year over year for most of this year, so the drop in sales is likely due largely to a lack of supply.

Active listings—the count of all homes that were for sale at any time during the month—fell 29% year over year to their lowest level on record. This was the largest year-over-year drop on record and the 20th-straight month of declines.

Only four of the 85 largest metros tracked by Redfin posted a year-over-year increase in the count of seasonally-adjusted active listings of homes for sale: San Francisco (+34%), San Jose (+20%), Oakland, CA (+8%) and Los Angeles (+3%).
The biggest year-over-year declines in active housing supply in March were in Salt Lake City (-66%), Baton Rouge, LA (-59%) and Allentown, PA (-52%).
New listings of homes for sale fell 7% in March from a year earlier. Despite the ongoing decline in new listings of homes for sale, pending sales were still up 22% from 2020.
The housing market was more competitive in March than any time since the start of Redfin’s national housing data in 2012.
The typical home that sold in March went under contract in 25 days—19 days fewer than a year earlier and the fastest pace on record.

In March a record-high 42% of homes sold above list price, the largest share on record. If this measure follows the typical seasonal pattern, it may continue to hit new record highs in April, May and June.
The average sale-to-list price ratio exceeded 100% for the first time on record in March. This measure also typically peaks in June, so we may see additional record highs for the next three months if the market does not cool down.

Other March Highlights
Competition
- Denver was the fastest market, with half of all homes pending sale in just 5 days, down from 9 days a year earlier. Tacoma, WA and Grand Rapids, MI were the next fastest markets with 5 and 6 median days on market, followed by Omaha, NE (6) and Portland, OR (6).
- The most competitive market in March was Oakland, CA where 79.7% of homes sold above list price, followed by 72.7% in San Jose, CA, 69.5% in Tacoma, WA, 68.1% in Sacramento, CA, and 66.4% in Salt Lake City.
Prices
- Austin, TX had the nation’s highest price growth, rising 28.2% since last year to $427,000. Fresno, CA had the second highest growth at 23.2% year-over-year price growth, followed by North Port, FL (22.8%), Sacramento, CA (20.9%), and Salt Lake City (20.4%).
- 2 metros saw price declines in March including Urban Honolulu, HI (-4.7%), and San Francisco (-1.6%).
Sales
- The New York City metro area led the nation in year-over-year sales growth, up 58.2%, followed by San Jose, CA, up 56.4%. San Francisco rounded out the top three with sales up 54.6% from a year ago.
- Rochester, NY saw the largest decline in sales since last year, falling 9.4%. Home sales in Grand Rapids, MI and Dayton, OH declined by 8.9% and 7.3%, respectively.
Inventory
- San Francisco had the highest increase in the number of homes for sale, up 34% year over year, followed by San Jose, CA (31%) and Oakland, CA (8%).
- Salt Lake City had the largest decrease in overall active listings, falling 66.3% since last March. Baton Rouge, LA (-59%), Allentown, PA (-52%), and St. Louis (-49%) also saw far fewer homes available on the market than a year ago.
Redfin Estimate
- Miami (91.1%) had the largest share of homes predicted to sell for below list price, according to Redfin Estimate data, followed by West Palm Beach, FL (88.0%) and Fort Lauderdale, FL (86.7%).
- Oakland, CA (90.9%) had the largest share of homes predicted to sell at or above list price, followed by San Jose, CA (88.1%) and Portland, OR (79.8%).
Below are market-by-market breakdowns for prices, inventory, new listings and sales for markets with populations of 750,000 or more. For downloadable data on all of the markets Redfin tracks, visit the Redfin Data Center. Refer to our metrics definition page for explanations of all the metrics used in this report.
Median Sale Price
| Redfin Metro | Median Sale Price | Month-Over-Month | Year-Over-Year |
|---|---|---|---|
| Albany, NY | $237,500 | 5.6% | 13.1% |
| Allentown, PA | $240,000 | 4.3% | 15.9% |
| Anaheim, CA | $851,000 | 2.5% | 13.3% |
| Atlanta, GA | $300,000 | 5.3% | 13.6% |
| Austin, TX | $427,000 | 7.3% | 28.2% |
| Bakersfield, CA | $300,000 | 7.1% | 19.2% |
| Baltimore, MD | $315,000 | 5.0% | 7.9% |
| Baton Rouge, LA | $233,900 | 1.7% | 8.3% |
| Birmingham, AL | $247,900 | 4.2% | 7.8% |
| Boston, MA | $578,500 | 5.2% | 10.2% |
| Bridgeport, CT | $460,000 | -2.1% | 18.6% |
| Buffalo, NY | $175,000 | 3.6% | 13.5% |
| Camden, NJ | $236,000 | 0.4% | 18.0% |
| Charleston, SC | $342,500 | 2.3% | 17.7% |
| Charlotte, NC | $312,900 | 4.3% | 12.1% |
| Chicago, IL | $300,000 | 9.1% | 13.2% |
| Cincinnati, OH | $221,000 | 5.2% | 12.9% |
| Cleveland, OH | $168,000 | 7.0% | 6.4% |
| Columbus, OH | $254,000 | 6.7% | 10.0% |
| Dallas, TX | $345,000 | 3.1% | 14.8% |
| Dayton, OH | $162,000 | 6.6% | 5.2% |
| Denver, CO | $495,000 | 5.1% | 12.5% |
| Detroit, MI | $160,000 | 6.7% | 14.3% |
| El Paso, TX | $185,000 | -1.9% | 9.5% |
| Elgin, IL | $268,000 | 10.9% | 15.2% |
| Fort Lauderdale, FL | $322,000 | 2.2% | 12.8% |
| Fort Worth, TX | $287,000 | 1.1% | 14.8% |
| Frederick, MD | $468,800 | 9.0% | 11.6% |
| Fresno, CA | $345,000 | 1.5% | 23.2% |
| Grand Rapids, MI | $250,000 | 3.1% | 12.6% |
| Greensboro, NC | $201,200 | 6.5% | 5.9% |
| Greenville, SC | $250,000 | 2.9% | 9.9% |
| Hartford, CT | $250,000 | 0.0% | 10.8% |
| Houston, TX | $289,000 | 5.1% | 15.6% |
| Indianapolis, IN | $225,000 | 2.3% | 7.4% |
| Jacksonville, FL | $275,000 | 5.8% | 11.7% |
| Kansas City, MO | $260,500 | 5.0% | 10.4% |
| Knoxville, TN | $259,900 | 4.5% | 16.0% |
| Lake County, IL | $284,400 | 11.5% | 11.5% |
| Las Vegas, NV | $336,000 | 1.8% | 13.9% |
| Los Angeles, CA | $773,800 | 3.9% | 17.2% |
| Louisville, KY | $219,900 | 2.3% | 8.3% |
| McAllen, TX | $188,900 | 3.8% | 16.1% |
| Memphis, TN | $220,800 | 7.7% | 10.4% |
| Miami, FL | $390,000 | 4.0% | 18.2% |
| Milwaukee, WI | $246,000 | 6.4% | 4.7% |
| Minneapolis, MN | $330,000 | 4.8% | 10.0% |
| Montgomery County, PA | $370,000 | 5.7% | 12.2% |
| Nashville, TN | $345,000 | 3.0% | 9.5% |
| Nassau County, NY | $533,000 | -0.5% | 15.2% |
| New Brunswick, NJ | $390,000 | 4.0% | 16.4% |
| New Haven, CT | $255,000 | 3.7% | 16.2% |
| New Orleans, LA | $264,400 | 4.9% | 15.0% |
| New York, NY | $624,000 | 4.9% | 9.3% |
| Newark, NJ | $425,000 | 3.7% | 17.7% |
| North Port, FL | $350,000 | 6.1% | 22.8% |
| Oakland, CA | $890,000 | 7.9% | 17.4% |
| Oklahoma City, OK | $218,000 | 3.8% | 12.8% |
| Omaha, NE | $245,000 | 2.7% | 13.4% |
| Orlando, FL | $300,000 | 0.3% | 11.5% |
| Oxnard, CA | $722,000 | 3.7% | 16.5% |
| Philadelphia, PA | $259,000 | 9.2% | 9.5% |
| Phoenix, AZ | $366,000 | 3.1% | 20.0% |
| Pittsburgh, PA | $210,000 | 6.3% | 17.0% |
| Portland, OR | $476,900 | 2.3% | 13.8% |
| Providence, RI | $339,900 | 4.6% | 13.3% |
| Raleigh, NC | $330,000 | 3.1% | 8.9% |
| Richmond, VA | $300,000 | 0.0% | 11.3% |
| Riverside, CA | $480,000 | 3.3% | 20.3% |
| Rochester, NY | $165,000 | 6.5% | 10.0% |
| Sacramento, CA | $520,000 | 6.1% | 20.9% |
| Salt Lake City, UT | $437,000 | 5.3% | 20.4% |
| San Antonio, TX | $265,000 | 1.1% | 11.1% |
| San Diego, CA | $700,000 | 2.2% | 16.7% |
| San Francisco, CA | $1,427,500 | 3.8% | -1.6% |
| San Jose, CA | $1,330,000 | 9.9% | 10.8% |
| Seattle, WA | $700,000 | 6.9% | 18.5% |
| St. Louis, MO | $214,000 | 7.0% | 12.6% |
| Tacoma, WA | $475,000 | 3.3% | 17.2% |
| Tampa, FL | $285,000 | 2.7% | 16.3% |
| Tucson, AZ | $285,000 | 5.9% | 18.8% |
| Tulsa, OK | $212,700 | 1.3% | 16.8% |
| Urban Honolulu, HI | $611,000 | -4.5% | -4.7% |
| Virginia Beach, VA | $265,000 | 2.3% | 8.2% |
| Warren, MI | $243,500 | 7.7% | 9.4% |
| Washington, DC | $477,500 | 6.8% | 9.0% |
| West Palm Beach, FL | $350,000 | 0.0% | 18.6% |
| Worcester, MA | $325,900 | 8.6% | 18.1% |
| National | $353,000 | 5.3% | 16.7% |
Homes Sold
| Redfin Metro | Homes Sold | Month-Over-Month | Year-Over-Year |
|---|---|---|---|
| Albany, NY | 883 | 21.5% | 30.2% |
| Allentown, PA | 734 | 28.8% | 1.8% |
| Anaheim, CA | 3,271 | 40.7% | 36.2% |
| Atlanta, GA | 10,313 | 33.2% | 11.0% |
| Austin, TX | 3,347 | 48.2% | 5.2% |
| Bakersfield, CA | 889 | 31.1% | 27.4% |
| Baltimore, MD | 3,866 | 25.2% | 12.1% |
| Baton Rouge, LA | 1,215 | 33.2% | 35.5% |
| Birmingham, AL | 1,555 | 28.4% | 12.5% |
| Boston, MA | 3,500 | 39.3% | 10.5% |
| Bridgeport, CT | 1,244 | 33.3% | 45.5% |
| Buffalo, NY | 793 | -2.8% | 5.6% |
| Camden, NJ | 1,683 | 26.7% | 8.1% |
| Charleston, SC | 1,909 | 27.1% | 23.4% |
| Charlotte, NC | 4,487 | 34.9% | 6.5% |
| Chicago, IL | 9,358 | 51.2% | 28.1% |
| Cincinnati, OH | 2,585 | 27.7% | 3.8% |
| Cleveland, OH | 2,393 | 29.6% | 2.2% |
| Columbus, OH | 2,392 | 29.6% | 2.3% |
| Dallas, TX | 5,861 | 32.9% | 0.9% |
| Dayton, OH | 904 | 17.4% | -7.3% |
| Denver, CO | 5,098 | 30.3% | 12.3% |
| Detroit, MI | 1,668 | 14.5% | 11.6% |
| El Paso, TX | 926 | 29.0% | 27.4% |
| Elgin, IL | 1,007 | 45.5% | 8.2% |
| Fort Lauderdale, FL | 4,194 | 40.3% | 32.9% |
| Fort Worth, TX | 2,849 | 33.8% | -1.5% |
| Frederick, MD | 1,531 | 19.5% | 4.6% |
| Fresno, CA | 720 | 26.5% | 6.5% |
| Grand Rapids, MI | 1,085 | 23.2% | -8.9% |
| Greensboro, NC | 1,031 | 27.4% | 22.0% |
| Greenville, SC | 1,346 | 40.6% | 11.8% |
| Hartford, CT | 1,322 | 30.9% | 11.3% |
| Houston, TX | 9,666 | 55.1% | 24.9% |
| Indianapolis, IN | 2,762 | 22.6% | -6.4% |
| Jacksonville, FL | 3,078 | 23.4% | 14.8% |
| Kansas City, MO | 2,686 | 22.1% | -3.7% |
| Knoxville, TN | 1,277 | 26.8% | 4.6% |
| Lake County, IL | 1,212 | 40.1% | 19.5% |
| Las Vegas, NV | 4,811 | 33.6% | 38.8% |
| Los Angeles, CA | 7,144 | 41.2% | 38.0% |
| Louisville, KY | 1,319 | 28.1% | 5.4% |
| McAllen, TX | 356 | 44.7% | 17.1% |
| Memphis, TN | 1,072 | 23.6% | 4.7% |
| Miami, FL | 3,762 | 38.5% | 41.9% |
| Milwaukee, WI | 1,580 | 41.3% | -1.9% |
| Minneapolis, MN | 4,465 | 33.6% | 4.5% |
| Montgomery County, PA | 1,959 | 33.7% | -0.5% |
| Nashville, TN | 3,562 | 25.4% | 6.0% |
| Nassau County, NY | 2,747 | 9.0% | 50.9% |
| New Brunswick, NJ | 3,105 | 26.8% | 24.3% |
| New Haven, CT | 977 | 29.1% | 27.2% |
| New Orleans, LA | 1,525 | 29.5% | 24.0% |
| New York, NY | 6,655 | 24.6% | 58.2% |
| Newark, NJ | 2,158 | 24.8% | 25.1% |
| North Port, FL | 3,352 | 51.5% | 47.1% |
| Oakland, CA | 2,755 | 47.6% | 42.6% |
| Oklahoma City, OK | 2,125 | 37.0% | 13.9% |
| Omaha, NE | 949 | 24.9% | -5.9% |
| Orlando, FL | 5,208 | 34.2% | 29.6% |
| Oxnard, CA | 781 | 29.5% | 18.0% |
| Philadelphia, PA | 2,350 | 29.4% | 25.5% |
| Phoenix, AZ | 9,714 | 28.2% | 14.2% |
| Pittsburgh, PA | 2,157 | 41.8% | 6.6% |
| Portland, OR | 3,358 | 24.1% | 8.1% |
| Providence, RI | 1,671 | 27.3% | 5.6% |
| Raleigh, NC | 2,535 | 29.1% | 1.8% |
| Richmond, VA | 1,702 | 37.0% | 8.0% |
| Riverside, CA | 5,874 | 35.1% | 23.3% |
| Rochester, NY | 714 | 7.2% | -9.4% |
| Sacramento, CA | 2,682 | 32.2% | 12.7% |
| Salt Lake City, UT | 1,361 | 26.7% | -1.1% |
| San Antonio, TX | 3,067 | 36.3% | 2.9% |
| San Diego, CA | 3,372 | 26.1% | 14.9% |
| San Francisco, CA | 1,300 | 55.1% | 54.6% |
| San Jose, CA | 1,577 | 44.5% | 56.4% |
| Seattle, WA | 4,364 | 39.3% | 17.2% |
| St. Louis, MO | 3,396 | 28.8% | 5.3% |
| Tacoma, WA | 1,336 | 33.9% | 15.8% |
| Tampa, FL | 6,714 | 30.6% | 17.9% |
| Tucson, AZ | 1,889 | 32.2% | 16.6% |
| Tulsa, OK | 1,336 | 40.3% | 21.1% |
| Urban Honolulu, HI | 936 | 35.8% | 37.8% |
| Virginia Beach, VA | 2,651 | 30.2% | 16.0% |
| Warren, MI | 3,103 | 19.2% | 2.6% |
| Washington, DC | 6,796 | 31.0% | 10.9% |
| West Palm Beach, FL | 4,139 | 41.1% | 33.0% |
| Worcester, MA | 815 | 17.6% | -1.0% |
| National | 597,300 | -2.4% | 10.1% |
New Listings
| Redfin Metro | New Listings | Month-Over-Month | Year-Over-Year |
|---|---|---|---|
| Albany, NY | 1,149 | 53.2% | 25.8% |
| Allentown, PA | 542 | 25.8% | -37.9% |
| Anaheim, CA | 3,619 | 23.5% | 27.5% |
| Atlanta, GA | 11,189 | 26.3% | -6.1% |
| Austin, TX | 4,111 | 65.0% | -0.6% |
| Bakersfield, CA | 1,023 | 29.2% | 11.3% |
| Baltimore, MD | 4,860 | 44.2% | 1.1% |
| Baton Rouge, LA | 608 | -12.0% | -48.5% |
| Birmingham, AL | 1,461 | 16.4% | -11.7% |
| Boston, MA | 6,021 | 60.9% | 17.5% |
| Bridgeport, CT | 1,862 | 62.8% | 24.6% |
| Buffalo, NY | 1,152 | 60.9% | 24.9% |
| Camden, NJ | 2,126 | 41.0% | 5.3% |
| Charleston, SC | 1,967 | 25.8% | 1.4% |
| Charlotte, NC | 3,074 | -4.3% | -41.7% |
| Chicago, IL | 12,440 | 46.5% | 11.7% |
| Cincinnati, OH | 3,187 | 46.2% | 0.5% |
| Cleveland, OH | 3,057 | 39.1% | 7.3% |
| Columbus, OH | 2,855 | 45.9% | -0.1% |
| Dallas, TX | 6,967 | 52.0% | -6.8% |
| Dayton, OH | 1,207 | 45.8% | 2.3% |
| Denver, CO | 5,459 | 27.4% | -8.7% |
| Detroit, MI | 2,151 | 45.8% | 13.8% |
| El Paso, TX | 989 | 0.8% | 3.8% |
| Elgin, IL | 1,230 | 45.0% | -6.5% |
| Fort Lauderdale, FL | 3,705 | 10.8% | -0.9% |
| Fort Worth, TX | 3,334 | 52.3% | -4.6% |
| Frederick, MD | 2,133 | 59.8% | 7.0% |
| Fresno, CA | 862 | 21.9% | -3.7% |
| Grand Rapids, MI | 1,362 | 47.7% | -6.1% |
| Greensboro, NC | 665 | 11.2% | -36.3% |
| Greenville, SC | 1,297 | 14.5% | -13.0% |
| Hartford, CT | 1,911 | 64.6% | 10.9% |
| Houston, TX | 10,835 | 41.5% | 1.4% |
| Indianapolis, IN | 3,254 | 51.8% | -9.5% |
| Jacksonville, FL | 3,292 | 19.9% | -8.9% |
| Kansas City, MO | 3,598 | 49.0% | -1.3% |
| Knoxville, TN | 1,022 | 8.3% | -25.9% |
| Lake County, IL | 1,523 | 42.9% | 0.8% |
| Las Vegas, NV | 4,575 | 18.6% | 3.6% |
| Los Angeles, CA | 8,476 | 21.4% | 36.5% |
| Louisville, KY | 1,597 | 55.5% | 3.8% |
| McAllen, TX | 471 | 28.7% | 5.4% |
| Memphis, TN | 1,224 | 43.2% | -6.3% |
| Miami, FL | 4,584 | 16.3% | 32.0% |
| Milwaukee, WI | 2,047 | 51.9% | 0.4% |
| Minneapolis, MN | 6,361 | 40.5% | -9.0% |
| Montgomery County, PA | 2,896 | 61.1% | 13.0% |
| Nashville, TN | 3,765 | 18.4% | -13.3% |
| Nassau County, NY | 3,525 | 48.1% | 19.4% |
| New Brunswick, NJ | 4,185 | 56.2% | 23.2% |
| New Haven, CT | 1,392 | 51.8% | 18.5% |
| New Orleans, LA | 1,789 | 28.5% | 6.2% |
| New York, NY | 10,401 | 62.2% | 55.3% |
| Newark, NJ | 3,141 | 70.4% | 21.6% |
| North Port, FL | 2,768 | 15.6% | 13.3% |
| Oakland, CA | 3,282 | 24.9% | 40.4% |
| Oklahoma City, OK | 2,445 | 55.5% | 3.3% |
| Omaha, NE | 1,319 | 44.8% | -17.5% |
| Orlando, FL | 4,879 | 18.6% | -1.6% |
| Oxnard, CA | 969 | 25.5% | 21.4% |
| Philadelphia, PA | 3,492 | 55.8% | 33.6% |
| Phoenix, AZ | 9,386 | 13.5% | -7.8% |
| Pittsburgh, PA | 2,790 | 60.2% | 35.9% |
| Portland, OR | 3,941 | 36.7% | -1.0% |
| Providence, RI | 2,258 | 58.6% | 6.4% |
| Raleigh, NC | 2,560 | 15.8% | -13.6% |
| Richmond, VA | 2,012 | 45.1% | -8.0% |
| Riverside, CA | 6,102 | 19.8% | 16.1% |
| Rochester, NY | 1,120 | 61.2% | 4.4% |
| Sacramento, CA | 3,162 | 30.0% | 0.8% |
| Salt Lake City, UT | 687 | -29.0% | -66.1% |
| San Antonio, TX | 3,330 | 46.1% | -8.2% |
| San Diego, CA | 3,682 | 19.8% | 4.8% |
| San Francisco, CA | 1,260 | -1.2% | 46.5% |
| San Jose, CA | 2,001 | 23.4% | 51.4% |
| Seattle, WA | 5,481 | 45.5% | 7.5% |
| St. Louis, MO | 2,192 | 0.4% | -46.5% |
| Tacoma, WA | 1,669 | 37.7% | 3.2% |
| Tampa, FL | 6,462 | 17.6% | -1.7% |
| Tucson, AZ | 1,866 | 11.1% | -2.6% |
| Tulsa, OK | 1,583 | 63.0% | 4.9% |
| Urban Honolulu, HI | 782 | 7.7% | -15.3% |
| Virginia Beach, VA | 3,232 | 39.2% | 8.8% |
| Warren, MI | 3,945 | 52.5% | 13.9% |
| Washington, DC | 9,026 | 48.7% | 6.2% |
| West Palm Beach, FL | 4,026 | 13.1% | 11.9% |
| Worcester, MA | 1,266 | 74.9% | 0.3% |
| National | 527,100 | -1.5% | -7.1% |
All Homes for Sale
| Redfin Metro | All Homes for Sale | Month-Over-Month | Year-Over-Year |
|---|---|---|---|
| Albany, NY | 2,536 | 6.2% | -22.6% |
| Allentown, PA | 1,197 | -1.3% | -52.1% |
| Anaheim, CA | 7,868 | 9.5% | -10.6% |
| Atlanta, GA | 21,409 | 5.5% | -38.6% |
| Austin, TX | 6,896 | 28.4% | -28.8% |
| Bakersfield, CA | 1,967 | 5.0% | -21.7% |
| Baltimore, MD | 8,881 | 16.1% | -31.1% |
| Baton Rouge, LA | 1,920 | -13.0% | -59.4% |
| Birmingham, AL | 4,045 | 3.6% | -29.2% |
| Boston, MA | 10,750 | 25.7% | -9.6% |
| Bridgeport, CT | 4,947 | 14.2% | -21.8% |
| Buffalo, NY | 1,892 | 21.8% | -23.7% |
| Camden, NJ | 4,230 | 12.9% | -34.9% |
| Charleston, SC | 5,451 | 7.6% | -25.7% |
| Charlotte, NC | 8,538 | -5.6% | -44.5% |
| Chicago, IL | 26,206 | 11.6% | -24.4% |
| Cincinnati, OH | 7,483 | 14.6% | -17.0% |
| Cleveland, OH | 6,398 | 10.3% | -25.9% |
| Columbus, OH | 6,087 | 15.2% | -20.0% |
| Dallas, TX | 13,342 | 9.9% | -42.1% |
| Dayton, OH | 2,293 | 12.2% | -25.2% |
| Denver, CO | 7,664 | 11.6% | -30.9% |
| Detroit, MI | 4,377 | 7.7% | -32.9% |
| El Paso, TX | 2,506 | -1.8% | -32.6% |
| Elgin, IL | 1,916 | 11.8% | -48.5% |
| Fort Lauderdale, FL | 13,134 | -2.7% | -25.3% |
| Fort Worth, TX | 6,307 | 12.0% | -37.8% |
| Frederick, MD | 3,654 | 24.4% | -19.0% |
| Fresno, CA | 1,434 | 8.1% | -34.9% |
| Grand Rapids, MI | 2,194 | 20.1% | -31.4% |
| Greensboro, NC | 1,640 | -9.8% | -47.8% |
| Greenville, SC | 3,907 | 2.5% | -25.6% |
| Hartford, CT | 4,390 | 15.7% | -28.5% |
| Houston, TX | 24,963 | 6.5% | -30.3% |
| Indianapolis, IN | 5,261 | 15.8% | -33.0% |
| Jacksonville, FL | 6,819 | 2.1% | -36.7% |
| Kansas City, MO | 6,335 | 12.7% | -31.3% |
| Knoxville, TN | 3,258 | -0.1% | -32.9% |
| Lake County, IL | 2,926 | 12.4% | -41.8% |
| Las Vegas, NV | 9,692 | 0.1% | -24.3% |
| Los Angeles, CA | 20,667 | 6.9% | 2.8% |
| Louisville, KY | 3,041 | 14.6% | -25.5% |
| McAllen, TX | 1,500 | 3.7% | -32.6% |
| Memphis, TN | 2,704 | 11.0% | -26.4% |
| Miami, FL | 17,564 | 0.8% | -18.1% |
| Milwaukee, WI | 4,932 | 16.9% | -18.2% |
| Minneapolis, MN | 11,002 | 18.7% | -24.3% |
| Montgomery County, PA | 5,311 | 22.4% | -26.5% |
| Nashville, TN | 8,257 | 1.6% | -39.3% |
| Nassau County, NY | 9,033 | 8.7% | -26.0% |
| New Brunswick, NJ | 8,796 | 15.2% | -34.6% |
| New Haven, CT | 3,311 | 12.9% | -21.3% |
| New Orleans, LA | 4,269 | 5.5% | -25.4% |
| New York, NY | 36,525 | 8.7% | -6.0% |
| Newark, NJ | 7,367 | 18.5% | -22.3% |
| North Port, FL | 4,952 | -7.1% | -48.0% |
| Oakland, CA | 4,989 | 18.6% | 8.3% |
| Oklahoma City, OK | 4,395 | 14.3% | -31.8% |
| Omaha, NE | 1,995 | 18.5% | -36.2% |
| Orlando, FL | 9,870 | -2.5% | -28.9% |
| Oxnard, CA | 2,046 | 13.7% | -19.9% |
| Philadelphia, PA | 8,356 | 13.3% | -2.9% |
| Phoenix, AZ | 18,155 | 3.1% | -27.7% |
| Pittsburgh, PA | 7,748 | 13.7% | -18.9% |
| Portland, OR | 6,271 | 20.2% | -27.5% |
| Providence, RI | 4,620 | 15.9% | -26.0% |
| Raleigh, NC | 5,655 | 2.4% | -37.3% |
| Richmond, VA | 3,181 | 18.0% | -34.2% |
| Riverside, CA | 12,768 | 5.2% | -31.9% |
| Rochester, NY | 1,726 | 19.7% | -31.0% |
| Sacramento, CA | 4,950 | 19.9% | -28.3% |
| Salt Lake City, UT | 1,329 | -21.5% | -66.3% |
| San Antonio, TX | 7,099 | 4.9% | -43.1% |
| San Diego, CA | 6,302 | 10.2% | -24.7% |
| San Francisco, CA | 3,064 | 3.0% | 33.7% |
| San Jose, CA | 3,552 | 15.5% | 31.3% |
| Seattle, WA | 7,663 | 27.2% | -9.0% |
| St. Louis, MO | 5,822 | -7.0% | -48.8% |
| Tacoma, WA | 2,244 | 28.3% | -18.8% |
| Tampa, FL | 11,180 | -0.8% | -39.8% |
| Tucson, AZ | 4,432 | 4.5% | -22.7% |
| Tulsa, OK | 2,802 | 19.3% | -35.0% |
| Urban Honolulu, HI | 3,051 | -2.0% | -28.1% |
| Virginia Beach, VA | 5,944 | 10.8% | -26.9% |
| Warren, MI | 6,822 | 16.6% | -29.7% |
| Washington, DC | 16,307 | 19.9% | -12.0% |
| West Palm Beach, FL | 12,812 | -3.2% | -26.3% |
| Worcester, MA | 2,121 | 23.7% | -30.7% |
| National | 1,458,600 | -3.0% | -28.9% |
Median Off-Market Redfin Estimate
| Redfin Metro | Estimate | Month-Over-Month | Year-Over-Year |
|---|---|---|---|
| Albany, NY | $215,300 | 0.8% | 10.4% |
| Allentown, PA | $233,900 | 1.0% | 11.8% |
| Anaheim, CA | $797,200 | 1.6% | 9.5% |
| Atlanta, GA | $257,600 | 1.1% | 12.1% |
| Austin, TX | $340,600 | 2.6% | 15.0% |
| Bakersfield, CA | $216,600 | 1.3% | 13.1% |
| Baltimore, MD | $295,200 | 1.0% | 10.3% |
| Baton Rouge, LA | $139,400 | 1.1% | 8.8% |
| Birmingham, AL | $148,300 | 1.3% | 12.3% |
| Boston, MA | $564,300 | 0.7% | 8.7% |
| Bridgeport, CT | $416,600 | 0.6% | 7.1% |
| Buffalo, NY | $166,200 | 1.5% | 12.7% |
| Camden, NJ | $231,500 | 1.2% | 13.9% |
| Charleston, SC | $258,900 | 1.1% | 9.9% |
| Charlotte, NC | $239,700 | 1.2% | 16.4% |
| Chicago, IL | $274,000 | 0.4% | 5.9% |
| Cincinnati, OH | $181,900 | 0.9% | 11.6% |
| Cleveland, OH | $155,000 | 1.0% | 11.7% |
| Columbus, OH | $219,900 | 1.6% | 12.5% |
| Dallas, TX | $280,600 | 1.2% | 9.5% |
| Dayton, OH | $137,000 | 0.7% | 11.2% |
| Denver, CO | $449,100 | 1.5% | 8.1% |
| Detroit, MI | $114,300 | 1.0% | 10.9% |
| Elgin, IL | $245,100 | 0.5% | 7.2% |
| Fort Lauderdale, FL | $296,200 | 0.9% | 8.8% |
| Fort Worth, TX | $239,700 | 1.1% | 9.8% |
| Frederick, MD | $445,000 | 0.7% | 8.0% |
| Fresno, CA | $290,100 | 1.4% | 12.6% |
| Grand Rapids, MI | $195,000 | 1.8% | 15.0% |
| Greensboro, NC | $155,000 | 1.1% | 14.2% |
| Greenville, SC | $176,400 | 0.9% | 11.8% |
| Hartford, CT | $237,400 | 0.5% | 7.0% |
| Houston, TX | $216,000 | 0.8% | 9.2% |
| Indianapolis, IN | $182,900 | 0.9% | 12.3% |
| Jacksonville, FL | $235,800 | 2.1% | 12.3% |
| Kansas City, MO | $200,300 | 0.9% | 10.0% |
| Knoxville, TN | $198,900 | 1.2% | 13.2% |
| Lake County, IL | $232,100 | 0.6% | 7.4% |
| Las Vegas, NV | $306,500 | 1.2% | 8.3% |
| Los Angeles, CA | $705,200 | 1.1% | 9.9% |
| Louisville, KY | $191,900 | 0.6% | 10.1% |
| Memphis, TN | $166,700 | 1.2% | 15.8% |
| Miami, FL | $339,800 | 1.0% | 9.1% |
| Milwaukee, WI | $222,700 | 0.4% | 13.8% |
| Minneapolis, MN | $294,100 | 0.6% | 8.7% |
| Montgomery County, PA | $352,800 | 0.8% | 9.8% |
| Nashville, TN | $300,800 | 0.8% | 9.3% |
| Nassau County, NY | $533,700 | 0.7% | 11.4% |
| New Brunswick, NJ | $382,200 | 0.9% | 11.4% |
| New Haven, CT | $240,500 | 0.7% | 9.2% |
| New Orleans, LA | $184,500 | 0.6% | 9.9% |
| Newark, NJ | $408,400 | 0.8% | 12.1% |
| North Port, FL | $260,000 | 1.6% | 10.4% |
| Oakland, CA | $856,100 | 1.6% | 11.4% |
| Oklahoma City, OK | $158,800 | 0.8% | 10.9% |
| Omaha, NE | $207,700 | 1.1% | 10.5% |
| Orlando, FL | $254,800 | 0.9% | 9.1% |
| Oxnard, CA | $653,400 | 1.1% | 9.1% |
| Philadelphia, PA | $211,700 | 0.8% | 11.9% |
| Phoenix, AZ | $312,600 | 1.9% | 15.9% |
| Pittsburgh, PA | $149,200 | 0.8% | 14.0% |
| Portland, OR | $434,800 | 1.3% | 9.8% |
| Providence, RI | $329,000 | 1.0% | 13.3% |
| Raleigh, NC | $280,600 | 1.1% | 10.2% |
| Richmond, VA | $257,500 | 0.6% | 10.2% |
| Riverside, CA | $376,200 | 1.8% | 14.6% |
| Rochester, NY | $156,400 | 0.5% | 9.7% |
| Sacramento, CA | $455,900 | 1.2% | 11.2% |
| Salt Lake City, UT | $397,700 | 1.5% | 13.5% |
| San Antonio, TX | $201,000 | 0.9% | 9.9% |
| San Diego, CA | $673,300 | 1.9% | 12.3% |
| San Francisco, CA | $1,367,700 | 0.6% | 0.6% |
| San Jose, CA | $1,249,200 | 2.0% | 10.4% |
| Seattle, WA | $626,800 | 2.0% | 13.3% |
| St. Louis, MO | $170,200 | 0.2% | 8.7% |
| Tacoma, WA | $419,300 | 1.6% | 17.0% |
| Tampa, FL | $245,100 | 1.4% | 12.2% |
| Tucson, AZ | $231,400 | 1.6% | 15.1% |
| Tulsa, OK | $144,600 | 0.8% | 10.8% |
| Urban Honolulu, HI | $735,100 | 0.6% | 5.4% |
| Virginia Beach, VA | $253,300 | 0.7% | 10.2% |
| Warren, MI | $229,500 | 0.8% | 10.4% |
| Washington, DC | $432,700 | 0.8% | 9.2% |
| West Palm Beach, FL | $299,800 | 1.0% | 9.3% |
| Worcester, MA | $309,100 | 0.7% | 11.8% |
| National | $337,500 | 0.0% | 15.4% |


