
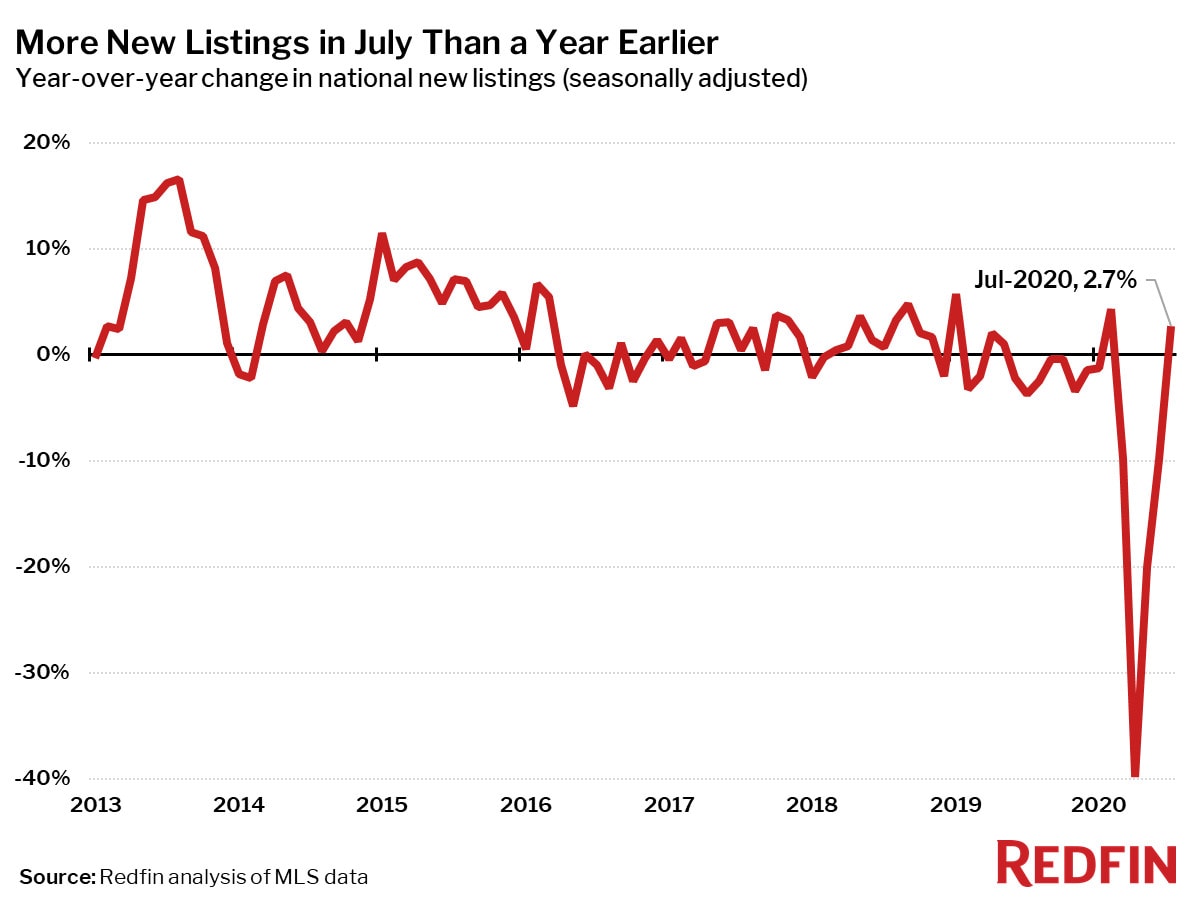
New listings surpassed 2019 levels for the first time since the pandemic began, up 3%, but failed to keep up with the rate of sales, up 5% year over year.
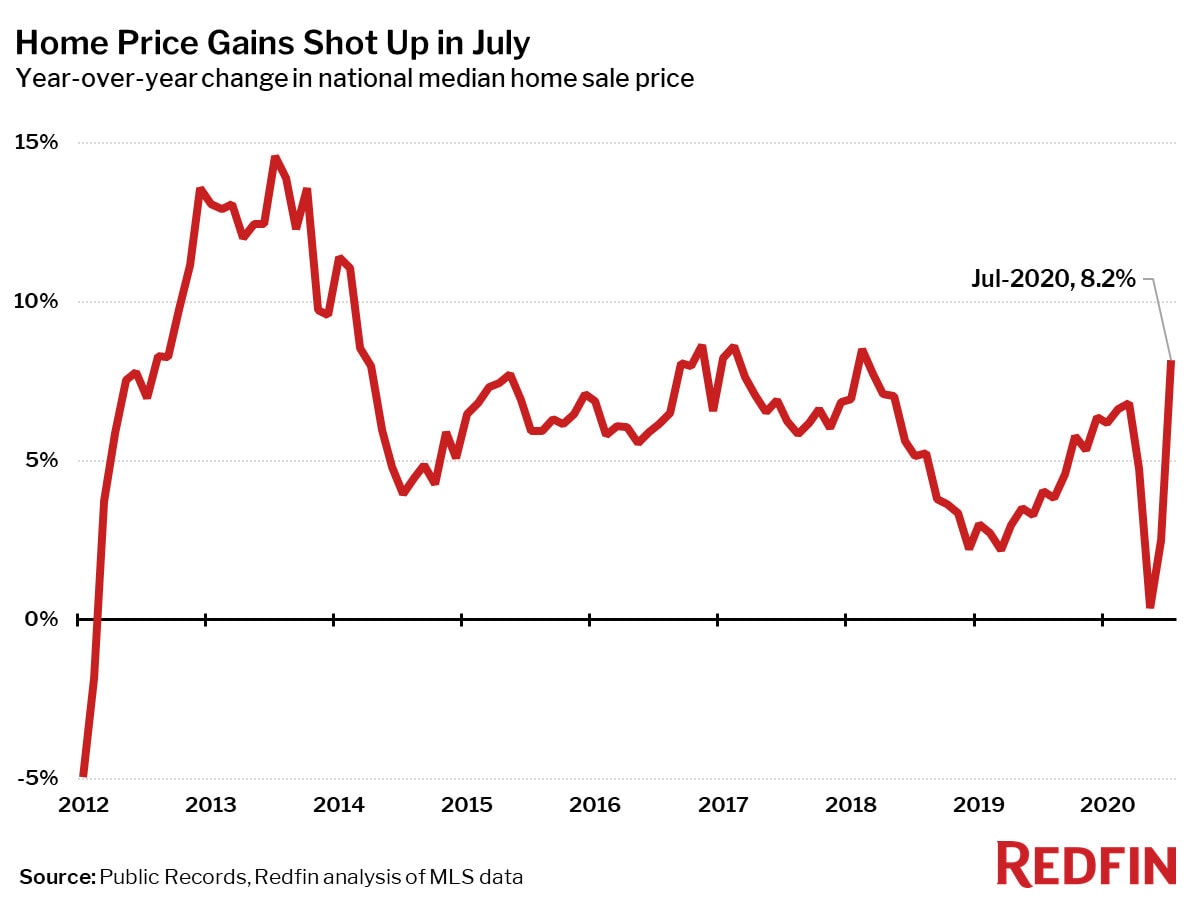
The national median home price rose 8.2% year over year to $323,800 in July. This is the third time in four months that prices have hit a new all-time high, as low mortgage rates continued to drive a spike in early homebuyer demand that has not been met with a matching surge in homes for sale.
“The housing market is intense right now,” said Albuquerque Redfin agent Jimmy Martinez. “We’ve got about half as many homes for sale as there were at this time last year, met by a big surge in people moving here from across the country in addition to lots of local homebuyers, all of which has pushed prices up dramatically from last year.”
The current rate of home price growth is the highest in over two years, and roughly on par with levels that were last seen between late 2016 and early 2018.
Median prices increased in all but one of the 85 largest metro areas Redfin tracks. The only area where prices fell was Honolulu (-4%). Meanwhile, Birmingham, AL (+16.8%), Bridgeport, CT (+16.5%) and Fort Lauderdale (+14.3%), saw the largest year-over-year increases.
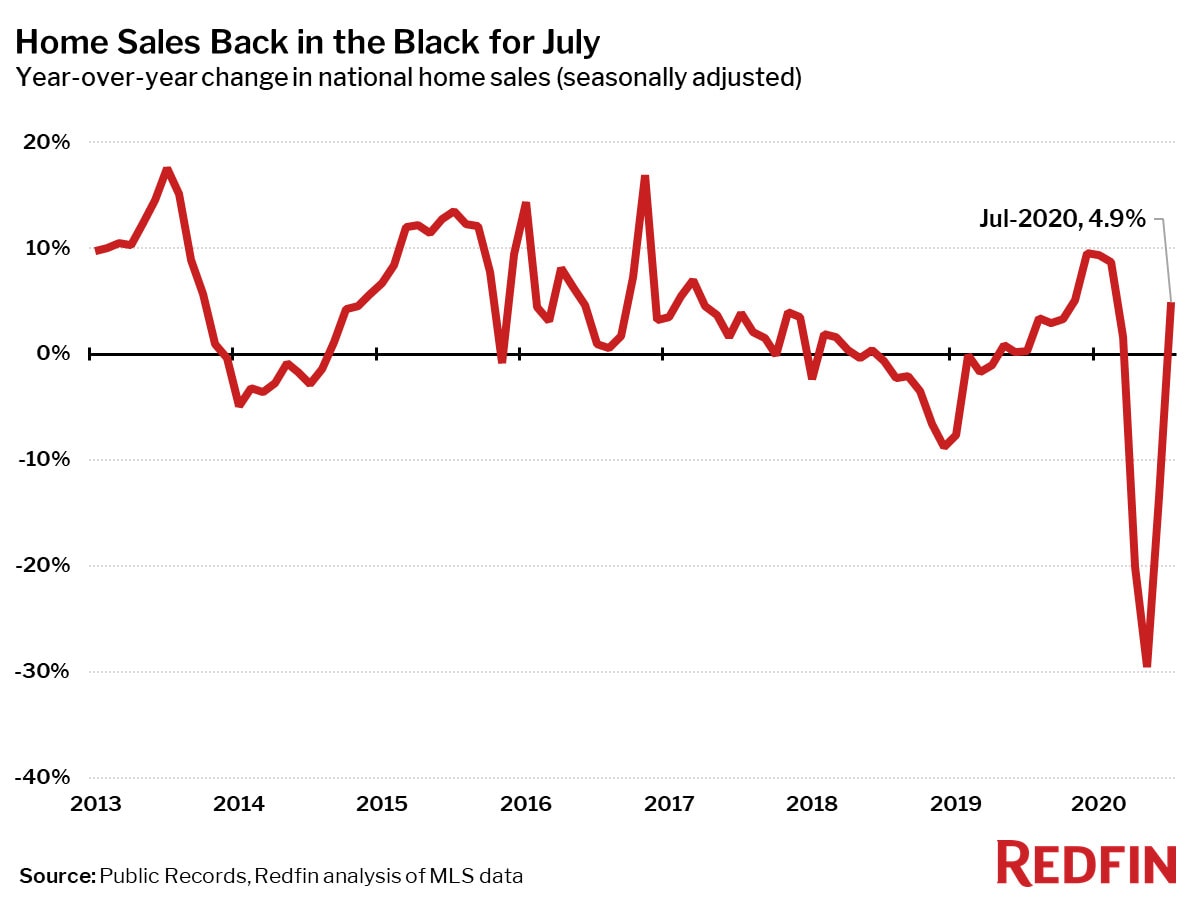
“Home sales made a whopping recovery in July,” said Redfin chief economist Daryl Fairweather. “It may seem like the Twilight Zone for the housing market to be performing better than ever while the economy is in the tank, but it goes to show that we are in truly unprecedented times. The housing market was incredibly robust going into the pandemic with household debt at its lowest level in 40 years. The less debt someone has, the less likely they are to be worried about affording a mortgage, which is as inexpensive as it’s ever been due to record-low interest rates, making a home purchase very appealing to people who are lucky enough to be securely employed.”
| Market Summary | July 2020 | Month-Over-Month | Year-Over-Year |
|---|---|---|---|
| Median sale price | $323,800 | 4.3% | 8.2% |
| Homes sold, seasonally-adjusted | 565,100 | 21.7% | 4.9% |
| Pending sales, seasonally-adjusted | 526,500 | 13.1% | 16.5% |
| New listings, seasonally-adjusted | 618,300 | 9.2% | 2.7% |
| All Homes for sale, seasonally-adjusted | 1,700,600 | -2.2% | -21.8% |
| Median days on market | 35 | -4 | -2 |
| Months of supply | 1.6 | -0.4 | -1 |
| Sold above list | 29.6% | 3.0 pts† | 4.3 pts† |
| Median Off-Market Redfin Estimate | $312,800 | 2.2% | 4.0% |
| Average Sale-to-list | 99.1% | 0.4 pts† | 0.5 pts† |
Home sales were up 4.9% in July from a year earlier on a seasonally-adjusted basis, a sharp improvement from the 13% drop in June, and the first year-over-year increase since the pandemic began in March.
Home sales increased in July from a year earlier in 67 of the 85 largest metro areas—nearly three times as many as in June. The largest gains in sales were in Bridgeport, CT (+34.9%), Baton Rouge, LA (+33.8%) and Lake County, IL (+26.4%). There are still a handful of markets where sales are falling though, with New York dominating the list of the biggest declines, led by Nassau County, NY (-38.9%), Buffalo, NY (-37.7%) and New York City (-35.2%).
Active listings—the count of all homes that were for sale at any time during the month—fell 21.8% year over year to their lowest level on record in July, the 11th-straight month of declines. The supply shortage is worsening because home sales are increasing at a faster rate than the number of homes being listed. At the same time, a growing share of homes is selling quickly, leaving few for sale from one month to the next.
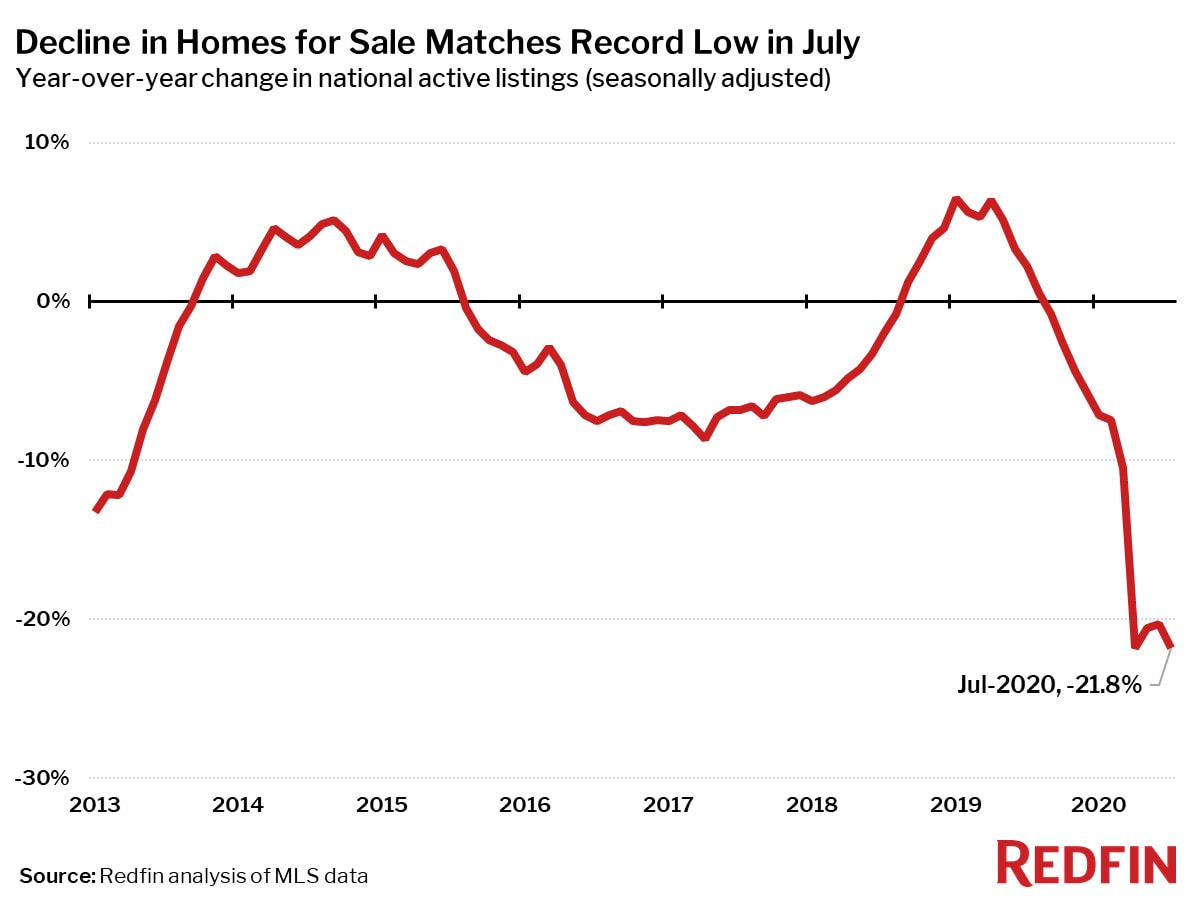
For the second month in a row, San Francisco was the only one of the 85 largest metros tracked by Redfin that posted a year-over-year increase in the count of seasonally-adjusted active listings of homes for sale. Active listings were up 50.9% there as expanding work-from-home policies continue to drive increased migration away from the city.
“A lot of people have been leaving the city of San Francisco since shelter-in-place began,” said Redfin San Francisco listing agent Joanna Rose. “Sellers want to leave the city and move into more suburban areas. They are fleeing city life for larger homes, bigger yards, home office setups, and so forth. A lot of San Francisco‘s highly tech-based workforce will be working from home for at least another year and they want out of their small city condos.”
Compared to a year ago, the biggest declines in active housing supply in July were in Tulsa (-57.7%), Allentown, PA (-54.5%) and Kansas City, MO (-52.2%).
The number of new listings of homes for sale increased 2.7% in July from a year earlier, the first such increase since February and only the second in the past 14 months. However, homes are still being purchased at a much faster rate than new homes are being listed for sale. Pending sales were up 16.5% from July 2019.
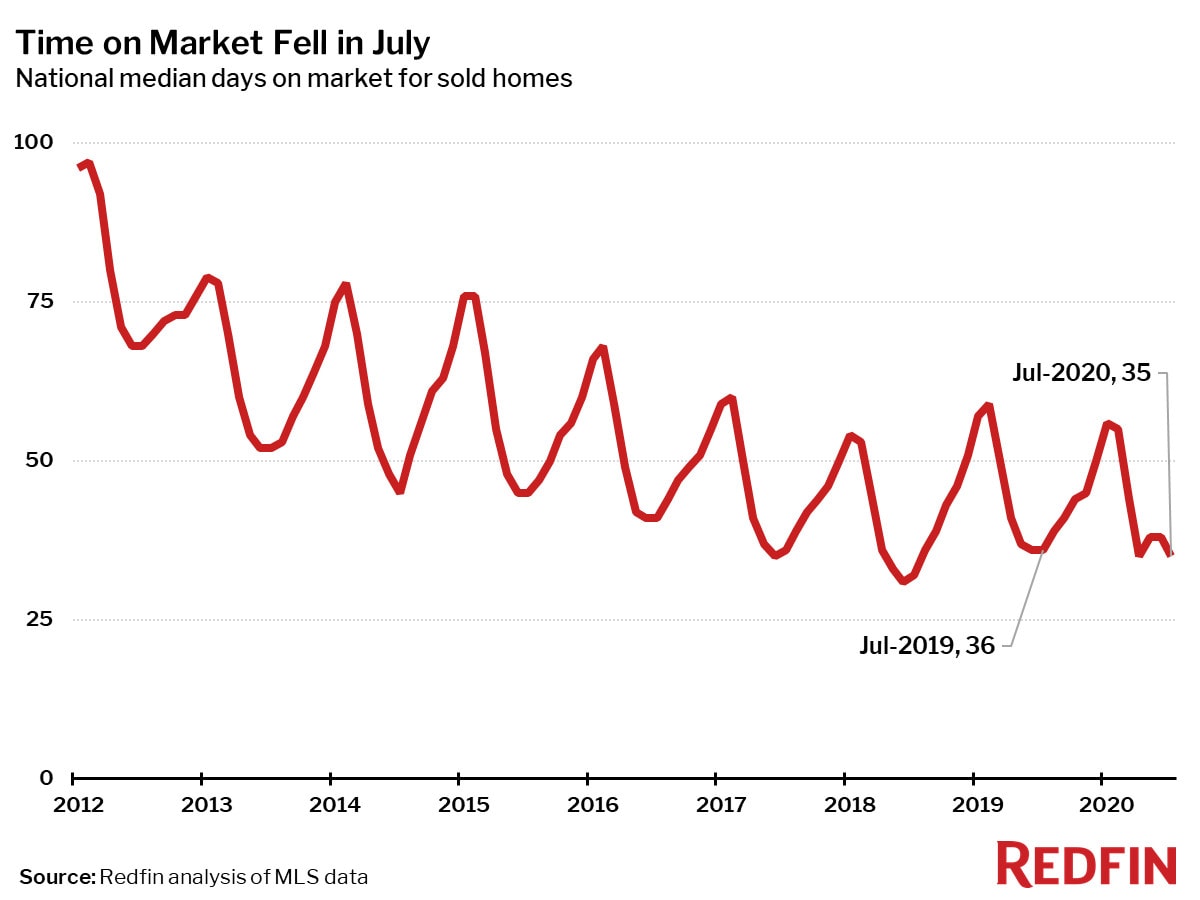
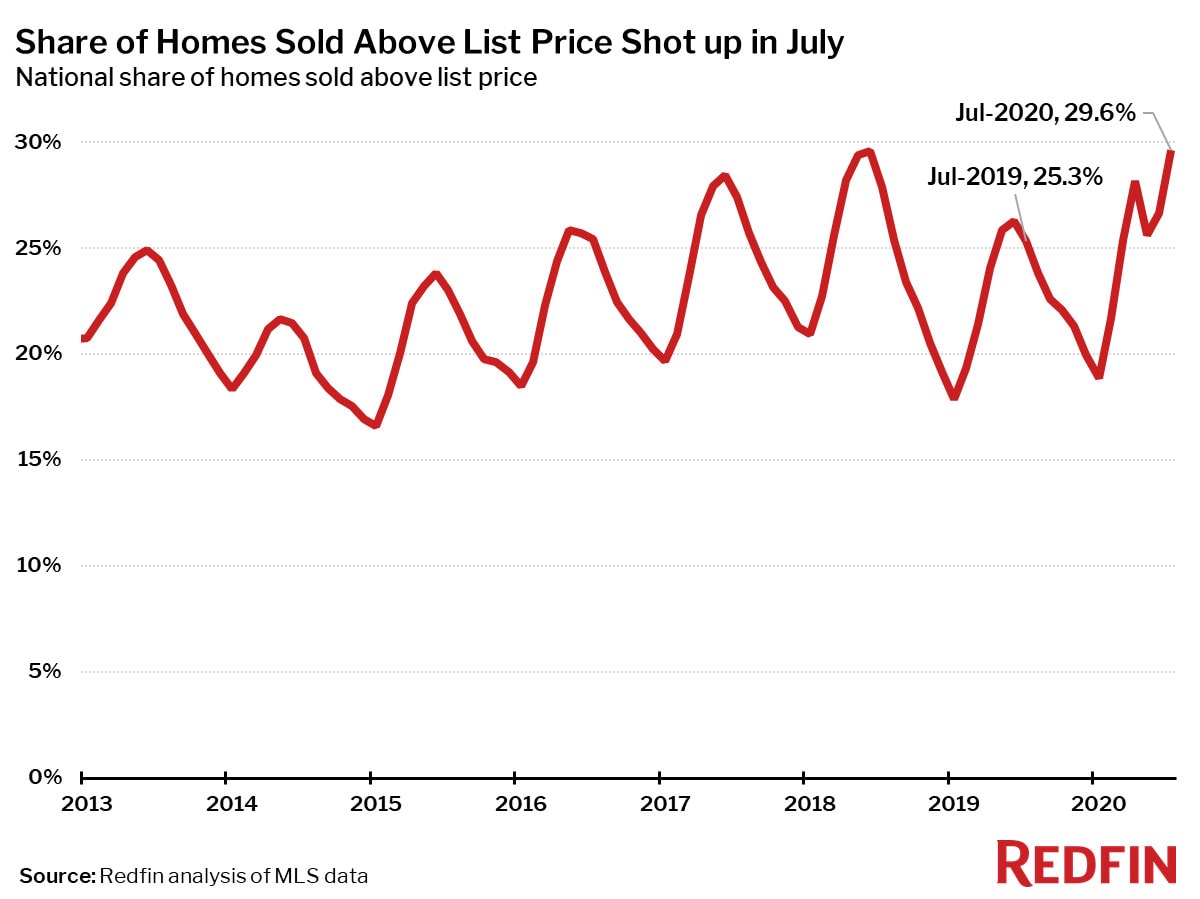
As a result of the imbalance between the number of homebuyers and sellers in the market, measures of competition such as time on market and the share of homes sold above list price trended toward an increasingly competitive market in July.
The typical home that sold in July went under contract in 35 days—one day less than a year earlier. The share of homes that found a buyer within two weeks of listing hit a record in July at 48.5%—up from just 35.7% in July 2019 and the highest level since we began measuring it in 2012.
In July 29.6% of homes sold above list price up from 25.3% a year earlier.
Other July Highlights
Competition
- Grand Rapids, MI and Tacoma, WA were tied for the fastest market, with half of all homes pending sale in just 7 days. Indianapolis and Seattle were the next fastest markets with 8 median days on market.
- The most competitive market in July was Rochester, NY where 60.5% of homes sold above list price, followed by 56.2% in Oakland, CA, 54.2% in Tacoma, WA, 51.0% in San Francisco, and 50.3% in San Jose, CA.
Prices
- Birmingham, AL had the nation’s highest price growth, rising 16.8% since last year to $246,500. Bridgeport, CT had the second highest growth at 16.5% year-over-year price growth, followed by Fort Lauderdale, FL (14.3%), West Palm Beach, FL (14%), and Milwaukee (14%).
- Only one major metro area saw price declines in July: Honolulu, HI (-4%).
Sales
- Bridgeport, CT led the nation in year-over-year sales growth, up 34.9%, followed by Baton Rouge, LA, up 33.8%. Lake County, IL rounded out the top three with sales up 26.4% from a year ago.
- Nassau County, NY saw the largest decline in sales since last year, falling 38.9%. Home sales in Buffalo, NY and New York declined by 37.7% and 35.2%, respectively.
Inventory
- San Francisco was the only metro with a year-over-year increase in the number of homes for sale, up 51% from 2019 in July.
- Tulsa, OK had the largest decrease in overall active listings, falling 57.7% since last July. Allentown, PA (-54%), Kansas City, MO (-52%), and Salt Lake City (-52%) also saw far fewer homes available on the market than a year ago.
Redfin Estimate
- Miami (90.4%) had the largest share of homes predicted to sell for below list price, according to Redfin Estimate data, followed by West Palm Beach, FL (88.2%) and Fort Lauderdale, FL (84.9%).
- Oakland, CA (86.9%) had the largest share of homes predicted to sell at or above list price, followed by San Jose, CA (85.6%) and San Francisco (84.4%).
Below are market-by-market breakdowns for prices, inventory, new listings and sales for markets with populations of 750,000 or more. For downloadable data on all of the markets Redfin tracks, visit the Redfin Data Center.
Median Sale Price
| Redfin Metro | Median Sale Price | Month-Over-Month | Year-Over-Year |
|---|---|---|---|
| Albany, NY | $241,000 | 8.0% | 7.1% |
| Allentown, PA | $239,900 | 4.3% | 9.0% |
| Anaheim, CA | $763,000 | 0.4% | 5.2% |
| Atlanta, GA | $278,000 | 3.0% | 9.0% |
| Austin, TX | $355,000 | 4.4% | 10.9% |
| Bakersfield, CA | $270,000 | 1.9% | 8.4% |
| Baltimore, MD | $320,000 | 3.2% | 6.8% |
| Baton Rouge, LA | $222,000 | 3.3% | 6.2% |
| Birmingham, AL | $246,500 | 2.9% | 16.8% |
| Boston, MA | $555,000 | 2.8% | 4.7% |
| Bridgeport, CT | $492,800 | 1.6% | 16.5% |
| Buffalo, NY | $180,000 | 9.1% | 6.5% |
| Camden, NJ | $230,000 | 5.1% | 9.5% |
| Charlotte, NC | $293,000 | 1.1% | 8.6% |
| Chicago, IL | $282,500 | 4.6% | 7.4% |
| Cincinnati, OH | $222,500 | 3.5% | 13.3% |
| Cleveland, OH | $175,000 | 1.2% | 2.9% |
| Columbus, OH | $254,900 | 2.0% | 10.9% |
| Dallas, TX | $324,000 | 2.9% | 8.0% |
| Dayton, OH | $170,000 | 0.6% | 9.7% |
| Denver, CO | $455,000 | 3.4% | 7.0% |
| Detroit, MI | $165,000 | 4.4% | 13.8% |
| El Paso, TX | $179,900 | 2.8% | 9.0% |
| Elgin, IL | $254,700 | 2.1% | 10.9% |
| Fort Lauderdale, FL | $320,000 | 3.2% | 14.3% |
| Fort Worth, TX | $265,000 | 1.9% | 6.0% |
| Frederick, MD | $448,400 | 3.1% | 6.8% |
| Fresno, CA | $318,500 | 2.7% | 13.7% |
| Grand Rapids, MI | $237,800 | 2.5% | 10.3% |
| Greensboro, NC | $205,000 | 2.5% | 12.0% |
| Greenville, SC | $237,000 | 0.9% | 5.3% |
| Hartford, CT | $257,200 | 5.0% | 9.2% |
| Houston, TX | $270,500 | 2.9% | 8.2% |
| Indianapolis, IN | $225,000 | 2.3% | 12.5% |
| Jacksonville, FL | $265,000 | 3.9% | 8.2% |
| Kansas City, MO | $255,500 | 2.2% | 10.1% |
| Knoxville, TN | $249,000 | 5.1% | 12.7% |
| Lake County, IL | $268,000 | 8.5% | 6.1% |
| Las Vegas, NV | $310,000 | 0.6% | 8.8% |
| Los Angeles, CA | $700,000 | 6.9% | 7.7% |
| Louisville, KY | $235,000 | 9.3% | 9.3% |
| McAllen, TX | $175,500 | 5.1% | 6.4% |
| Memphis, TN | $220,000 | 2.3% | 5.3% |
| Miami, FL | $340,000 | 0.0% | 7.9% |
| Milwaukee, WI | $260,000 | 3.8% | 14.0% |
| Minneapolis, MN | $313,000 | 2.5% | 9.8% |
| Montgomery County, PA | $360,000 | 3.6% | 7.9% |
| Nashville, TN | $328,800 | 2.8% | 9.1% |
| Nassau County, NY | $482,500 | 2.2% | 1.6% |
| New Brunswick, NJ | $365,000 | 2.8% | 9.0% |
| New Haven, CT | $255,000 | 6.2% | 10.9% |
| New Orleans, LA | $260,000 | 7.0% | 11.3% |
| New York, NY | $530,000 | 1.9% | 1.0% |
| Newark, NJ | $415,000 | 3.8% | 8.9% |
| North Port, FL | $312,000 | 7.8% | 13.5% |
| Oakland, CA | $819,000 | 2.5% | 9.9% |
| Oklahoma City, OK | $207,000 | 1.0% | 11.3% |
| Omaha, NE | $240,000 | 4.3% | 9.1% |
| Orlando, FL | $280,000 | 0.4% | 8.5% |
| Oxnard, CA | $659,000 | 2.3% | 7.2% |
| Philadelphia, PA | $249,900 | 0.0% | 10.6% |
| Phoenix, AZ | $320,000 | 3.2% | 13.5% |
| Pittsburgh, PA | $200,800 | 0.9% | 9.4% |
| Portland, OR | $439,900 | 2.3% | 8.6% |
| Providence, RI | $325,000 | 3.7% | 10.2% |
| Raleigh, NC | $313,000 | 3.3% | 6.8% |
| Richmond, VA | $289,000 | 5.1% | 9.1% |
| Riverside, CA | $420,000 | 2.9% | 10.5% |
| Rochester, NY | $175,000 | 8.7% | 6.4% |
| Sacramento, CA | $465,000 | 4.5% | 10.7% |
| Salt Lake City, UT | $380,000 | 2.4% | 9.2% |
| San Antonio, TX | $260,000 | 4.0% | 8.8% |
| San Diego, CA | $645,000 | 5.9% | 10.3% |
| San Francisco, CA | $1,475,000 | -4.8% | 3.5% |
| San Jose, CA | $1,200,000 | 2.1% | 6.7% |
| Seattle, WA | $625,000 | 1.6% | 11.2% |
| St. Louis, MO | $215,000 | 2.4% | 13.2% |
| Tacoma, WA | $426,500 | 4.0% | 13.5% |
| Tampa, FL | $265,000 | 2.7% | 10.7% |
| Tucson, AZ | $252,000 | 2.9% | 8.2% |
| Tulsa, OK | $201,200 | 3.2% | 10.2% |
| Honolulu, HI | $600,000 | 1.1% | -4.0% |
| Virginia Beach, VA | $274,900 | 7.8% | 10.0% |
| Warren, MI | $247,100 | 4.7% | 9.8% |
| Washington, DC | $470,000 | 6.8% | 11.4% |
| West Palm Beach, FL | $325,000 | 3.7% | 14.0% |
| Worcester, MA | $321,800 | 7.3% | 12.9% |
| National | $323,800 | 4.3% | 8.2% |
Homes Sold
| Redfin Metro | Homes Sold | Month-Over-Month | Year-Over-Year |
|---|---|---|---|
| Albany, NY | 883 | 34.2% | -18.4% |
| Allentown, PA | 1,072 | 76.0% | 2.2% |
| Anaheim, CA | 3,021 | 39.1% | 4.6% |
| Atlanta, GA | 11,500 | 8.5% | 6.7% |
| Austin, TX | 4,169 | 6.1% | 12.8% |
| Bakersfield, CA | 908 | 15.4% | 4.2% |
| Baltimore, MD | 4,742 | 13.3% | 9.9% |
| Baton Rouge, LA | 1,353 | 12.1% | 33.8% |
| Birmingham, AL | 1,677 | -2.6% | 5.1% |
| Boston, MA | 5,340 | 31.8% | -5.8% |
| Bridgeport, CT | 1,750 | 59.2% | 34.9% |
| Buffalo, NY | 774 | 15.5% | -37.7% |
| Camden, NJ | 2,103 | 20.2% | 5.6% |
| Charlotte, NC | 5,155 | 6.6% | 11.9% |
| Chicago, IL | 10,821 | 32.1% | 7.3% |
| Cincinnati, OH | 3,461 | 10.6% | 8.6% |
| Cleveland, OH | 3,286 | 20.0% | 9.1% |
| Columbus, OH | 3,259 | 9.0% | 1.7% |
| Dallas, TX | 8,171 | 12.3% | 19.4% |
| Dayton, OH | 1,253 | 7.3% | -1.0% |
| Denver, CO | 6,840 | 16.7% | 22.3% |
| Detroit, MI | 2,174 | 31.5% | 2.5% |
| El Paso, TX | 931 | 5.7% | 18.0% |
| Elgin, IL | 1,462 | 28.5% | 16.8% |
| Fort Lauderdale, FL | 3,002 | 20.3% | -12.5% |
| Fort Worth, TX | 3,970 | 10.7% | 14.8% |
| Frederick, MD | 1,979 | 20.7% | 7.0% |
| Fresno, CA | 843 | 1.7% | -5.1% |
| Grand Rapids, MI | 1,784 | 22.4% | 5.0% |
| Greensboro, NC | 1,043 | 9.3% | 7.2% |
| Greenville, SC | 1,387 | -3.7% | 16.1% |
| Hartford, CT | 1,868 | 26.5% | 15.2% |
| Houston, TX | 10,876 | 14.3% | 17.5% |
| Indianapolis, IN | 3,863 | 10.3% | 7.3% |
| Jacksonville, FL | 3,208 | 10.1% | 16.1% |
| Kansas City, MO | 4,120 | 8.6% | 9.5% |
| Knoxville, TN | 1,580 | 9.0% | 12.6% |
| Lake County, IL | 1,672 | 32.8% | 26.4% |
| Las Vegas, NV | 3,922 | 36.6% | -0.1% |
| Los Angeles, CA | 6,275 | 35.6% | -4.2% |
| Louisville, KY | 1,717 | 6.0% | 7.2% |
| McAllen, TX | 343 | -0.9% | 17.1% |
| Memphis, TN | 1,396 | 12.0% | 3.6% |
| Miami, FL | 2,429 | 20.5% | -13.5% |
| Milwaukee, WI | 2,302 | 17.1% | 0.0% |
| Minneapolis, MN | 6,992 | 11.2% | 2.3% |
| Montgomery County, PA | 2,980 | 69.2% | 1.8% |
| Nashville, TN | 4,491 | 9.0% | 10.4% |
| Nassau County, NY | 1,900 | -0.5% | -38.9% |
| New Brunswick, NJ | 3,615 | 30.8% | 1.2% |
| New Haven, CT | 1,233 | 27.6% | 9.5% |
| New Orleans, LA | 1,565 | 6.1% | 10.5% |
| New York, NY | 3,775 | 13.9% | -35.2% |
| Newark, NJ | 2,544 | 32.0% | -4.9% |
| North Port, FL | 2,432 | 19.0% | 22.0% |
| Oakland, CA | 2,788 | 27.8% | 6.0% |
| Oklahoma City, OK | 2,571 | 3.0% | 9.7% |
| Omaha, NE | 1,602 | 2.4% | 10.9% |
| Orlando, FL | 4,520 | 15.6% | -1.2% |
| Oxnard, CA | 880 | 31.0% | 1.4% |
| Philadelphia, PA | 2,461 | 55.8% | -2.5% |
| Phoenix, AZ | 9,898 | 7.5% | 9.1% |
| Pittsburgh, PA | 3,204 | 77.2% | 22.8% |
| Portland, OR | 4,315 | 22.2% | 10.8% |
| Providence, RI | 2,206 | 27.0% | -2.5% |
| Raleigh, NC | 3,048 | 5.4% | 10.6% |
| Richmond, VA | 1,952 | 0.9% | -1.9% |
| Riverside, CA | 6,004 | 28.3% | 10.5% |
| Rochester, NY | 936 | 18.5% | -28.4% |
| Sacramento, CA | 3,522 | 19.9% | 9.3% |
| Salt Lake City, UT | 2,073 | 6.1% | 7.8% |
| San Antonio, TX | 3,773 | 7.0% | 11.9% |
| San Diego, CA | 3,771 | 20.1% | 7.6% |
| San Francisco, CA | 1,054 | 31.6% | 1.0% |
| San Jose, CA | 1,498 | 24.4% | 11.1% |
| Seattle, WA | 4,943 | 13.2% | 4.9% |
| St. Louis, MO | 4,546 | 8.4% | 8.5% |
| Tacoma, WA | 1,545 | 8.1% | -4.7% |
| Tampa, FL | 6,657 | 8.1% | 8.4% |
| Tucson, AZ | 1,821 | 7.1% | 8.7% |
| Tulsa, OK | 1,602 | 9.4% | 16.7% |
| Honolulu, HI | 779 | 30.5% | -11.9% |
| Virginia Beach, VA | 3,132 | 10.1% | 16.5% |
| Warren, MI | 4,746 | 39.8% | 13.0% |
| Washington, DC | 7,866 | 10.4% | 5.4% |
| West Palm Beach, FL | 3,273 | 28.5% | 1.0% |
| Worcester, MA | 1,248 | 21.4% | 2.8% |
| National | 565,100 | 21.7% | 4.9% |
New Listings
| Redfin Metro | New Listings | Month-Over-Month | Year-Over-Year |
|---|---|---|---|
| Albany, NY | 1,358 | -0.4% | 4.4% |
| Allentown, PA | 651 | -24.9% | -45.0% |
| Anaheim, CA | 3,695 | 17.3% | 10.6% |
| Atlanta, GA | 11,318 | 1.4% | -4.9% |
| Austin, TX | 4,465 | 12.3% | 13.3% |
| Bakersfield, CA | 997 | 8.8% | -6.6% |
| Baltimore, MD | 4,864 | 5.2% | 5.6% |
| Baton Rouge, LA | 776 | -22.5% | -35.3% |
| Birmingham, AL | 1,627 | 4.5% | -6.0% |
| Boston, MA | 6,319 | -6.2% | 28.1% |
| Bridgeport, CT | 2,334 | -0.3% | 76.6% |
| Buffalo, NY | 1,635 | 8.8% | 5.4% |
| Camden, NJ | 2,290 | 10.0% | 7.1% |
| Charlotte, NC | 3,763 | -5.3% | -22.6% |
| Chicago, IL | 13,707 | 5.1% | 14.6% |
| Cincinnati, OH | 3,667 | 5.6% | 4.5% |
| Cleveland, OH | 3,501 | 3.5% | -1.8% |
| Columbus, OH | 3,482 | 7.0% | -1.1% |
| Dallas, TX | 8,056 | 0.2% | 0.0% |
| Dayton, OH | 1,384 | 4.1% | -0.1% |
| Denver, CO | 6,810 | 3.8% | 18.0% |
| Detroit, MI | 2,716 | 2.8% | -8.1% |
| El Paso, TX | 995 | -5.1% | -4.5% |
| Elgin, IL | 1,491 | 2.9% | 9.7% |
| Fort Lauderdale, FL | 3,685 | 3.4% | -2.3% |
| Fort Worth, TX | 3,935 | 1.4% | -3.0% |
| Frederick, MD | 1,999 | 2.5% | 12.5% |
| Fresno, CA | 936 | 19.7% | -3.3% |
| Grand Rapids, MI | 1,856 | 1.9% | -0.7% |
| Greensboro, NC | 775 | -0.1% | -24.9% |
| Greenville, SC | 1,494 | 12.4% | -0.3% |
| Hartford, CT | 2,129 | -0.2% | 17.6% |
| Houston, TX | 11,658 | 7.6% | 4.6% |
| Indianapolis, IN | 3,486 | 6.1% | -7.1% |
| Jacksonville, FL | 2,925 | -3.0% | -6.1% |
| Kansas City, MO | 1,915 | -35.4% | -51.2% |
| Knoxville, TN | 1,280 | -4.5% | -10.6% |
| Lake County, IL | 1,793 | 1.9% | 8.2% |
| Las Vegas, NV | 4,396 | 19.9% | -0.8% |
| Los Angeles, CA | 8,381 | 16.0% | 5.1% |
| Louisville, KY | 1,725 | 2.3% | -7.1% |
| McAllen, TX | 377 | -3.3% | -24.9% |
| Memphis, TN | 1,352 | -1.7% | -13.7% |
| Miami, FL | 3,782 | -1.3% | -1.0% |
| Milwaukee, WI | 2,446 | 1.0% | 5.6% |
| Minneapolis, MN | 7,305 | 5.4% | 5.1% |
| Montgomery County, PA | 3,339 | -3.5% | 22.8% |
| Nashville, TN | 4,666 | -1.9% | 3.6% |
| Nassau County, NY | 4,521 | 1.3% | 26.3% |
| New Brunswick, NJ | 5,181 | 10.7% | 29.8% |
| New Haven, CT | 1,504 | 3.9% | 20.4% |
| New Orleans, LA | 1,666 | 4.7% | 3.6% |
| New York, NY | 12,172 | 17.9% | 65.0% |
| Newark, NJ | 3,500 | 1.5% | 33.2% |
| North Port, FL | 2,375 | 11.1% | 20.9% |
| Oakland, CA | 3,130 | 10.7% | 7.3% |
| Oklahoma City, OK | 2,596 | -1.0% | 1.4% |
| Omaha, NE | 1,459 | -2.9% | -1.4% |
| Orlando, FL | 4,977 | 5.0% | 4.5% |
| Oxnard, CA | 936 | 8.1% | -5.6% |
| Philadelphia, PA | 3,388 | 4.9% | 20.5% |
| Phoenix, AZ | 8,977 | 11.7% | 13.0% |
| Pittsburgh, PA | 3,385 | 1.0% | 16.5% |
| Portland, OR | 4,694 | 16.3% | 11.5% |
| Providence, RI | 2,517 | 7.4% | 5.0% |
| Raleigh, NC | 3,076 | 12.7% | 14.6% |
| Richmond, VA | 1,958 | -0.6% | -2.7% |
| Riverside, CA | 5,971 | 11.8% | -4.5% |
| Rochester, NY | 1,475 | -3.8% | 0.4% |
| Sacramento, CA | 3,576 | 7.3% | -1.5% |
| Salt Lake City, UT | 928 | -41.1% | -51.8% |
| San Antonio, TX | 3,759 | 6.6% | -4.9% |
| San Diego, CA | 4,139 | 14.3% | 8.2% |
| San Francisco, CA | 1,708 | 12.7% | 76.8% |
| San Jose, CA | 1,683 | 11.5% | 19.4% |
| Seattle, WA | 5,978 | 14.5% | 24.6% |
| St. Louis, MO | 2,890 | -21.3% | -35.9% |
| Tacoma, WA | 1,848 | 23.8% | 11.8% |
| Tampa, FL | 6,296 | 6.7% | -0.2% |
| Tucson, AZ | 1,636 | 10.4% | 2.8% |
| Tulsa, OK | 685 | -36.6% | -54.7% |
| Honolulu, HI | 830 | 5.5% | -29.8% |
| Virginia Beach, VA | 3,143 | 12.0% | 10.6% |
| Warren, MI | 5,272 | -1.2% | -2.0% |
| Washington, DC | 8,663 | 13.2% | 20.3% |
| West Palm Beach, FL | 3,751 | 1.6% | 12.7% |
| Worcester, MA | 1,286 | -8.3% | -3.5% |
| National | 618,300 | 9.2% | 2.7% |
All Homes for Sale
| Redfin Metro | All Homes for Sale | Month-Over-Month | Year-Over-Year |
|---|---|---|---|
| Albany, NY | 3,230 | -3.1% | -28.6% |
| Allentown, PA | 1,697 | -20.6% | -54.5% |
| Anaheim, CA | 10,236 | 5.7% | -20.8% |
| Atlanta, GA | 31,656 | -6.7% | -18.6% |
| Austin, TX | 9,862 | -3.5% | -18.4% |
| Bakersfield, CA | 2,340 | -4.1% | -24.8% |
| Baltimore, MD | 12,027 | -3.5% | -26.0% |
| Baton Rouge, LA | 3,156 | -13.2% | -38.4% |
| Birmingham, AL | 5,172 | -3.4% | -24.0% |
| Boston, MA | 14,710 | -0.7% | -11.9% |
| Bridgeport, CT | 7,692 | 6.6% | -5.2% |
| Buffalo, NY | 2,939 | 2.0% | -23.5% |
| Camden, NJ | 5,760 | -4.0% | -33.7% |
| Charlotte, NC | 12,594 | -8.5% | -28.1% |
| Chicago, IL | 36,759 | 1.1% | -17.6% |
| Cincinnati, OH | 10,076 | 1.6% | -15.7% |
| Cleveland, OH | 8,573 | -0.9% | -30.2% |
| Columbus, OH | 8,856 | 2.9% | -14.8% |
| Dallas, TX | 22,625 | -6.2% | -21.4% |
| Dayton, OH | 3,236 | 1.3% | -18.0% |
| Denver, CO | 13,047 | -4.3% | -14.1% |
| Detroit, MI | 6,915 | -2.5% | -18.1% |
| El Paso, TX | 3,038 | -8.4% | -20.8% |
| Elgin, IL | 3,545 | -4.4% | -23.4% |
| Fort Lauderdale, FL | 15,973 | -0.8% | -9.5% |
| Fort Worth, TX | 10,187 | -5.4% | -17.1% |
| Frederick, MD | 4,765 | -1.5% | -18.4% |
| Fresno, CA | 1,862 | -3.0% | -33.8% |
| Grand Rapids, MI | 3,618 | -3.5% | -19.8% |
| Greensboro, NC | 2,420 | -9.9% | -32.8% |
| Greenville, SC | 5,019 | -2.4% | -15.6% |
| Hartford, CT | 6,315 | 0.6% | -20.5% |
| Houston, TX | 33,703 | -3.6% | -17.3% |
| Indianapolis, IN | 6,817 | -3.7% | -28.1% |
| Jacksonville, FL | 9,433 | -6.8% | -16.8% |
| Kansas City, MO | 5,361 | -24.7% | -52.2% |
| Knoxville, TN | 4,617 | -3.6% | -17.2% |
| Lake County, IL | 5,090 | -0.9% | -24.0% |
| Las Vegas, NV | 13,361 | 1.4% | -20.7% |
| Los Angeles, CA | 23,327 | 6.2% | -16.7% |
| Louisville, KY | 4,002 | -2.5% | -22.6% |
| McAllen, TX | 1,701 | -10.1% | -29.0% |
| Memphis, TN | 3,555 | -3.6% | -25.2% |
| Miami, FL | 19,676 | -3.1% | -8.3% |
| Milwaukee, WI | 7,170 | 2.6% | -7.8% |
| Minneapolis, MN | 16,065 | -1.0% | -14.4% |
| Montgomery County, PA | 8,279 | -1.0% | -17.3% |
| Nashville, TN | 13,594 | -9.9% | -15.6% |
| Nassau County, NY | 13,614 | 6.7% | -15.4% |
| New Brunswick, NJ | 13,754 | 2.2% | -23.2% |
| New Haven, CT | 4,474 | 2.9% | -20.0% |
| New Orleans, LA | 5,103 | -5.4% | -15.9% |
| New York, NY | 43,291 | 16.3% | -1.0% |
| Newark, NJ | 10,389 | 2.4% | -16.8% |
| North Port, FL | 7,533 | -6.6% | -14.2% |
| Oakland, CA | 6,135 | 2.6% | -14.1% |
| Oklahoma City, OK | 6,313 | -2.4% | -16.2% |
| Omaha, NE | 2,768 | -7.0% | -18.3% |
| Orlando, FL | 13,385 | -3.3% | -11.8% |
| Oxnard, CA | 2,841 | 0.7% | -20.4% |
| Philadelphia, PA | 9,529 | 4.5% | -6.9% |
| Phoenix, AZ | 22,231 | -7.4% | -17.2% |
| Pittsburgh, PA | 11,655 | 6.9% | -4.1% |
| Portland, OR | 9,487 | 1.4% | -21.5% |
| Providence, RI | 6,405 | 0.5% | -24.8% |
| Raleigh, NC | 8,489 | -2.6% | -13.4% |
| Richmond, VA | 4,165 | -4.3% | -24.7% |
| Riverside, CA | 16,557 | -4.6% | -29.9% |
| Rochester, NY | 2,729 | -4.8% | -22.5% |
| Sacramento, CA | 7,491 | -4.9% | -22.7% |
| Salt Lake City, UT | 2,619 | -30.2% | -51.7% |
| San Antonio, TX | 10,562 | -7.8% | -23.9% |
| San Diego, CA | 8,895 | 0.1% | -22.7% |
| San Francisco, CA | 3,932 | 15.3% | 50.9% |
| San Jose, CA | 3,753 | 2.9% | -12.9% |
| Seattle, WA | 10,595 | 5.5% | -16.9% |
| St. Louis, MO | 8,983 | -13.3% | -37.0% |
| Tacoma, WA | 3,087 | 7.7% | -19.7% |
| Tampa, FL | 15,367 | -7.8% | -23.4% |
| Tucson, AZ | 4,846 | -6.0% | -16.5% |
| Tulsa, OK | 2,123 | -28.0% | -57.7% |
| Honolulu, HI | 3,874 | 0.1% | -22.0% |
| Virginia Beach, VA | 7,386 | -3.1% | -26.3% |
| Warren, MI | 12,065 | -0.7% | -17.9% |
| Washington, DC | 19,245 | 1.3% | -13.6% |
| West Palm Beach, FL | 16,004 | -1.1% | -6.0% |
| Worcester, MA | 3,079 | -7.1% | -28.9% |
| National | 1,700,600 | -2.2% | -21.8% |
Median Off-Market Redfin Estimate
| Redfin Metro | Estimate | Month-Over-Month | Year-Over-Year |
|---|---|---|---|
| Albany, NY | $200,200 | 0.6% | -8.8% |
| Allentown, PA | $215,000 | 0.9% | -0.1% |
| Anaheim, CA | $741,200 | 0.5% | 1.8% |
| Atlanta, GA | $236,400 | 0.9% | 2.7% |
| Austin, TX | $306,200 | 1.1% | -3.2% |
| Bakersfield, CA | $199,600 | 1.0% | -11.6% |
| Baltimore, MD | $274,500 | 0.7% | 3.7% |
| Baton Rouge, LA | $130,700 | 0.5% | -23.6% |
| Birmingham, AL | $137,300 | 0.6% | -10.3% |
| Boston, MA | $533,000 | 0.8% | 7.3% |
| Bridgeport, CT | $394,800 | 0.5% | -30.7% |
| Buffalo, NY | $153,900 | 0.8% | -5.5% |
| Camden, NJ | $209,600 | 1.1% | 4.2% |
| Charlotte, NC | $215,000 | 1.1% | 3.9% |
| Chicago, IL | $264,100 | 0.6% | 6.4% |
| Cincinnati, OH | $168,700 | 0.9% | -3.1% |
| Cleveland, OH | $144,100 | 1.1% | 1.9% |
| Columbus, OH | $203,000 | 0.9% | 3.4% |
| Dallas, TX | $261,100 | 0.8% | -0.9% |
| Dayton, OH | $128,400 | 0.8% | 5.7% |
| Denver, CO | $425,800 | 0.7% | 2.7% |
| Detroit, MI | $108,500 | 2.0% | 3.7% |
| Elgin, IL | $232,900 | 0.6% | 1.7% |
| Fort Lauderdale, FL | $277,300 | 0.5% | 2.9% |
| Fort Worth, TX | $223,900 | 0.8% | 1.1% |
| Frederick, MD | $419,300 | 0.6% | 3.2% |
| Fresno, CA | $264,800 | 0.8% | 1.3% |
| Grand Rapids, MI | $176,200 | 1.3% | 4.9% |
| Greensboro, NC | $139,500 | 1.7% | -4.5% |
| Greenville, SC | $163,800 | 0.9% | -13.7% |
| Hartford, CT | $226,600 | 0.6% | -28.7% |
| Houston, TX | $201,300 | 0.8% | -5.5% |
| Indianapolis, IN | $168,600 | 0.9% | 1.0% |
| Jacksonville, FL | $215,900 | 0.7% | -3.9% |
| Kansas City, MO | $186,600 | 0.6% | -2.0% |
| Knoxville, TN | $181,900 | 1.1% | 2.7% |
| Lake County, IL | $220,200 | 1.4% | -2.9% |
| Las Vegas, NV | $288,400 | 0.4% | 2.8% |
| Los Angeles, CA | $654,200 | 0.5% | 3.1% |
| Louisville, KY | $180,000 | 0.8% | 2.7% |
| Memphis, TN | $151,600 | 1.5% | 3.9% |
| Miami, FL | $318,400 | 0.4% | 5.4% |
| Milwaukee, WI | $210,800 | 1.3% | 7.7% |
| Minneapolis, MN | $277,900 | 0.8% | 3.3% |
| Montgomery County, PA | $328,400 | 0.5% | 2.1% |
| Nashville, TN | $282,900 | 0.8% | 6.1% |
| Nassau County, NY | $486,000 | 0.6% | 6.8% |
| New Brunswick, NJ | $349,600 | 0.8% | 5.0% |
| New Orleans, LA | $173,300 | 1.1% | -6.7% |
| Newark, NJ | $371,700 | 0.4% | 0.5% |
| North Port, FL | $239,800 | 0.6% | -9.5% |
| Oakland, CA | $786,100 | 0.4% | 1.3% |
| Oklahoma City, OK | $148,900 | 0.7% | -2.6% |
| Omaha, NE | $193,000 | 1.1% | 7.2% |
| Orlando, FL | $239,200 | 0.7% | 0.3% |
| Oxnard, CA | $606,500 | 0.6% | 0.0% |
| Philadelphia, PA | $195,500 | 0.8% | 4.7% |
| Phoenix, AZ | $279,200 | 0.9% | 0.7% |
| Pittsburgh, PA | $133,800 | 0.9% | -10.7% |
| Portland, OR | $406,200 | 0.8% | 0.6% |
| Providence, RI | $300,200 | 0.9% | 0.4% |
| Raleigh, NC | $262,700 | 0.7% | -3.9% |
| Richmond, VA | $241,500 | 1.0% | 5.0% |
| Riverside, CA | $336,100 | 0.8% | -9.6% |
| Rochester, NY | $147,500 | 0.6% | -2.7% |
| Sacramento, CA | $419,100 | 0.7% | 0.3% |
| Salt Lake City, UT | $362,800 | 0.8% | 7.7% |
| San Antonio, TX | $186,600 | 0.7% | -6.6% |
| San Diego, CA | $615,500 | 0.8% | 2.3% |
| San Francisco, CA | $1,373,300 | 0.0% | 2.6% |
| San Jose, CA | $1,163,600 | 0.1% | -1.5% |
| Seattle, WA | $576,100 | 0.7% | 0.7% |
| St. Louis, MO | $161,500 | 0.9% | -2.0% |
| Tacoma, WA | $376,900 | 1.1% | 2.6% |
| Tampa, FL | $224,900 | 0.8% | 0.6% |
| Tucson, AZ | $208,500 | 0.8% | -5.2% |
| Tulsa, OK | $134,700 | 0.9% | -7.4% |
| Honolulu, HI | $702,500 | 0.1% | 1.4% |
| Virginia Beach, VA | $236,700 | 0.8% | 3.7% |
| Warren, MI | $214,100 | 1.2% | 2.2% |
| Washington, DC | $406,800 | 0.8% | 2.7% |
| West Palm Beach, FL | $280,500 | 0.6% | 3.1% |
| Worcester, MA | $287,400 | 1.1% | -1.5% |
| National | $312,800 | 2.2% | 4.0% |


