
The housing market’s performance over the first six months of the year left a lot to be desired. But while the Federal Reserve says the housing market has “lost traction,” based in large part on this year’s underperformance in residential construction and low household formation, Redfin expects the market in urban areas to regain its footing over the second half of 2014. The pace of sales, prices, foot traffic and inventory all point to steady progress into late summer. After an abysmal first quarter that drove a disappointing first half, housing will be playing catch-up for the year.
It’s true that the market looks stunted compared with last year’s high investor activity, double-digit price appreciation and near-record inventory lows. But there’s a big difference between 2013’s abnormal real estate market and the market now, which is beginning to look more balanced.
| Market Summary | June 2014 | Month-Over-Month Change | Year-Over-Year Change |
|---|---|---|---|
| Median sale price | $304,764 | +2.7% | +6.4% |
| Homes for sale | 504,293 | -0.9% | +8.1% |
| New listings | 167,915 | -6.2% | +7.0% |
| Days on market | 31 | +1 | -5 |
| Median sale price per square foot | $177 | +1.7% | +6.6% |
| Sold above list | 23.8% | -0.5% | -7.7% |
| Total homes sold | 114,240 | +3.8% | -2.5% |
Though it won’t be a seamless transition, we believe the housing market is positioning itself for a stronger finish in the second half of the year. Here are four reasons.
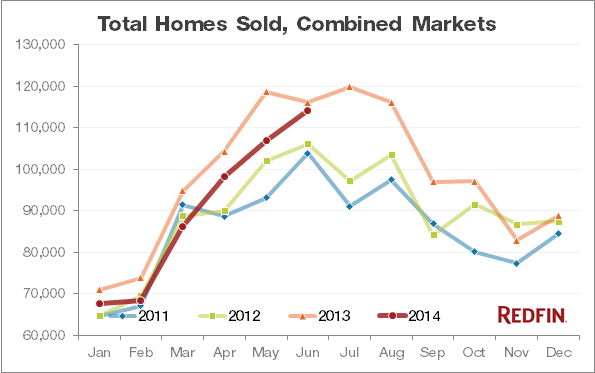
1. Sales are catching up to 2013’s highs.
Last year was the strongest year for home sales since the recession. June 2014 came close to the high bar set last year, at 114,240 home sales for the month, down only 2.5 percent year over year. And sales were up year over year in eight out of 30 metro markets, including Atlanta (8.2%), Charlotte (8.3%), Seattle (2.3%) and Oakland (8.6%).
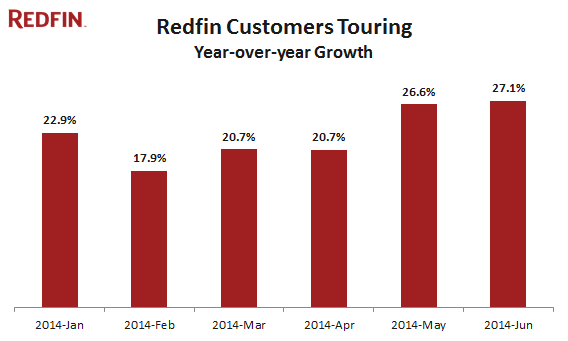
2. The inside track: Foot traffic is up.
Our latest numbers on home tours and offers indicate that housing demand in Redfin markets is increasing. Redfin data shows that the number of customers going on tours with Redfin agents in June was up 27.1 percent from a year ago. Tour growth, which tends to peak in May, is bucking seasonality trends. This indicator of buyer demand continues to strengthen as we head into the second half of the year. The key question is whether mortgage supply from banks can meet the increase in demand or whether buyers with large amounts of cash on hand will continue to dominate the market.
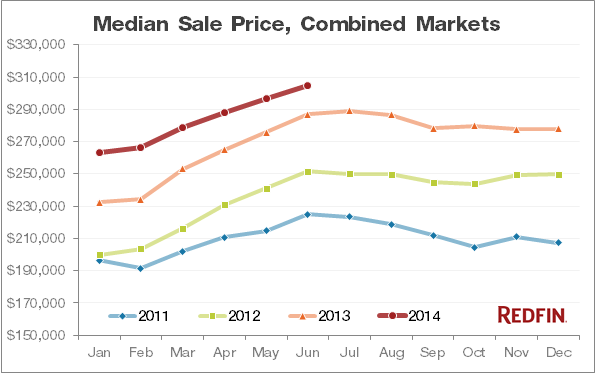
3. Price growth is becoming more sustainable.
Even as the median sales price in June topped $300,000 in urban markets, price growth reached a two-year low of 6.4 percent. Prices over the past three years have been an expensive roller coaster for both buyers and sellers, depreciating in 2011 and jumping by double digits by the end of 2012. Price growth through 2013 averaged 14 percent. In June, the median sales price grew at half that rate, much more in line with a sustainable rate that won’t have the market panting to keep up.
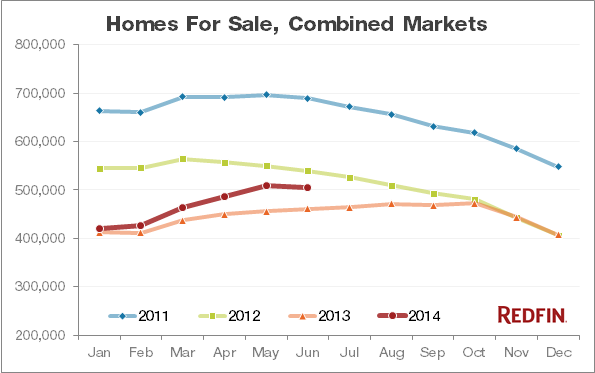
4. Housing inventory is returning, albeit slowly.
Between 2009 and 2012, the number of homes for sale plunged 44 percent, reaching its nadir of 411,555 homes at the end of 2012. At its highpoint in 2013, inventory rose to just 477,000 homes for sale and then dropped to 411,761 by year end. In June, for a second month in a row, the number of homes for sale was above 500,000 — up 8 percent from this time last year. In 22 of 30 markets, there were more homes for sale than last year. The biggest year-over-year increases in homes for sale were in Riverside-San Bernardino, California (28.1%), Phoenix (25.2%) and Orange County, California (24.6%).
Though the main long-term drivers of housing activity remain stalled — namely below average growth in median household income, labor force participation, bank lending and household formation — metro markets continue to get a boost from pent-up demand caused by the low inventory that plagued housing for the past two years.
The second half will not be without its wobbles. The housing market will have to jockey between poor economic indicators and pent-up buyer demand. But the housing market can maneuver around the juggernaut of subpar long-term economic fundamentals, based on the very real difference between this year and any other year post-crisis: Housing is now edging back to normal.
Median Sale Price By Metro
| Metro Area | Median sale price | Month-Over- Month Change |
Year-Over- Year Change |
|---|---|---|---|
| Atlanta, GA | $186,000 | +3.3% |
+15.5%
|
| Austin, TX | $254,000 | +2.4% |
+9.5%
|
| Baltimore, MD | $269,900 | +6.9% |
+3.8%
|
| Boston, MA | $445,000 | +6.3% |
+6.0%
|
| Charlotte, NC | $200,000 | +4.4% |
+5.8%
|
| Chicago, IL | $220,000 | +6.3% |
+7.3%
|
| Denver, CO | $283,825 | +2.5% |
+8.7%
|
| Fort Lauderdale, FL | $185,000 | +0.5% |
+14.7%
|
| Las Vegas, NV | $183,000 | +1.7% |
+12.9%
|
| Long Island, NY | $380,000 | +7.9% |
+0.0%
|
| Los Angeles, CA | $475,000 | +0.0% |
+5.6%
|
| Miami, FL | $220,000 | -2.2% |
+6.3%
|
| Minneapolis-Saint Paul, MN | $220,000 | +3.5% |
+4.8%
|
| Oakland, CA | $550,250 | -2.6% |
+3.8%
|
| Orange County, CA | $575,000 | +0.1% |
+8.0%
|
| Philadelphia, PA | $254,700 | +9.8% |
+1.1%
|
| Phoenix, AZ | $199,000 | +2.1% |
+7.6%
|
| Portland, OR | $280,000 | +0.0% |
+7.7%
|
| Raleigh-Durham, NC | $223,000 | -0.9% |
+4.7%
|
| Riverside-San Bernardino, CA | $287,088 | +1.8% |
+14.4%
|
| Sacramento, CA | $300,000 | +0.0% |
+9.9%
|
| San Diego, CA | $461,000 | +4.6% |
+10.3%
|
| San Francisco, CA | $925,000 | +1.6% |
+12.8%
|
| San Jose, CA | $770,000 | +2.9% |
+10.8%
|
| Seattle, WA | $385,242 | +5.5% |
+10.1%
|
| Tacoma, WA | $232,000 | -1.3% |
+6.9%
|
| Tampa, FL | $154,980 | +3.3% |
+3.3%
|
| Washington, DC | $389,500 | +2.5% |
-0.1%
|
| West Palm Beach, FL | $227,000 | +10.7% |
+20.3%
|
| Combined Markets | $304,764 | +2.7% |
+6.4%
|
Number of Homes Sold
| Metro Area | Homes Sold | Month-Over- Month Change |
Year-Over- Year Change |
|---|---|---|---|
| Atlanta, GA | 6,434 | -0.9% |
+8.2%
|
| Austin, TX | 2,906 | +0.1% |
+3.2%
|
| Baltimore, MD | 3,206 | +11.2% |
-2.4%
|
| Boston, MA | 3,590 | +30.1% |
-4.5%
|
| Charlotte, NC | 2,807 | +6.9% |
+8.3%
|
| Chicago, IL | 11,277 | +13.8% |
-0.7%
|
| Denver, CO | 5,479 | +6.1% |
+2.3%
|
| Fort Lauderdale, FL | 2,785 | -2.1% |
-1.3%
|
| Las Vegas, NV | 3,226 | -4.2% |
-10.2%
|
| Long Island, NY | 2,020 | +21.5% |
-2.9%
|
| Los Angeles, CA | 5,728 | -0.9% |
-7.1%
|
| Miami, FL | 2,903 | -1.5% |
-5.0%
|
| Minneapolis-Saint Paul, MN | 5,331 | +12.9% |
-1.0%
|
| Oakland, CA | 2,503 | -1.6% |
+8.6%
|
| Orange County, CA | 2,723 | +0.8% |
-6.3%
|
| Philadelphia, PA | 4,341 | +18.7% |
-4.0%
|
| Phoenix, AZ | 7,080 | -2.3% |
-9.1%
|
| Portland, OR | 3,236 | +2.2% |
-1.3%
|
| Raleigh-Durham, NC | 2,843 | -1.4% |
+3.2%
|
| Riverside-San Bernardino, CA | 4,585 | -0.5% |
-2.5%
|
| Sacramento, CA | 2,586 | -2.7% |
-8.6%
|
| San Diego, CA | 2,957 | -5.6% |
-14.8%
|
| San Francisco, CA | 1,414 | -1.9% |
-6.7%
|
| San Jose, CA | 1,508 | -4.6% |
-3.5%
|
| Seattle, WA | 4,180 | +7.3% |
+2.0%
|
| Tacoma, WA | 1,046 | -3.1% |
-4.4%
|
| Tampa, FL | 4,515 | -0.3% |
+4.2%
|
| Washington, DC | 7,680 | +8.5% |
-7.4%
|
| West Palm Beach, FL | 2,619 | -15.1% |
-5.0%
|
| Combined Markets | 114,240 | +3.8% |
-2.5%
|
Number of Homes for Sale
| Metro Area | Homes for sale | Month-Over- Month Change |
Year-Over- Year Change |
|---|---|---|---|
| Atlanta, GA | 48,539 | -1.0% |
+2.5%
|
| Austin, TX | 8,881 | +2.1% |
-5.7%
|
| Baltimore, MD | 18,335 | +1.2% |
+11.2%
|
| Boston, MA | 11,231 | -5.4% |
+0.5%
|
| Chicago, IL | 52,661 | +0.2% |
-0.1%
|
| Denver, CO | 12,755 | +1.1% |
-16.2%
|
| Las Vegas, NV | 16,264 | -7.3% |
-16.7%
|
| Long Island, NY | 20,819 | +3.0% |
+0.7%
|
| Los Angeles, CA | 22,284 | +2.0% |
+13.7%
|
| Minneapolis-Saint Paul, MN | 21,538 | +4.1% |
+1.2%
|
| Oakland, CA | 6,452 | +0.7% |
+9.4%
|
| Orange County, CA | 10,817 | +2.5% |
+24.6%
|
| Philadelphia, PA | 28,481 | +0.9% |
+1.6%
|
| Phoenix, AZ | 30,810 | -7.9% |
+25.2%
|
| Portland, OR | 12,805 | +2.8% |
-3.3%
|
| Raleigh-Durham, NC | 13,929 | -5.2% |
-5.9%
|
| Riverside-San Bernardino, CA | 21,066 | -1.5% |
+28.1%
|
| Sacramento, CA | 10,519 | +4.3% |
+20.8%
|
| San Diego, CA | 11,820 | +2.4% |
+13.9%
|
| San Francisco, CA | 3,489 | -2.0% |
-8.8%
|
| San Jose, CA | 3,520 | -1.6% |
-4.2%
|
| Seattle, WA | 12,864 | +0.9% |
+0.1%
|
| Tacoma, WA | 5,038 | -1.1% |
+0.3%
|
| Tampa, FL | 28,772 | -8.3% |
-7.5%
|
| Washington, DC | 29,748 | +1.2% |
+15.8%
|
| West Palm Beach, FL | 16,052 | -4.4% |
+2.4%
|
| Combined Markets | 504,293 | -0.9% |
+8.1%
|
Homes Newly Listed for Sale
| Metro Area | New listings | Month-Over- Month Change |
Year-Over- Year Change |
|---|---|---|---|
| Atlanta, GA | 12,504 | -0.8% |
+16.1%
|
| Austin, TX | 3,704 | -8.8% |
-1.8%
|
| Baltimore, MD | 5,249 | -8.2% |
+19.2%
|
| Boston, MA | 4,283 | -13.7% |
+7.3%
|
| Charlotte, NC | 3,798 | -7.8% |
+3.2%
|
| Chicago, IL | 18,466 | -3.0% |
+14.2%
|
| Denver, CO | 6,501 | -5.7% |
-3.9%
|
| Fort Lauderdale, FL | 4,392 | -5.4% |
+19.0%
|
| Las Vegas, NV | 4,402 | -2.7% |
-1.7%
|
| Long Island, NY | 4,355 | -8.3% |
+8.1%
|
| Los Angeles, CA | 8,746 | -0.4% |
+3.0%
|
| Miami, FL | 5,024 | -4.3% |
+14.5%
|
| Minneapolis-Saint Paul, MN | 7,949 | -2.9% |
+9.5%
|
| Oakland, CA | 3,298 | -4.4% |
+0.7%
|
| Orange County, CA | 3,925 | -4.1% |
-2.0%
|
| Philadelphia, PA | 6,513 | -12.6% |
+13.1%
|
| Phoenix, AZ | 8,353 | -11.0% |
-7.6%
|
| Portland, OR | 5,043 | -3.9% |
+7.9%
|
| Raleigh-Durham, NC | 3,471 | -12.3% |
+2.8%
|
| Riverside-San Bernardino, CA | 6,671 | -3.0% |
+9.2%
|
| Sacramento, CA | 4,139 | -3.7% |
+10.2%
|
| San Diego, CA | 4,717 | -2.8% |
-0.1%
|
| San Francisco, CA | 1,677 | -12.2% |
-5.9%
|
| San Jose, CA | 1,812 | -11.8% |
-8.9%
|
| Seattle, WA | 5,559 | -9.8% |
+0.9%
|
| Tacoma, WA | 1,611 | -9.3% |
+5.6%
|
| Tampa, FL | 5,793 | -6.0% |
+8.9%
|
| Washington, DC | 10,929 | -13.3% |
+11.6%
|
| West Palm Beach, FL | 3,990 | -2.5% |
+19.5%
|
| Combined Markets | 167,915 | -6.2% |
+7.0%
|
Full data for June 2014 may be downloaded in this spreadsheet.
If you’d like to stay up to date on all of Redfin’s reports, please subscribe to the RSS feed here or follow us on Facebook, Twitter or Google+.


