
The number of homes for sale shrank at its slowest pace in April since the start of the pandemic. Home sales fell and price growth slowed as soaring mortgage rates prompted more buyers to throw in the towel.
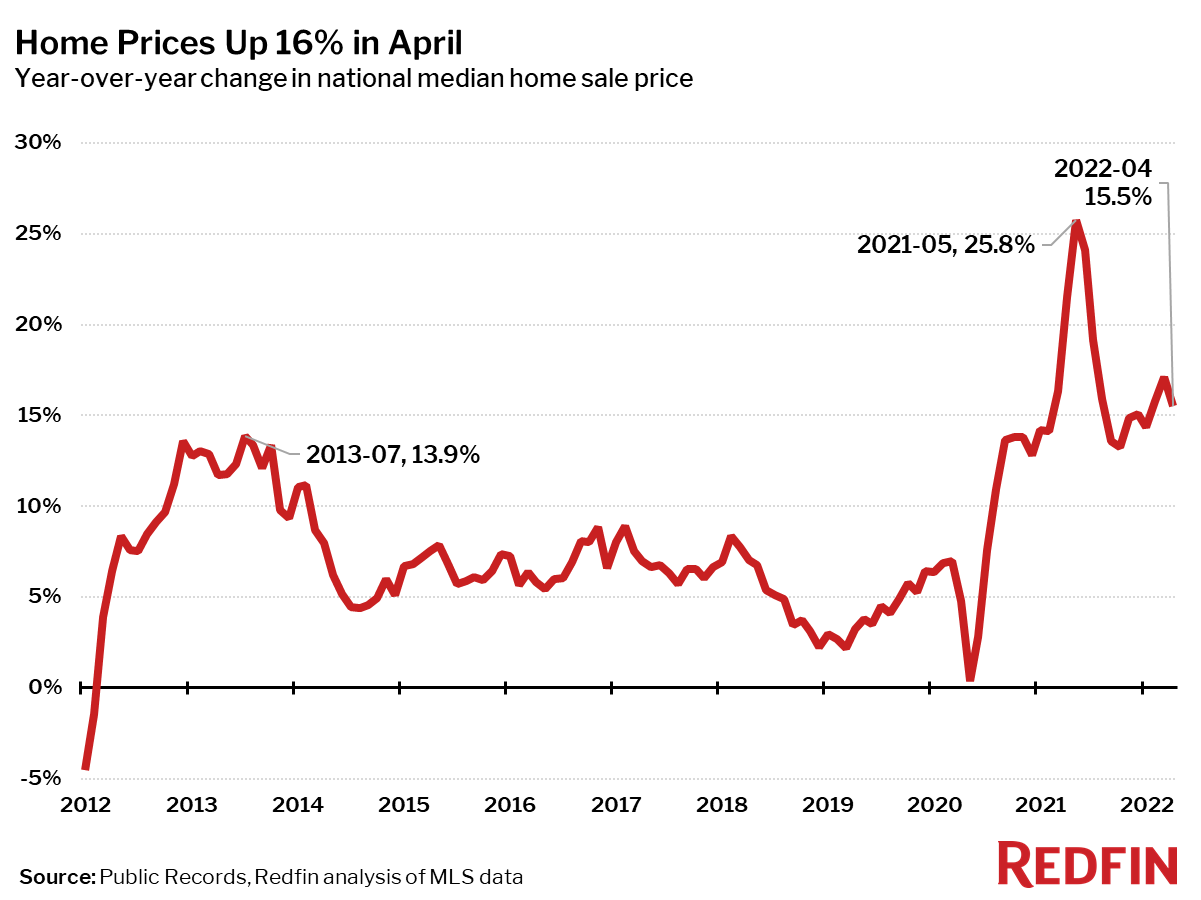
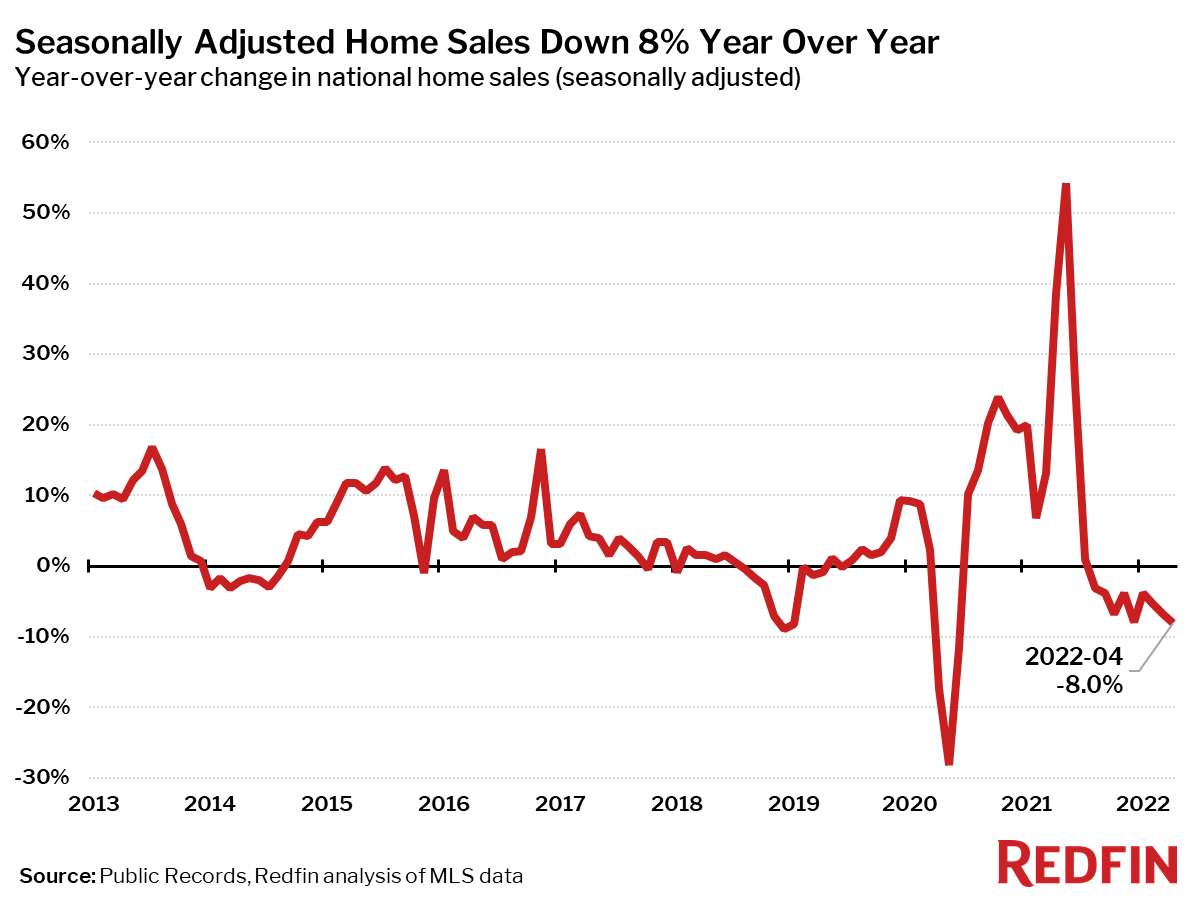
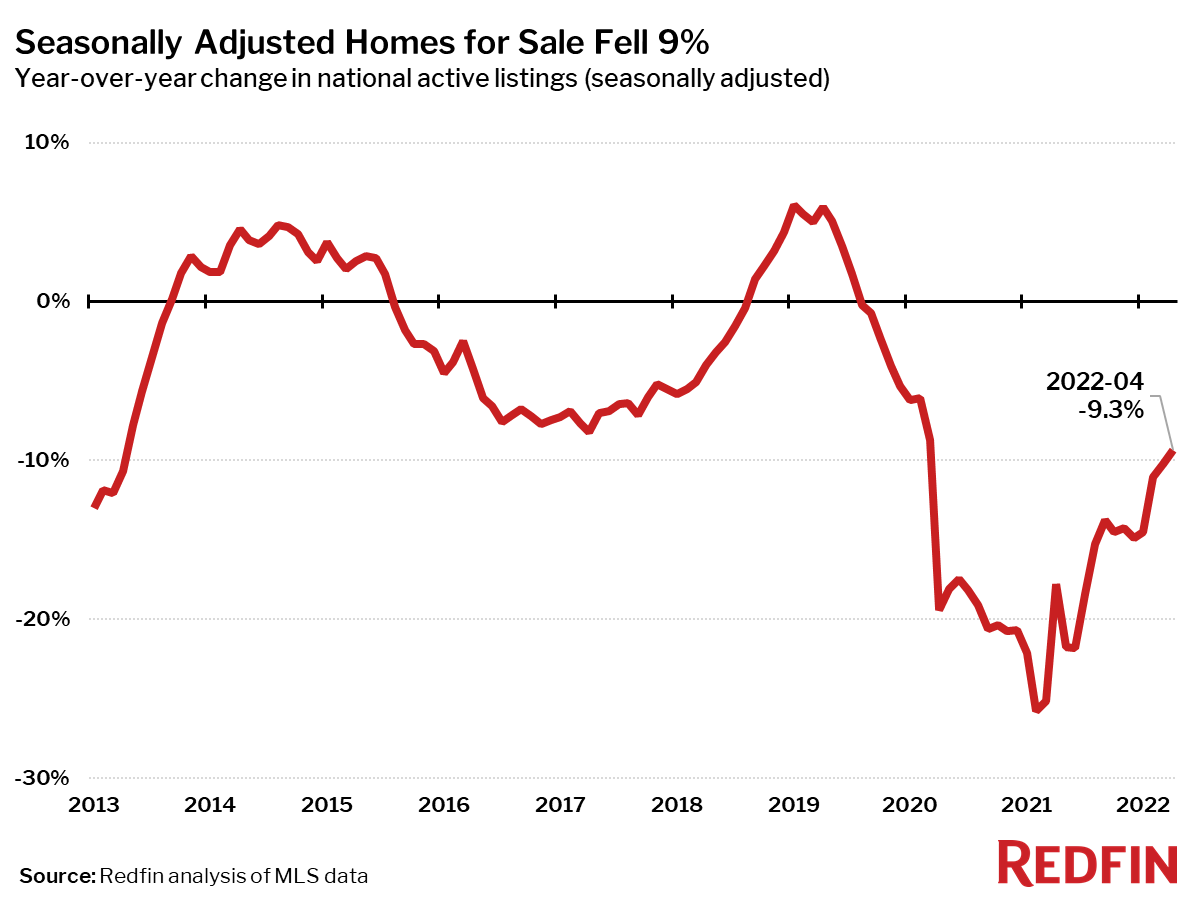
The housing market turned a corner in April as the inventory crunch showed signs of easing. The 9% year-over-year decline in homes for sale was the smallest since March 2020 and the first single-digit drop since the start of the pandemic. While inventory remained at a record low, it fell at a relatively slow pace because soaring mortgage rates tempered homebuyer demand. Home sales slid 8%, the biggest drop since June 2020, which allowed white-hot home-price growth to cool slightly. The median home-sale price rose 16% to $424,000, a slowdown from March’s 17% gain.
“When market conditions are changing it becomes more difficult for homebuyers and sellers to see eye-to-eye on pricing,” said Redfin deputy chief economist Taylor Marr. “Many sellers are still seeking sky-high prices for their homes even though rising mortgage rates have limited homebuyer budgets. As a result, buyers are backing off, which is causing home sales to fall and the housing shortage to ease. As demand continues to soften, more sellers will likely be forced to drop their prices in order to get offers. The good news is that this should finally bring more balance to the market.”
| Market Summary | April 2022 | Month-Over-Month | Year-Over-Year |
|---|---|---|---|
| Median sale price | $424,400 | 3.1% | 15.5% |
| Homes sold, seasonally-adjusted | 570,700 | -1.8% | -8.0% |
| Pending sales, seasonally-adjusted | 514,900 | -2.1% | -7.2% |
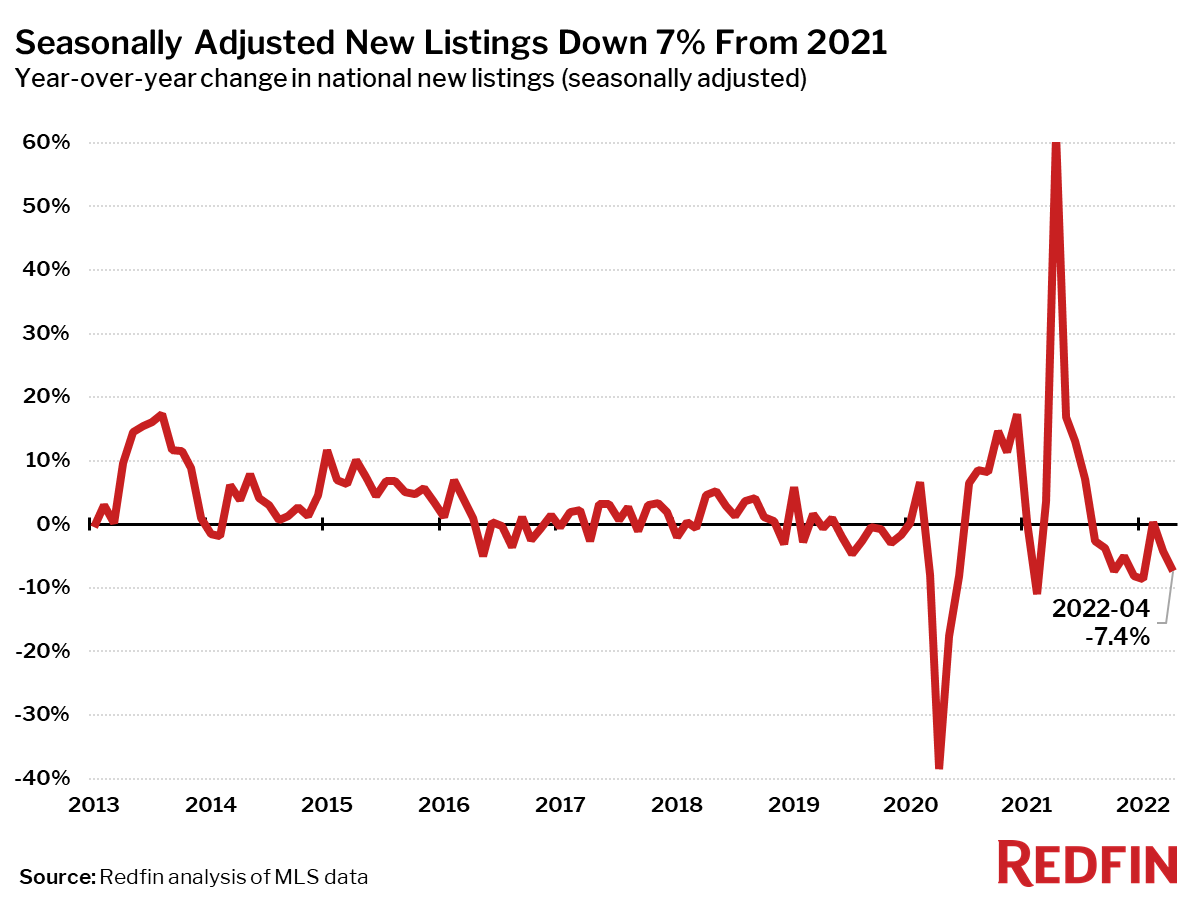
| New listings, seasonally-adjusted | 593,500 | 0.1% | -7.4% |
| All Homes for sale, seasonally-adjusted | 1,351,900 | -1.3% | -9.3% |
| Median days on market | 18 | -3 | -2 |
| Months of supply | 1.3 | 0.1 | 0 |
| Sold above list | 58.8% | 4.6 pts† | 9.9 pts† |
| Median Off-Market Redfin Estimate | $415,000 | 1.4% | 22.1% |
| Average Sale-to-list | 103.2% | 0.7 pts† | 1.6 pts† |
| Average 30-year fixed mortgage rate | 4.98% | +0.81 pts† | +1.92 pts† |
Median sale prices increased from a year earlier in all of the 88 largest metro areas Redfin tracks. The largest price increases were in Las Vegas (+29%), West Palm Beach, FL (+29%) and Fort Worth, TX (+28%).
Home sales fell from the prior year in 87 of the 88 largest metro areas Redfin tracks. The biggest declines were in West Palm Beach, FL (-30%), Anaheim, CA (-26%) and Bridgeport, CT (-25%). The only metro where sales increased was Allentown, PA (+1%).
78 of the 88 largest metros tracked by Redfin posted year-over-year decreases in the number of seasonally adjusted active listings of homes for sale. The biggest declines were in Allentown, PA (-50%), Greensboro, NC (-40%) and Bridgeport, CT (-35%). The metro areas with the largest increases were Elgin, IL (+33%), Chicago (+15%) and Detroit (+10%).
New listings fell from a year ago in 78 of the 88 largest metro areas. The largest declines were in Allentown, PA (-58%), Greensboro, NC (-45%) and Lake County, IL (-29%). New listings rose the most in McAllen, TX (+13%), Oklahoma City (+6%) and Detroit (+4%).
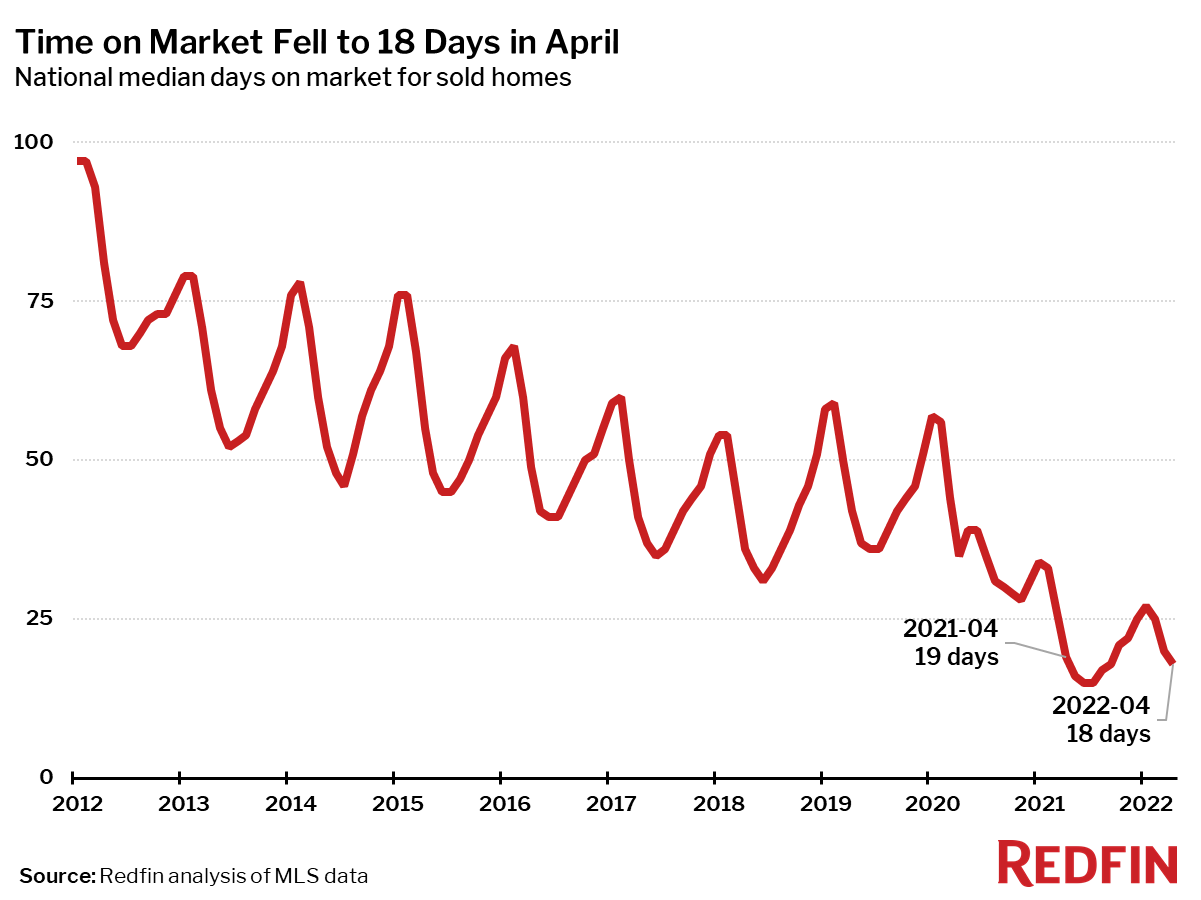
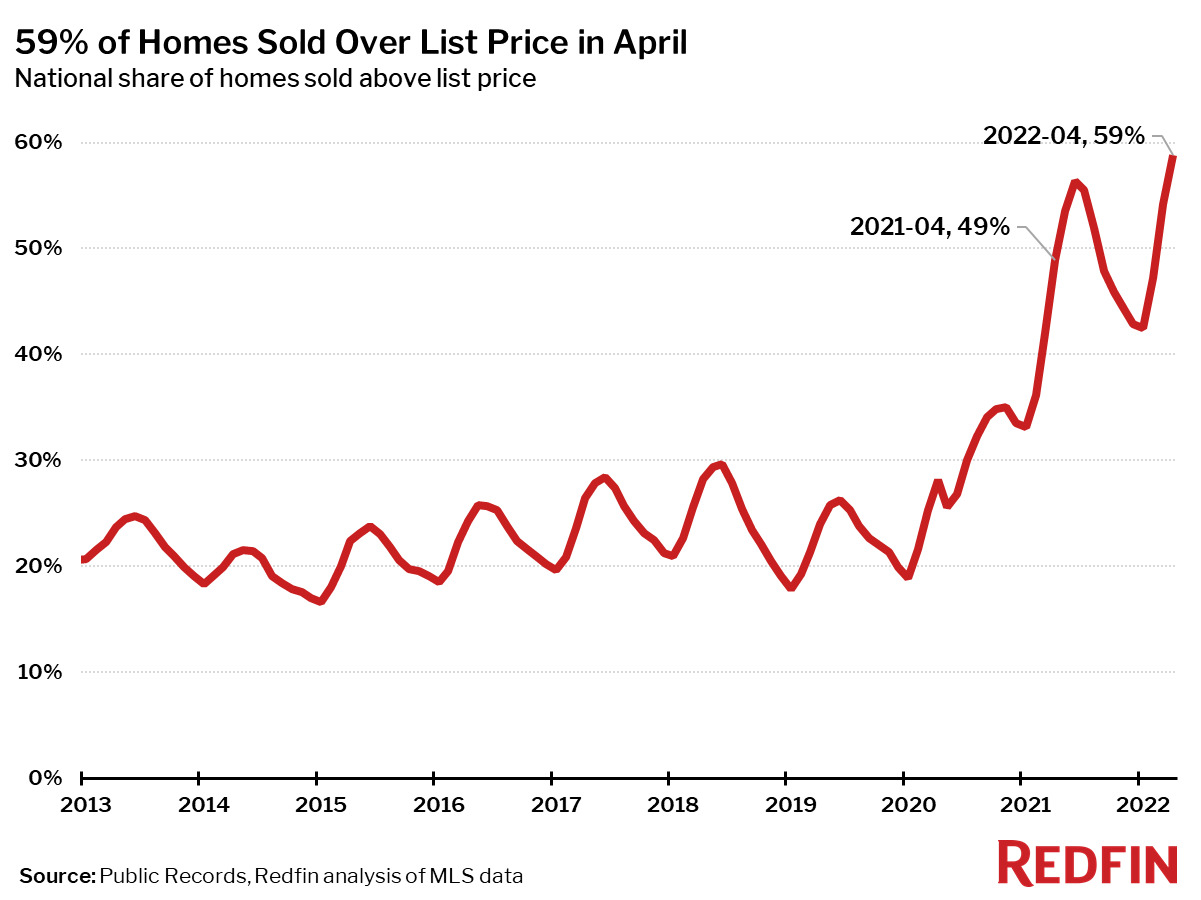
Home sales that closed in April (which mostly went under contract in March) spent less time on the market and sold for further above list price than a year ago.
The typical home that sold in April went under contract in 18 days—six days faster than a year earlier–and the shortest time on market ever for April.
Fifty-nine percent of homes sold above list price, up 10 percentage points from a year earlier, and the highest level on record in Redfin’s data, which goes back through 2013.
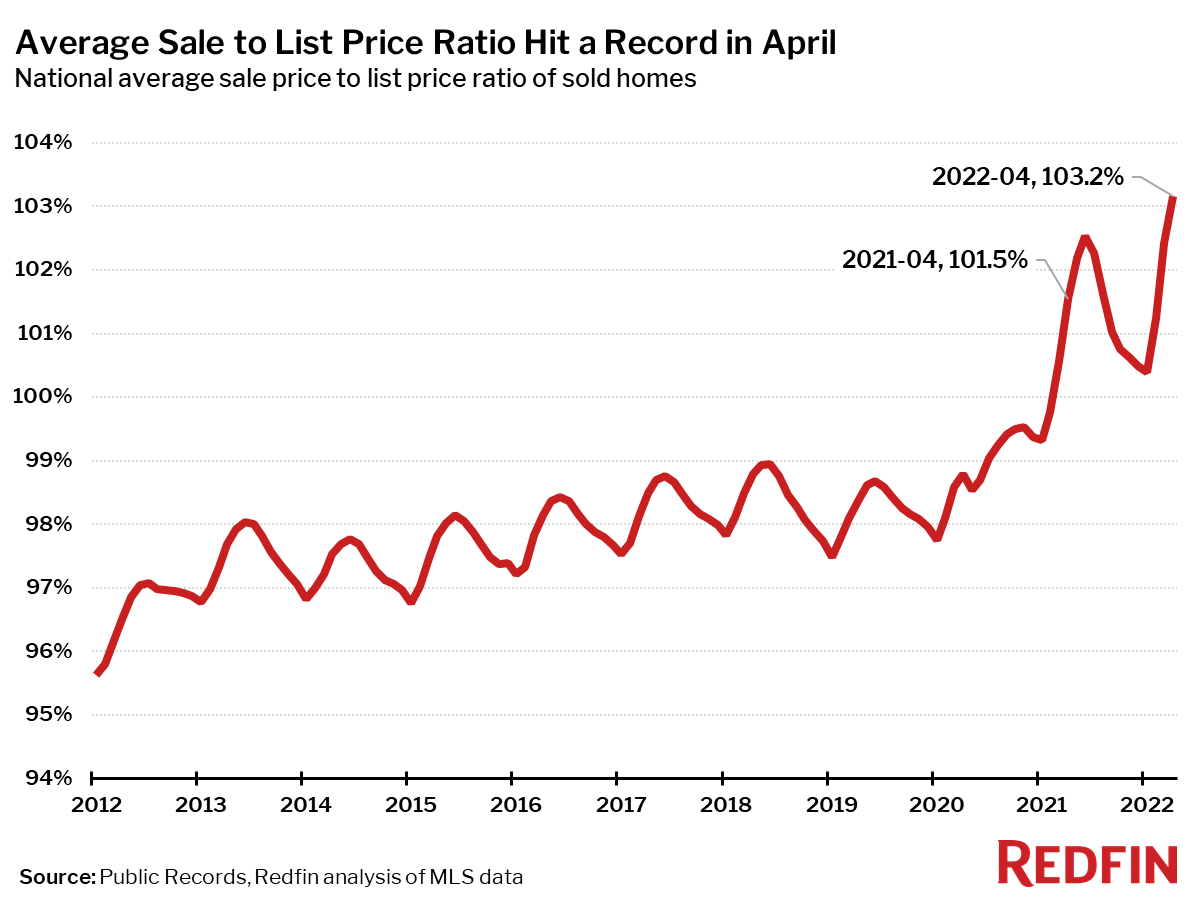
The average sale-to-list price ratio, which measures how close homes are selling to their asking prices, rose to a record 103.2% in April, up from 101.5% a year earlier. In other words, the average home sold for 3.2% above its asking price.
Other April Highlights
Competition
- Denver and Indianapolis were the fastest markets, with half of all homes pending sale in just 4 days. Next came Omaha, Oklahoma City and Portland, OR each with 5 days on market.
- The most competitive market in April was San Jose, CA where 88.5% of homes sold above list price, followed by 87.7% in Oakland, CA, 78.7% in Denver, 77.8% in San Francisco, and 75.6% in Oxnard, CA.
Prices
- Las Vegas had the nation’s highest price growth, rising 29% since last year to $445,000. West Palm Beach, FL had the second highest growth at 28.6% year-over-year price growth, followed by Fort Worth, TX (28.3%), Tampa, FL (27.6%), and Nashville, TN (26.9%).
- No metros saw price declines in April.
Sales
- Allentown, PA led the nation in year-over-year sales growth, up 1.2%, followed by Greensboro, NC, up -0.2%. Omaha, NE rounded out the top three with sales up -0.5% from a year ago.
- West Palm Beach, FL saw the largest decline in sales since last year, falling 29.8%. Home sales in Anaheim, CA and Bridgeport, CT declined by 25.7% and 24.9%, respectively.
Inventory
- Elgin, IL had the highest increase in the number of homes for sale, up 32.6% year over year, followed by Chicago (15.3%) and Detroit (9.9%).
- Allentown, PA had the largest decrease in overall active listings, falling 49.9% since last April. Greensboro, NC (-39.9%), Bridgeport, CT (-35.2%), and Fort Lauderdale, FL (-32.4%) also saw far fewer homes available on the market than a year ago.
Redfin Estimate
- Miami (39.3%) had the largest share of homes predicted to sell for below list price, according to Redfin Estimate data, followed by Baton Rouge, LA (32.5%) and Tulsa, OK (29.7%).
- Oakland, CA (94.8%) had the largest share of homes predicted to sell at or above list price, followed by Seattle (94.4%) and San Jose, CA (93.5%).
Below are market-by-market breakdowns for prices, inventory, new listings and sales for markets with populations of 750,000 or more. For downloadable data on all of the markets Redfin tracks, visit the Redfin Data Center. Refer to our metrics definition page for explanations of all the metrics used in this report.
Median Sale Price
| Redfin Metro | Median Sale Price | Month-Over-Month | Year-Over-Year |
|---|---|---|---|
| Albany, NY | $275,000 | 5.8% | 5.8% |
| Allentown, PA | $280,000 | -1.8% | 13.0% |
| Anaheim, CA | $1,075,000 | 3.4% | 19.6% |
| Atlanta, GA | $382,500 | 4.6% | 22.6% |
| Austin, TX | $555,000 | 5.7% | 19.3% |
| Bakersfield, CA | $365,000 | 4.3% | 21.7% |
| Baltimore, MD | $352,500 | 5.2% | 7.5% |
| Baton Rouge, LA | $262,800 | 3.5% | 9.5% |
| Birmingham, AL | $284,000 | 4.1% | 12.5% |
| Boston, MA | $675,000 | 5.7% | 12.3% |
| Bridgeport, CT | $522,000 | 4.4% | 8.5% |
| Buffalo, NY | $208,500 | 8.3% | 15.5% |
| Camden, NJ | $286,500 | 6.1% | 14.6% |
| Charleston, SC | $404,800 | 2.5% | 16.3% |
| Charlotte, NC | $391,500 | 3.6% | 22.0% |
| Chicago, IL | $329,000 | 6.1% | 5.4% |
| Cincinnati, OH | $250,000 | 0.4% | 6.8% |
| Cleveland, OH | $191,000 | 0.5% | 9.1% |
| Columbus, OH | $310,000 | 6.9% | 17.0% |
| Dallas, TX | $447,000 | 6.4% | 24.2% |
| Dayton, OH | $200,000 | 13.0% | 12.4% |
| Denver, CO | $615,000 | 2.5% | 17.4% |
| Detroit, MI | $175,000 | 6.1% | 0.0% |
| El Paso, TX | $235,000 | 4.4% | 22.4% |
| Elgin, IL | $305,000 | 6.3% | 8.9% |
| Fort Lauderdale, FL | $375,000 | 1.4% | 14.7% |
| Fort Worth, TX | $376,000 | 6.8% | 28.3% |
| Frederick, MD | $540,000 | 4.9% | 10.7% |
| Fresno, CA | $407,000 | 1.8% | 19.5% |
| Grand Rapids, MI | $308,000 | 6.2% | 14.5% |
| Greensboro, NC | $252,000 | 2.9% | 17.2% |
| Greenville, SC | $300,000 | 0.0% | 20.0% |
| Hartford, CT | $288,500 | 6.9% | 7.2% |
| Houston, TX | $340,000 | 3.0% | 15.7% |
| Indianapolis, IN | $270,000 | 3.8% | 13.9% |
| Jacksonville, FL | $356,800 | 2.4% | 22.7% |
| Kansas City, MO | $300,000 | 3.1% | 11.2% |
| Knoxville, TN | $335,000 | 4.7% | 26.4% |
| Lake County, IL | $320,000 | 10.3% | 3.0% |
| Las Vegas, NV | $445,000 | 3.5% | 29.0% |
| Los Angeles, CA | $900,000 | 2.9% | 13.2% |
| Louisville, KY | $250,000 | 6.4% | 13.0% |
| McAllen, TX | $220,000 | 5.3% | 22.2% |
| Memphis, TN | $279,900 | 1.0% | 15.2% |
| Miami, FL | $475,000 | 2.2% | 16.4% |
| Milwaukee, WI | $280,000 | 9.4% | 9.6% |
| Minneapolis, MN | $373,800 | 5.3% | 10.0% |
| Montgomery County, PA | $410,000 | 2.5% | 9.3% |
| Nashville, TN | $454,500 | 5.9% | 26.9% |
| Nassau County, NY | $599,000 | 0.7% | 7.9% |
| New Brunswick, NJ | $450,000 | 5.9% | 12.5% |
| New Haven, CT | $295,000 | 5.4% | 14.8% |
| New Orleans, LA | $290,000 | 3.9% | 7.4% |
| New York, NY | $680,000 | 0.7% | 5.4% |
| Newark, NJ | $481,000 | 2.7% | 7.1% |
| North Port, FL | $450,000 | 1.1% | 26.8% |
| Oakland, CA | $1,085,000 | 10.7% | 14.2% |
| Oklahoma City, OK | $246,000 | 1.7% | 14.4% |
| Omaha, NE | $286,000 | 3.3% | 14.4% |
| Orlando, FL | $390,000 | 3.5% | 25.8% |
| Oxnard, CA | $875,000 | 6.7% | 12.2% |
| Philadelphia, PA | $275,000 | 3.8% | 3.8% |
| Phoenix, AZ | $480,000 | 2.1% | 25.4% |
| Pittsburgh, PA | $214,600 | 0.8% | 7.0% |
| Portland, OR | $556,000 | 1.1% | 13.5% |
| Providence, RI | $405,000 | 5.2% | 15.7% |
| Raleigh, NC | $439,400 | 5.0% | 25.5% |
| Richmond, VA | $350,000 | 2.9% | 12.9% |
| Riverside, CA | $572,500 | 2.2% | 20.5% |
| Rochester, NY | $200,000 | 8.1% | 11.9% |
| Sacramento, CA | $604,500 | -0.2% | 14.1% |
| Salt Lake City, UT | $550,500 | 2.0% | 25.1% |
| San Antonio, TX | $330,000 | 3.1% | 20.0% |
| San Diego, CA | $865,000 | 3.0% | 20.5% |
| San Francisco, CA | $1,670,000 | 6.0% | 11.0% |
| San Jose, CA | $1,600,000 | 3.2% | 18.5% |
| Seattle, WA | $850,000 | 3.7% | 18.7% |
| St. Louis, MO | $233,000 | 3.6% | 8.4% |
| Tacoma, WA | $568,000 | 3.1% | 15.9% |
| Tampa, FL | $370,000 | 2.2% | 27.6% |
| Tucson, AZ | $353,500 | 4.0% | 21.9% |
| Tulsa, OK | $245,000 | 4.3% | 12.8% |
| Honolulu, HI | $710,000 | 2.2% | 12.7% |
| Virginia Beach, VA | $315,000 | 5.0% | 11.4% |
| Warren, MI | $280,000 | 6.5% | 7.7% |
| Washington, DC | $550,000 | 4.8% | 8.9% |
| West Palm Beach, FL | $450,000 | 9.5% | 28.6% |
| Worcester, MA | $385,000 | 6.9% | 13.1% |
| National | $424,400 | 3.1% | 15.5% |
Homes Sold
| Redfin Metro | Homes Sold | Month-Over-Month | Year-Over-Year |
|---|---|---|---|
| Albany, NY | 673 | -13.5% | -18.1% |
| Allentown, PA | 782 | 7.3% | 1.2% |
| Anaheim, CA | 2,563 | -4.2% | -25.7% |
| Atlanta, GA | 9,206 | -8.6% | -13.0% |
| Austin, TX | 3,094 | -4.1% | -12.6% |
| Bakersfield, CA | 864 | -0.9% | -4.4% |
| Baltimore, MD | 3,978 | 3.3% | -8.7% |
| Baton Rouge, LA | 1,086 | -3.1% | -8.6% |
| Birmingham, AL | 1,577 | -1.3% | -13.0% |
| Boston, MA | 3,391 | 7.9% | -20.0% |
| Bridgeport, CT | 996 | -1.9% | -24.9% |
| Buffalo, NY | 644 | -17.1% | -19.2% |
| Camden, NJ | 1,512 | 1.4% | -11.4% |
| Charleston, SC | 1,672 | -6.6% | -16.5% |
| Charlotte, NC | 4,150 | -6.0% | -5.9% |
| Chicago, IL | 9,407 | 7.9% | -10.2% |
| Cincinnati, OH | 2,593 | 3.0% | -7.7% |
| Cleveland, OH | 2,427 | 7.7% | -4.1% |
| Columbus, OH | 2,631 | 11.4% | -4.6% |
| Dallas, TX | 5,703 | -0.7% | -11.3% |
| Dayton, OH | 945 | 1.4% | -10.3% |
| Denver, CO | 5,073 | 8.6% | -5.2% |
| Detroit, MI | 1,795 | 4.6% | -1.2% |
| El Paso, TX | 831 | -5.2% | -7.4% |
| Elgin, IL | 925 | 0.2% | -16.8% |
| Fort Lauderdale, FL | 3,615 | -7.3% | -16.8% |
| Fort Worth, TX | 2,793 | -2.6% | -12.1% |
| Frederick, MD | 1,686 | 14.5% | -14.3% |
| Fresno, CA | 790 | -3.1% | -5.2% |
| Grand Rapids, MI | 1,075 | 8.0% | -15.0% |
| Greensboro, NC | 951 | 1.3% | -0.2% |
| Greenville, SC | 1,249 | -7.1% | -7.8% |
| Hartford, CT | 1,251 | 6.4% | -14.8% |
| Houston, TX | 9,303 | -8.0% | -6.6% |
| Indianapolis, IN | 2,984 | 6.1% | -4.7% |
| Jacksonville, FL | 2,889 | -8.2% | -14.7% |
| Kansas City, MO | 3,024 | 7.7% | -7.8% |
| Knoxville, TN | 1,193 | 3.6% | -11.3% |
| Lake County, IL | 1,271 | 28.1% | -8.0% |
| Las Vegas, NV | 3,918 | -8.5% | -15.6% |
| Los Angeles, CA | 6,326 | -3.3% | -14.6% |
| Louisville, KY | 1,642 | 0.2% | -6.0% |
| McAllen, TX | 393 | -16.6% | -3.7% |
| Memphis, TN | 1,403 | -6.0% | -4.7% |
| Miami, FL | 3,599 | -14.1% | -16.6% |
| Milwaukee, WI | 1,701 | 1.4% | -11.7% |
| Minneapolis, MN | 4,864 | 18.1% | -7.4% |
| Montgomery County, PA | 2,083 | 9.7% | -7.0% |
| Nashville, TN | 3,547 | -1.1% | -7.8% |
| Nassau County, NY | 2,121 | -11.6% | -19.7% |
| New Brunswick, NJ | 2,625 | -2.8% | -17.4% |
| New Haven, CT | 855 | -4.8% | -18.0% |
| New Orleans, LA | 1,490 | 4.1% | -13.7% |
| New York, NY | 5,789 | -11.9% | -9.7% |
| Newark, NJ | 1,894 | 3.4% | -13.0% |
| North Port, FL | 2,350 | -2.2% | -22.8% |
| Oakland, CA | 2,736 | -2.3% | -17.6% |
| Oklahoma City, OK | 2,155 | 3.8% | -5.0% |
| Omaha, NE | 1,133 | 15.1% | -0.5% |
| Orlando, FL | 4,385 | -9.5% | -15.4% |
| Oxnard, CA | 747 | -8.2% | -19.4% |
| Philadelphia, PA | 2,314 | -6.1% | -7.7% |
| Phoenix, AZ | 8,703 | -9.3% | -9.2% |
| Pittsburgh, PA | 2,218 | 2.6% | -7.4% |
| Portland, OR | 3,612 | 1.6% | -7.5% |
| Providence, RI | 1,495 | 2.0% | -14.5% |
| Raleigh, NC | 2,338 | 1.5% | -8.9% |
| Richmond, VA | 1,764 | 2.4% | -9.1% |
| Riverside, CA | 5,537 | -7.7% | -8.8% |
| Rochester, NY | 771 | 2.5% | -11.2% |
| Sacramento, CA | 2,808 | 3.0% | -7.6% |
| Salt Lake City, UT | 1,368 | 3.0% | -16.1% |
| San Antonio, TX | 2,817 | -11.9% | -18.4% |
| San Diego, CA | 2,947 | -3.0% | -17.6% |
| San Francisco, CA | 1,245 | -2.4% | -15.9% |
| San Jose, CA | 1,709 | 7.4% | -16.4% |
| Seattle, WA | 4,558 | 2.9% | -9.5% |
| St. Louis, MO | 3,477 | 8.3% | -8.3% |
| Tacoma, WA | 1,485 | 7.3% | -7.5% |
| Tampa, FL | 6,052 | -9.9% | -14.9% |
| Tucson, AZ | 1,681 | -9.4% | -7.2% |
| Tulsa, OK | 1,300 | -5.8% | -11.7% |
| Honolulu, HI | 1,012 | 2.7% | -1.0% |
| Virginia Beach, VA | 2,871 | -2.1% | -9.8% |
| Warren, MI | 3,160 | 3.8% | -8.2% |
| Washington, DC | 6,809 | 3.3% | -16.9% |
| West Palm Beach, FL | 3,061 | -10.9% | -29.8% |
| Worcester, MA | 768 | 1.5% | -11.5% |
| National | 570,700 | -1.8% | -8.0% |
New Listings
| Redfin Metro | New Listings | Month-Over-Month | Year-Over-Year |
|---|---|---|---|
| Albany, NY | 1,143 | 13.5% | -10.6% |
| Allentown, PA | 532 | -30.5% | -57.9% |
| Anaheim, CA | 3,002 | -1.1% | -16.3% |
| Atlanta, GA | 10,099 | -5.9% | -17.1% |
| Austin, TX | 4,488 | 10.2% | -1.7% |
| Bakersfield, CA | 1,067 | 3.8% | -0.8% |
| Baltimore, MD | 4,747 | -0.2% | -15.8% |
| Birmingham, AL | 1,619 | -4.1% | -19.9% |
| Boston, MA | 5,820 | 1.2% | -15.1% |
| Bridgeport, CT | 1,580 | 8.2% | -23.1% |
| Buffalo, NY | 1,192 | 10.2% | -4.2% |
| Camden, NJ | 2,033 | 1.5% | -13.7% |
| Charleston, SC | 1,874 | -2.0% | -12.3% |
| Charlotte, NC | 4,475 | 14.4% | -11.2% |
| Chicago, IL | 11,754 | -1.3% | -20.0% |
| Cincinnati, OH | 3,281 | 3.5% | -6.5% |
| Cleveland, OH | 3,255 | 9.9% | -4.0% |
| Columbus, OH | 3,320 | 9.3% | -4.1% |
| Dallas, TX | 7,660 | 9.9% | -1.9% |
| Dayton, OH | 1,366 | 10.6% | 0.8% |
| Denver, CO | 6,617 | 13.7% | 3.5% |
| Detroit, MI | 2,446 | 4.8% | 3.8% |
| El Paso, TX | 926 | -8.6% | -12.0% |
| Elgin, IL | 1,260 | 11.6% | -15.4% |
| Fort Lauderdale, FL | 3,444 | -11.3% | -19.0% |
| Fort Worth, TX | 3,623 | 6.0% | -0.7% |
| Frederick, MD | 1,960 | 0.5% | -21.3% |
| Fresno, CA | 867 | -11.0% | -13.0% |
| Grand Rapids, MI | 1,403 | 2.4% | -5.0% |
| Greensboro, NC | 650 | -24.7% | -44.7% |
| Greenville, SC | 1,418 | 0.9% | -6.5% |
| Hartford, CT | 1,781 | 8.6% | -15.8% |
| Houston, TX | 11,903 | 5.7% | -1.5% |
| Indianapolis, IN | 3,823 | 7.2% | -6.0% |
| Jacksonville, FL | 3,331 | 4.1% | -16.9% |
| Kansas City, MO | 3,965 | 4.6% | -13.9% |
| Knoxville, TN | 1,187 | -12.9% | -18.9% |
| Lake County, IL | 1,444 | -1.2% | -28.9% |
| Las Vegas, NV | 4,667 | 2.3% | -3.7% |
| Los Angeles, CA | 7,149 | -5.8% | -13.8% |
| Louisville, KY | 1,969 | -1.7% | -5.4% |
| McAllen, TX | 591 | -6.8% | 12.6% |
| Memphis, TN | 1,788 | 2.5% | -4.5% |
| Miami, FL | 3,913 | -8.2% | -9.8% |
| Milwaukee, WI | 2,184 | 14.3% | -15.4% |
| Minneapolis, MN | 6,693 | 9.3% | -7.5% |
| Montgomery County, PA | 2,780 | 8.4% | -17.0% |
| Nashville, TN | 3,873 | 3.0% | 1.9% |
| Nassau County, NY | 3,366 | -6.7% | -17.6% |
| New Brunswick, NJ | 3,966 | 1.4% | -10.8% |
| New Haven, CT | 1,295 | 4.9% | -11.2% |
| New Orleans, LA | 1,885 | -3.0% | -1.2% |
| New York, NY | 10,039 | -7.9% | -12.5% |
| Newark, NJ | 2,758 | 0.7% | -17.8% |
| North Port, FL | 2,785 | -2.9% | 1.4% |
| Oakland, CA | 3,387 | -2.1% | -9.2% |
| Oklahoma City, OK | 2,723 | 9.0% | 5.7% |
| Omaha, NE | 1,414 | 7.7% | -14.4% |
| Orlando, FL | 4,817 | -8.2% | -8.2% |
| Oxnard, CA | 870 | -4.0% | -10.7% |
| Philadelphia, PA | 3,180 | -2.5% | -11.7% |
| Phoenix, AZ | 9,610 | -1.2% | -7.5% |
| Pittsburgh, PA | 2,978 | 3.5% | -10.6% |
| Portland, OR | 4,215 | 1.0% | -12.5% |
| Providence, RI | 2,133 | 3.5% | -11.5% |
| Raleigh, NC | 2,743 | 6.3% | -4.4% |
| Richmond, VA | 2,067 | 1.2% | -16.9% |
| Riverside, CA | 6,599 | 0.8% | -1.8% |
| Rochester, NY | 1,265 | 2.5% | -11.8% |
| Sacramento, CA | 3,467 | 3.0% | -3.9% |
| San Antonio, TX | 3,895 | 10.3% | 0.6% |
| San Diego, CA | 3,401 | 0.1% | -11.8% |
| San Francisco, CA | 1,383 | -8.8% | -12.5% |
| San Jose, CA | 1,940 | -4.8% | -8.9% |
| Seattle, WA | 5,688 | -0.6% | -9.6% |
| St. Louis, MO | 4,111 | 13.2% | -13.3% |
| Tacoma, WA | 1,762 | -1.5% | -5.6% |
| Tampa, FL | 6,986 | 0.2% | -4.0% |
| Tucson, AZ | 1,819 | 2.1% | -5.7% |
| Tulsa, OK | 1,654 | 7.2% | -6.7% |
| Honolulu, HI | 871 | -11.8% | -23.9% |
| Virginia Beach, VA | 3,589 | 4.3% | -6.6% |
| Warren, MI | 4,237 | 7.6% | -6.7% |
| Washington, DC | 8,366 | 0.4% | -20.2% |
| West Palm Beach, FL | 3,745 | -5.1% | -8.7% |
| Worcester, MA | 1,325 | 16.0% | -8.0% |
| National | 593,500 | 0.1% | -7.4% |
All Homes for Sale
| Redfin Metro | All Homes for Sale | Month-Over-Month | Year-Over-Year |
|---|---|---|---|
| Albany, NY | 2,222 | 3.3% | -19.3% |
| Allentown, PA | 1,163 | -18.9% | -49.9% |
| Anaheim, CA | 5,737 | 0.4% | -28.4% |
| Atlanta, GA | 19,474 | -2.1% | -16.8% |
| Austin, TX | 8,093 | 15.0% | 0.4% |
| Bakersfield, CA | 2,020 | 2.5% | -1.6% |
| Baltimore, MD | 8,638 | 3.4% | -13.4% |
| Birmingham, AL | 3,893 | -1.5% | -21.5% |
| Boston, MA | 10,367 | 14.2% | -15.8% |
| Bridgeport, CT | 3,625 | 7.0% | -35.2% |
| Buffalo, NY | 1,953 | 6.7% | -6.1% |
| Camden, NJ | 3,888 | 2.2% | -15.7% |
| Charleston, SC | 4,457 | 0.8% | -23.6% |
| Charlotte, NC | 8,685 | 7.6% | -25.3% |
| Chicago, IL | 33,820 | 4.0% | 15.3% |
| Cincinnati, OH | 7,348 | 7.6% | -10.5% |
| Cleveland, OH | 6,300 | 5.4% | -12.9% |
| Columbus, OH | 6,729 | 11.2% | -6.0% |
| Dallas, TX | 13,072 | 11.4% | -11.2% |
| Dayton, OH | 2,446 | 12.7% | -4.3% |
| Denver, CO | 8,953 | 21.0% | 4.1% |
| Detroit, MI | 5,229 | 1.9% | 9.9% |
| El Paso, TX | 2,095 | -4.9% | -23.5% |
| Elgin, IL | 3,072 | 8.4% | 32.6% |
| Fort Lauderdale, FL | 9,672 | -8.3% | -32.4% |
| Fort Worth, TX | 6,415 | 9.5% | -5.8% |
| Frederick, MD | 3,239 | 6.0% | -21.7% |
| Fresno, CA | 1,550 | -2.6% | -4.6% |
| Grand Rapids, MI | 2,062 | 4.9% | -11.4% |
| Greensboro, NC | 1,582 | -11.8% | -39.9% |
| Greenville, SC | 3,242 | -0.6% | -19.5% |
| Hartford, CT | 3,535 | 7.6% | -30.1% |
| Houston, TX | 24,068 | 2.4% | -5.4% |
| Indianapolis, IN | 5,739 | 5.3% | -12.3% |
| Jacksonville, FL | 6,327 | 1.3% | -22.3% |
| Kansas City, MO | 7,168 | 7.8% | -12.4% |
| Knoxville, TN | 3,119 | 1.2% | -20.2% |
| Lake County, IL | 3,822 | 7.3% | 5.9% |
| Las Vegas, NV | 9,002 | 1.5% | -7.3% |
| Los Angeles, CA | 16,514 | -1.6% | -21.2% |
| Louisville, KY | 3,530 | 1.8% | -14.7% |
| McAllen, TX | 1,732 | -1.4% | -7.1% |
| Memphis, TN | 3,537 | 2.0% | -16.9% |
| Miami, FL | 12,526 | -7.4% | -28.0% |
| Milwaukee, WI | 5,219 | 6.4% | -13.0% |
| Minneapolis, MN | 11,746 | 11.5% | -3.7% |
| Montgomery County, PA | 4,680 | 6.5% | -21.9% |
| Nashville, TN | 7,537 | 7.7% | -7.7% |
| Nassau County, NY | 7,834 | 1.6% | -21.7% |
| New Brunswick, NJ | 9,418 | 5.7% | -1.1% |
| New Haven, CT | 2,842 | 9.1% | -23.2% |
| New Orleans, LA | 4,009 | 4.6% | -10.6% |
| New York, NY | 33,172 | 2.6% | -13.4% |
| Newark, NJ | 6,440 | 5.9% | -18.2% |
| North Port, FL | 4,448 | 4.7% | -4.9% |
| Oakland, CA | 5,292 | 3.5% | -3.0% |
| Oklahoma City, OK | 4,428 | 7.6% | 1.3% |
| Omaha, NE | 2,111 | 9.3% | -16.3% |
| Orlando, FL | 8,239 | -4.8% | -15.4% |
| Oxnard, CA | 1,808 | 0.9% | -14.2% |
| Philadelphia, PA | 7,862 | 1.7% | -7.1% |
| Phoenix, AZ | 18,348 | -0.2% | -6.2% |
| Pittsburgh, PA | 8,331 | 2.4% | -8.7% |
| Portland, OR | 6,484 | 3.7% | -9.7% |
| Providence, RI | 3,962 | 5.1% | -19.2% |
| Raleigh, NC | 4,962 | 6.5% | -24.3% |
| Richmond, VA | 3,298 | 2.6% | -19.1% |
| Riverside, CA | 13,526 | 0.8% | -5.4% |
| Rochester, NY | 1,982 | 7.9% | -9.3% |
| Sacramento, CA | 5,493 | 6.5% | -0.4% |
| San Antonio, TX | 7,419 | 3.1% | -6.5% |
| San Diego, CA | 5,365 | 1.2% | -15.9% |
| San Francisco, CA | 2,781 | -5.7% | -18.8% |
| San Jose, CA | 2,980 | 1.6% | -19.6% |
| Seattle, WA | 7,722 | 9.0% | -9.4% |
| St. Louis, MO | 7,845 | 10.0% | -16.8% |
| Tacoma, WA | 2,498 | 6.8% | 2.5% |
| Tampa, FL | 10,999 | 0.9% | -10.6% |
| Tucson, AZ | 4,159 | -2.1% | -7.7% |
| Tulsa, OK | 2,652 | 5.6% | -13.1% |
| Honolulu, HI | 3,041 | -5.6% | -16.7% |
| Virginia Beach, VA | 6,023 | 3.1% | -17.2% |
| Warren, MI | 7,331 | 9.9% | -4.2% |
| Washington, DC | 15,236 | 5.4% | -16.5% |
| West Palm Beach, FL | 9,312 | -1.5% | -18.5% |
| Worcester, MA | 2,218 | 17.6% | -10.6% |
| National | 1,351,900 | -1.3% | -9.3% |
Median Off-Market Redfin Estimate
| Redfin Metro | Estimate | Month-Over-Month | Year-Over-Year |
|---|---|---|---|
| Albany, NY | $235,000 | 2.0% | 8.0% |
| Allentown, PA | $279,600 | 1.1% | 18.5% |
| Anaheim, CA | $1,037,300 | 2.9% | 27.4% |
| Atlanta, GA | $341,700 | 2.2% | 30.6% |
| Austin, TX | $502,800 | 4.1% | 42.0% |
| Bakersfield, CA | $273,600 | 1.9% | 26.2% |
| Baltimore, MD | $341,700 | 1.1% | 14.5% |
| Baton Rouge, LA | $151,400 | 0.8% | 7.3% |
| Birmingham, AL | $174,900 | 1.4% | 16.9% |
| Boston, MA | $637,900 | 1.2% | 11.7% |
| Bridgeport, CT | $478,900 | 1.0% | 14.0% |
| Buffalo, NY | $201,000 | 3.6% | 19.4% |
| Camden, NJ | $286,700 | 1.2% | 22.3% |
| Charleston, SC | $328,600 | 2.0% | 25.2% |
| Charlotte, NC | $315,800 | 1.8% | 29.6% |
| Chicago, IL | $291,600 | 1.2% | 5.6% |
| Cincinnati, OH | $219,800 | 1.4% | 19.6% |
| Cleveland, OH | $184,400 | 2.5% | 17.5% |
| Columbus, OH | $259,800 | 1.4% | 17.4% |
| Dallas, TX | $377,100 | 3.1% | 32.1% |
| Dayton, OH | $164,300 | 0.9% | 17.3% |
| Denver, CO | $574,300 | 3.0% | 25.8% |
| Detroit, MI | $132,000 | 1.3% | 14.4% |
| Elgin, IL | $273,500 | 1.5% | 10.6% |
| Fort Lauderdale, FL | $369,100 | 2.5% | 23.2% |
| Fort Worth, TX | $316,400 | 2.8% | 30.1% |
| Frederick, MD | $517,200 | 1.1% | 15.1% |
| Fresno, CA | $368,600 | 1.9% | 25.0% |
| Grand Rapids, MI | $242,500 | 1.9% | 21.7% |
| Greensboro, NC | $189,900 | 1.7% | 21.2% |
| Greenville, SC | $221,700 | 1.9% | 24.2% |
| Hartford, CT | $279,500 | 1.4% | 16.7% |
| Houston, TX | $271,200 | 2.0% | 24.1% |
| Indianapolis, IN | $226,300 | 1.5% | 22.4% |
| Jacksonville, FL | $312,400 | 2.9% | 31.1% |
| Kansas City, MO | $247,700 | 1.7% | 22.3% |
| Knoxville, TN | $258,400 | 2.2% | 27.9% |
| Lake County, IL | $258,400 | 1.4% | 10.2% |
| Las Vegas, NV | $407,700 | 2.4% | 30.5% |
| Los Angeles, CA | $848,000 | 1.6% | 18.6% |
| Louisville, KY | $207,000 | 1.2% | 6.8% |
| Memphis, TN | $200,300 | 1.9% | 18.4% |
| Miami, FL | $424,100 | 2.3% | 23.4% |
| Milwaukee, WI | $261,400 | 1.3% | 16.1% |
| Minneapolis, MN | $343,300 | 1.3% | 15.6% |
| Montgomery County, PA | $417,100 | 1.1% | 17.0% |
| Nashville, TN | $402,100 | 2.4% | 32.3% |
| Nassau County, NY | $607,500 | 0.7% | 12.9% |
| New Brunswick, NJ | $460,300 | 1.0% | 19.3% |
| New Haven, CT | $289,000 | 1.6% | 18.4% |
| New Orleans, LA | $205,600 | 1.3% | 10.3% |
| Newark, NJ | $458,000 | 0.8% | 11.2% |
| North Port, FL | $378,600 | 3.8% | 43.0% |
| Oakland, CA | $1,074,800 | 3.0% | 23.1% |
| Oklahoma City, OK | $188,800 | 1.5% | 17.8% |
| Omaha, NE | $245,300 | 1.3% | 16.4% |
| Orlando, FL | $338,300 | 2.7% | 31.2% |
| Oxnard, CA | $812,800 | 1.8% | 22.8% |
| Philadelphia, PA | $235,700 | 0.7% | 9.9% |
| Phoenix, AZ | $447,900 | 3.0% | 40.0% |
| Pittsburgh, PA | $161,600 | 0.6% | 8.5% |
| Portland, OR | $535,900 | 2.3% | 21.6% |
| Providence, RI | $390,100 | 1.3% | 17.2% |
| Raleigh, NC | $381,700 | 2.4% | 34.2% |
| Richmond, VA | $298,300 | 1.3% | 16.1% |
| Riverside, CA | $501,700 | 2.4% | 30.7% |
| Rochester, NY | $189,300 | 3.4% | 19.0% |
| Sacramento, CA | $582,200 | 2.1% | 24.0% |
| Salt Lake City, UT | $546,300 | 3.4% | 34.8% |
| San Antonio, TX | $252,400 | 1.9% | 24.2% |
| San Diego, CA | $877,500 | 2.6% | 27.9% |
| San Francisco, CA | $1,607,700 | 2.1% | 15.3% |
| San Jose, CA | $1,622,700 | 3.5% | 26.6% |
| Seattle, WA | $810,900 | 3.9% | 26.2% |
| St. Louis, MO | $188,700 | 1.3% | 13.1% |
| Tacoma, WA | $525,400 | 1.8% | 22.7% |
| Tampa, FL | $329,300 | 3.1% | 32.4% |
| Tucson, AZ | $296,000 | 2.4% | 25.7% |
| Tulsa, OK | $165,300 | 1.3% | 14.1% |
| Honolulu, HI | $881,900 | 1.1% | 17.7% |
| Virginia Beach, VA | $293,800 | 1.3% | 15.9% |
| Warren, MI | $264,800 | 1.4% | 14.0% |
| Washington, DC | $498,800 | 1.1% | 14.0% |
| West Palm Beach, FL | $404,100 | 2.9% | 33.0% |
| Worcester, MA | $366,300 | 1.0% | 16.9% |
| National | $415,000 | 1.4% | 22.1% |


