Inflation has begun to slow, which is already helping bring daily mortgage rates down. However, a longer trend of lower inflation is needed for sustained rate relief.
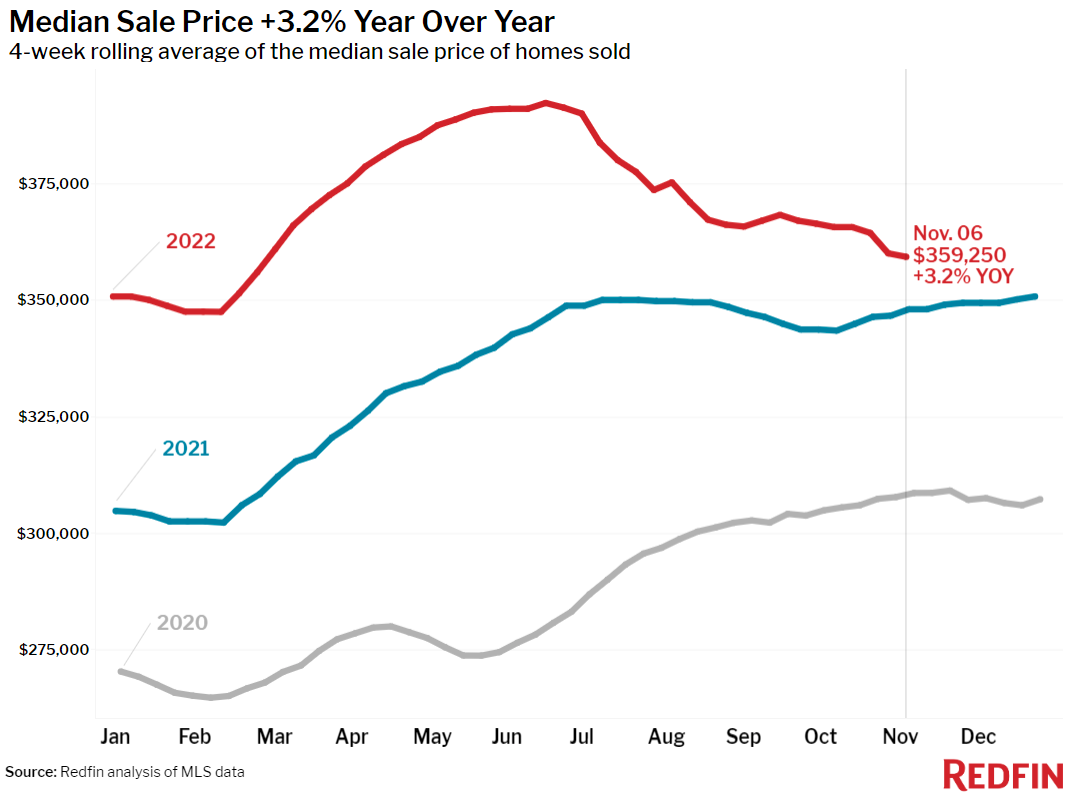
Home-sale prices rose 3.2% year over year during the four-week period ending November 6, the smallest increase since July 2020. The median home sale price has fallen 8.4% since reaching an all-time high in June, when the average 30-year fixed mortgage rate was over a point lower than it is now. Home prices rose half a percent during the same period last year.
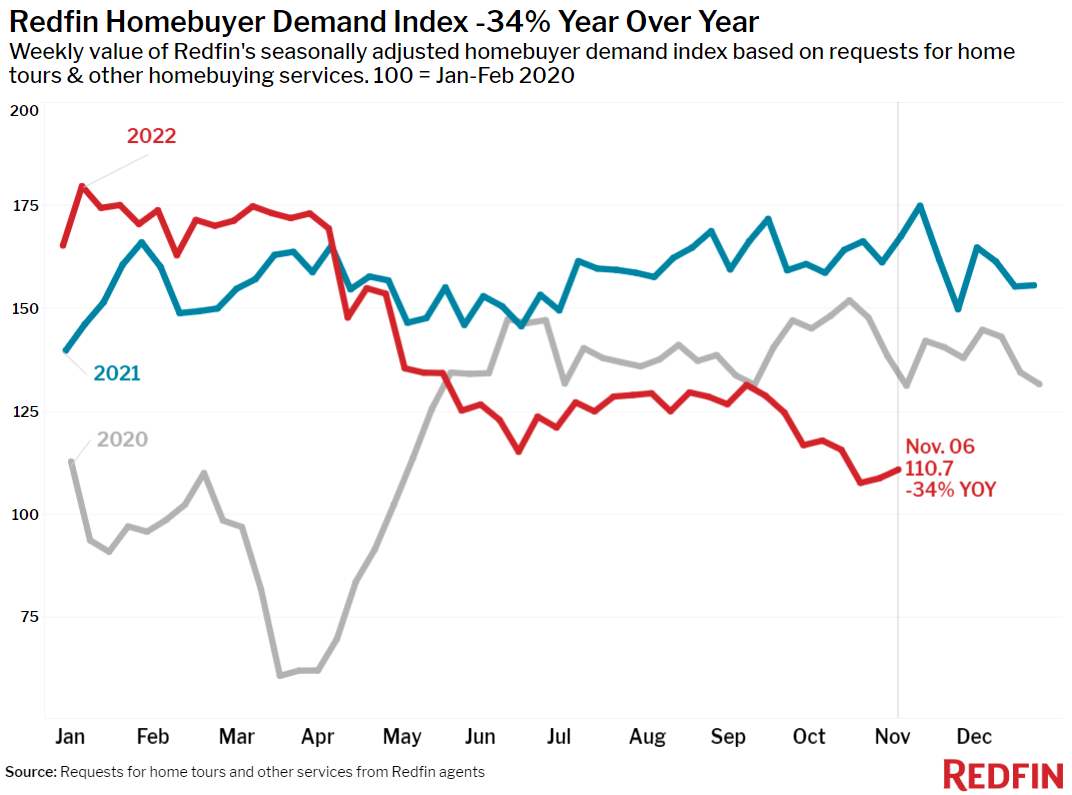
Early stage demand may be leveling off as serious homebuyers who must be in the market now grow accustomed to mortgage rates near 7% and their ability to negotiate with sellers on price and terms improves. Mortgage purchase applications ticked up last week after six weeks of declines. Redfin’s Homebuyer Demand Index—a measure of requests for home tours and other home-buying services from Redfin agents—increased 2.8% in the week ending November 6.
“This morning’s report that the overall inflation rate is finally starting to back off makes it even more likely that the Fed will slow their rate increase to 50 basis points next month,” said Redfin Deputy Chief Economist Taylor Marr. “The inflation news is already helping to bring daily mortgage rates down. However, Chair Powell has indicated that inflation would need to slow for several consecutive months before the Fed would lower its target for how high it raises rates next year.”
“Still-high home prices are propping up inflation,” Marr continued. “But things are changing fast–faster than the numbers we have would suggest. The employment numbers that came out today don’t reflect this week’s layoffs, and prices of the past month’s closed sales don’t reflect the contracts homebuyers are signing with sellers today. The buyers who remain in this market are likely getting much better deals than the median asking or sale price reflects. The typical home now sells for less than asking, price drops remain at a record high and seller concessions are becoming increasingly common.”
Leading indicators of homebuying activity:
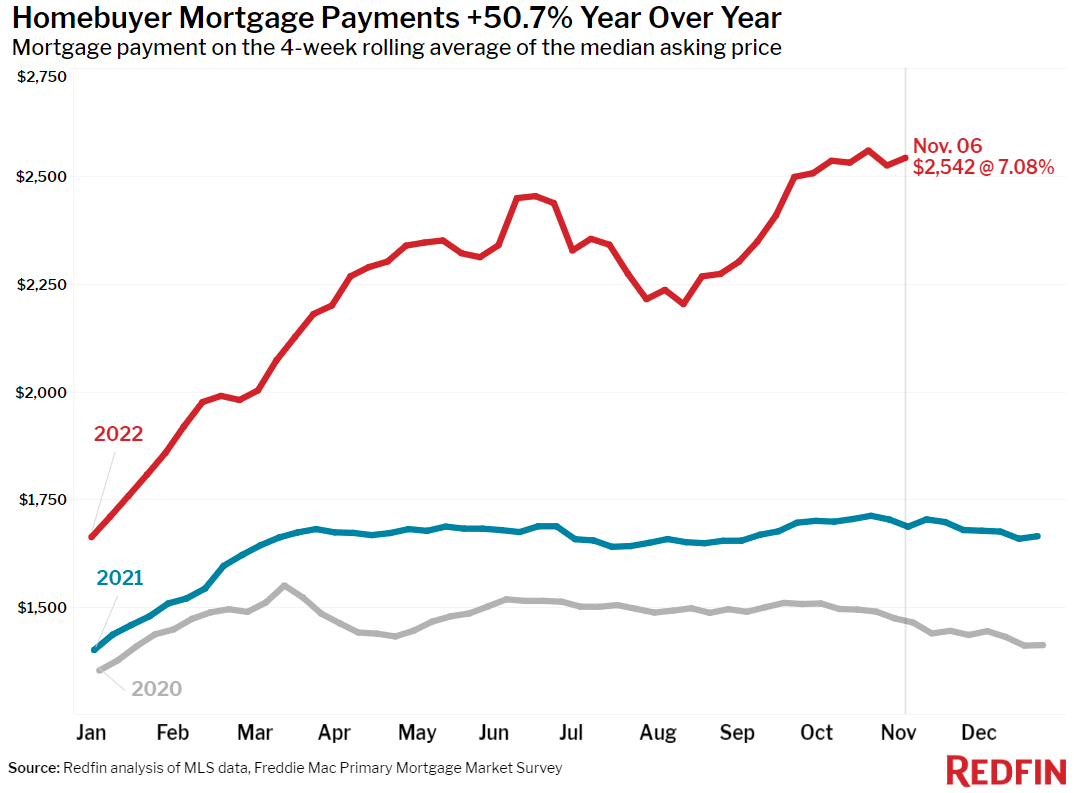
- For the week ending November 10, 30-year mortgage rates increased to 7.08%.
- Fewer people searched for “homes for sale” on Google than this time in 2021. Searches during the week ending November 5 were down 28% from a year earlier, but ticked up a point from the previous week.
- The seasonally adjusted Redfin Homebuyer Demand Index—a measure of requests for home tours and other home-buying services from Redfin agents— was up 2.8% week over week during the week ending November 6 but down 34% year over year during the four weeks ending November 6.
- Touring activity as of November 6 was down 30% from the start of the year, compared to a 4% increase at the same time last year, according to home tour technology company ShowingTime.
- Mortgage purchase applications during the week ending November 4 increased 1% week over week, seasonally adjusted. Purchase applications were down 41% from a year earlier.
Key housing market takeaways for 400+ U.S. metro areas:
Unless otherwise noted, the data in this report covers the four-week period ending November 6. Redfin’s weekly housing market data goes back through 2015.
Data based on homes listed and/or sold during the period:
- The median home sale price was $359,250, up 3% year over year, the slowest sale-price growth since the beginning of the pandemic.
- Home-sale prices fell from a year earlier in six U.S. metro areas: Prices declined 6% year over year in San Francisco, 6% in Lake County, IL, 3% in Stockton, CA, and less than 1% in Oakland, CA, San Jose, CA and Pittsburgh, PA.
- Among metro areas with at least 500 pending sales during the period, pending sales fell the most from a year ago in Las Vegas (-55%), Miami (-49%), Seattle (-48%), Portland, OR (-47%), Phoenix (-46%), Riverside, CA (-46%) and Atlanta, GA (-45%).
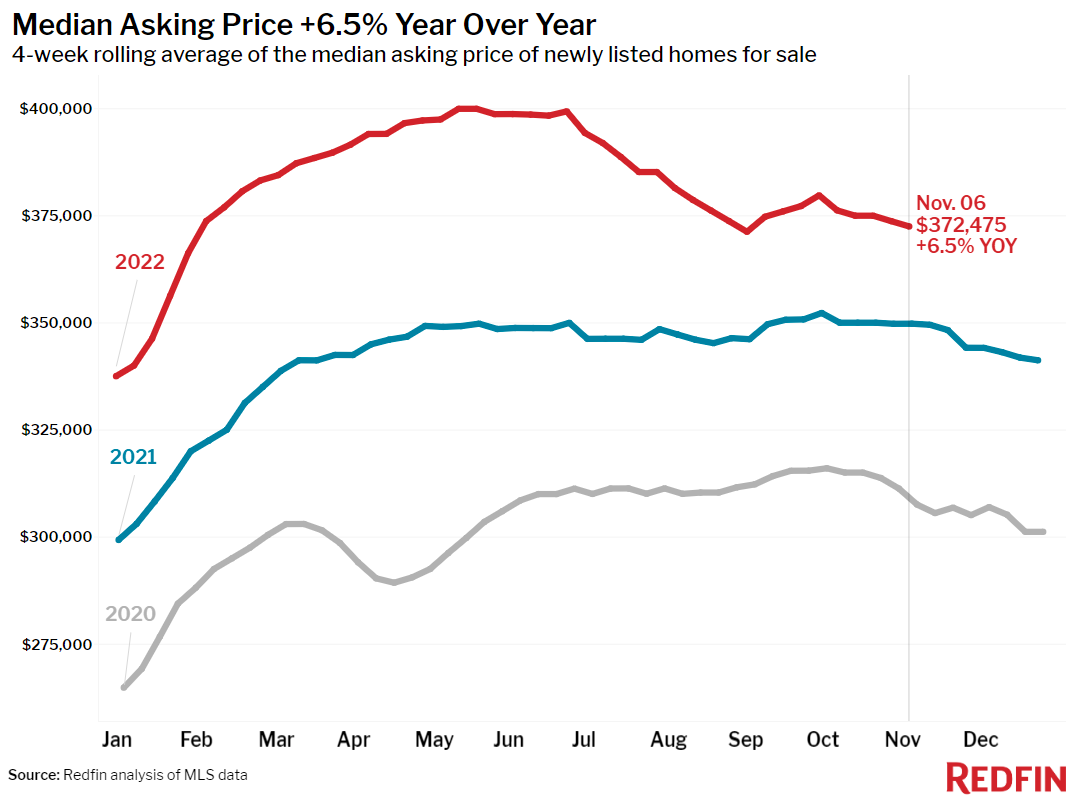
- The median asking price of newly listed homes was $372,475, up 7% year over year but down 7% from a record high of $399,975 in May.
- The monthly mortgage payment on the median-asking-price home was $2,542 at the current 7.08% mortgage rate, up 50.7% from $1,687 a year earlier, when mortgage rates were 2.98% and up from a recent low of $2,203 during the four-week period ending August 14.
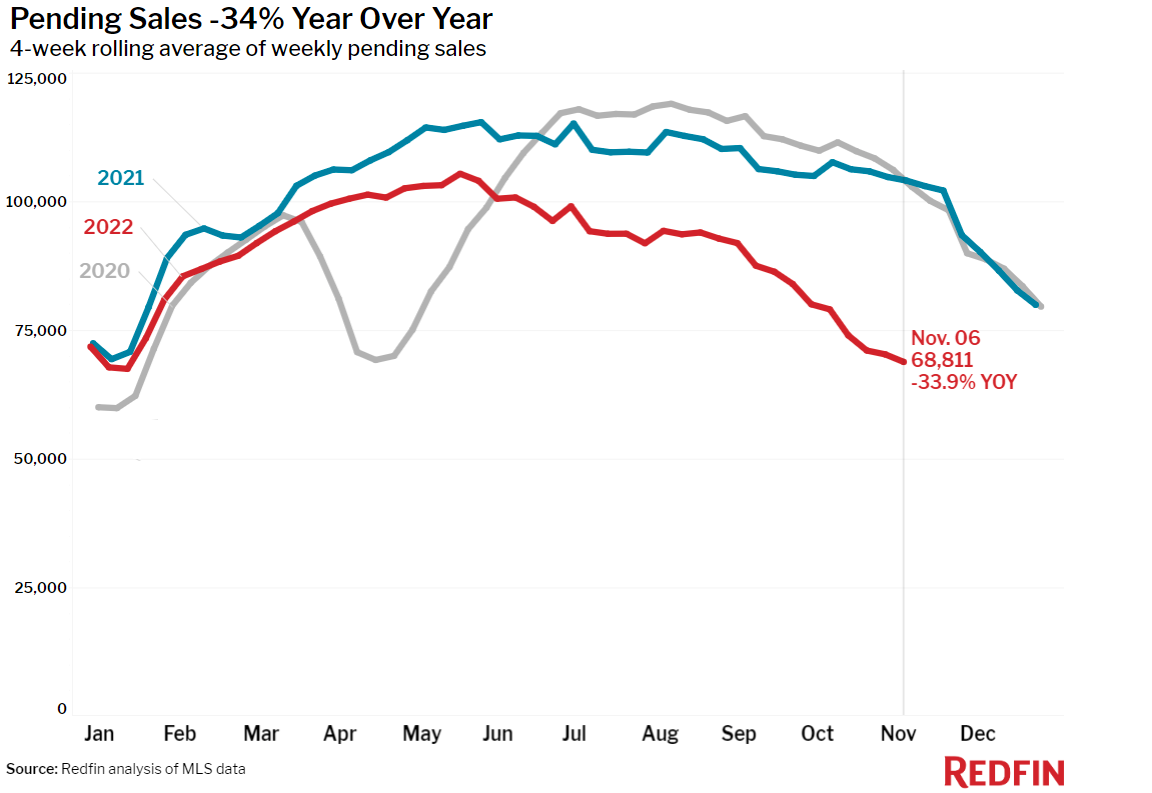
- Pending home sales were down 34% year over year, the largest decline since at least January 2015, as far back as this data goes.
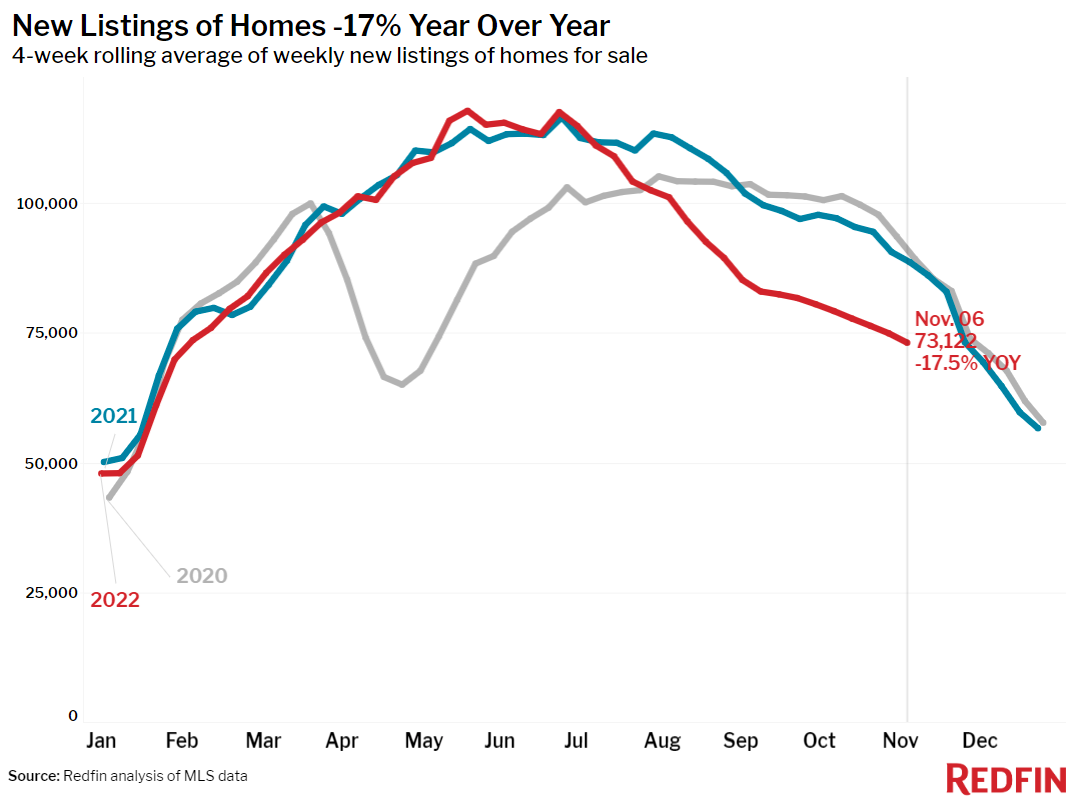
- New listings of homes for sale were down 17% from a year earlier.
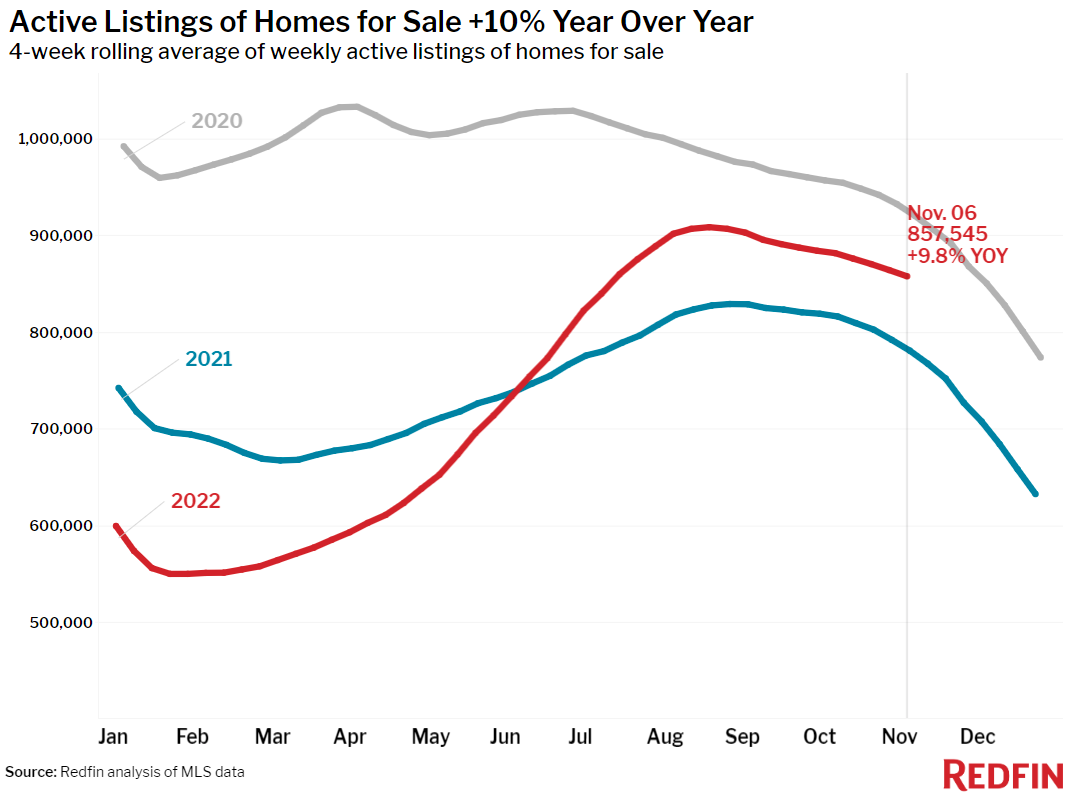
- Active listings (the number of homes listed for sale at any point during the period) were up 10% from a year earlier.
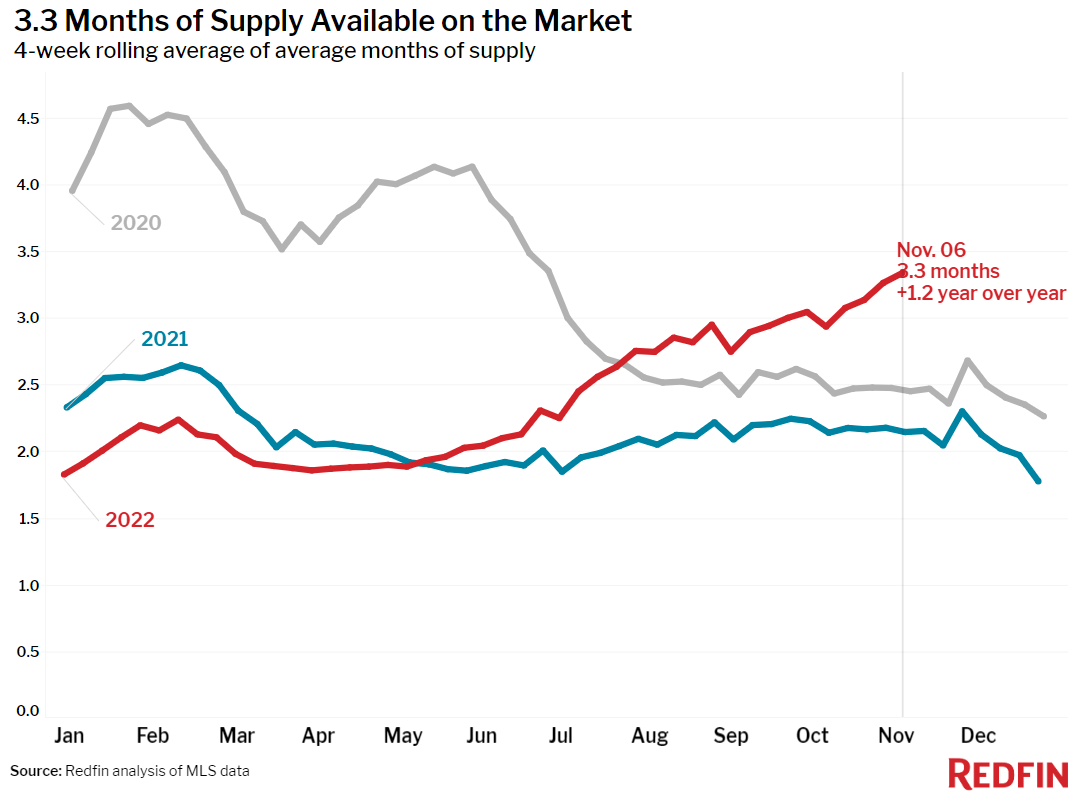
- Months of supply—a measure of the balance between supply and demand, calculated by dividing the number of active listings by closed sales—was 3.3 months, the highest level since June 2020.
- 34% of homes that went under contract had an accepted offer within the first two weeks on the market, little changed from the prior four-week period but down from 40% a year earlier.
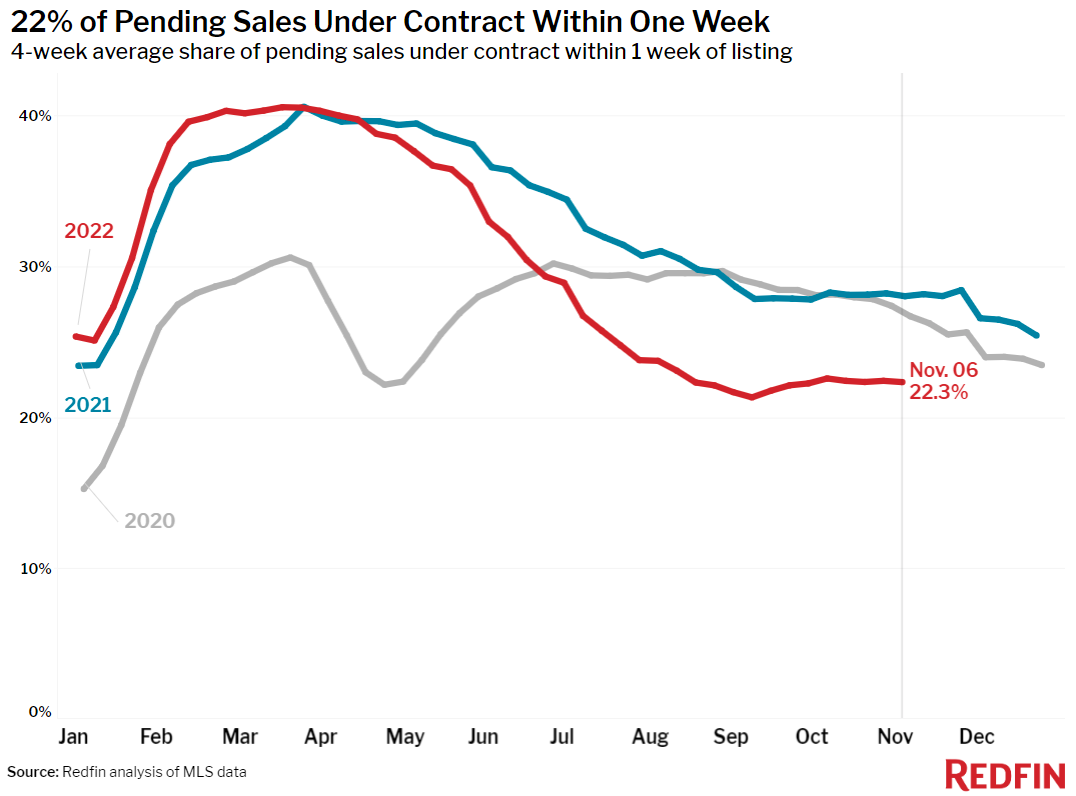
- 22% of homes that went under contract had an accepted offer within one week of hitting the market, little changed from the prior four-week period but down from 28% a year earlier.
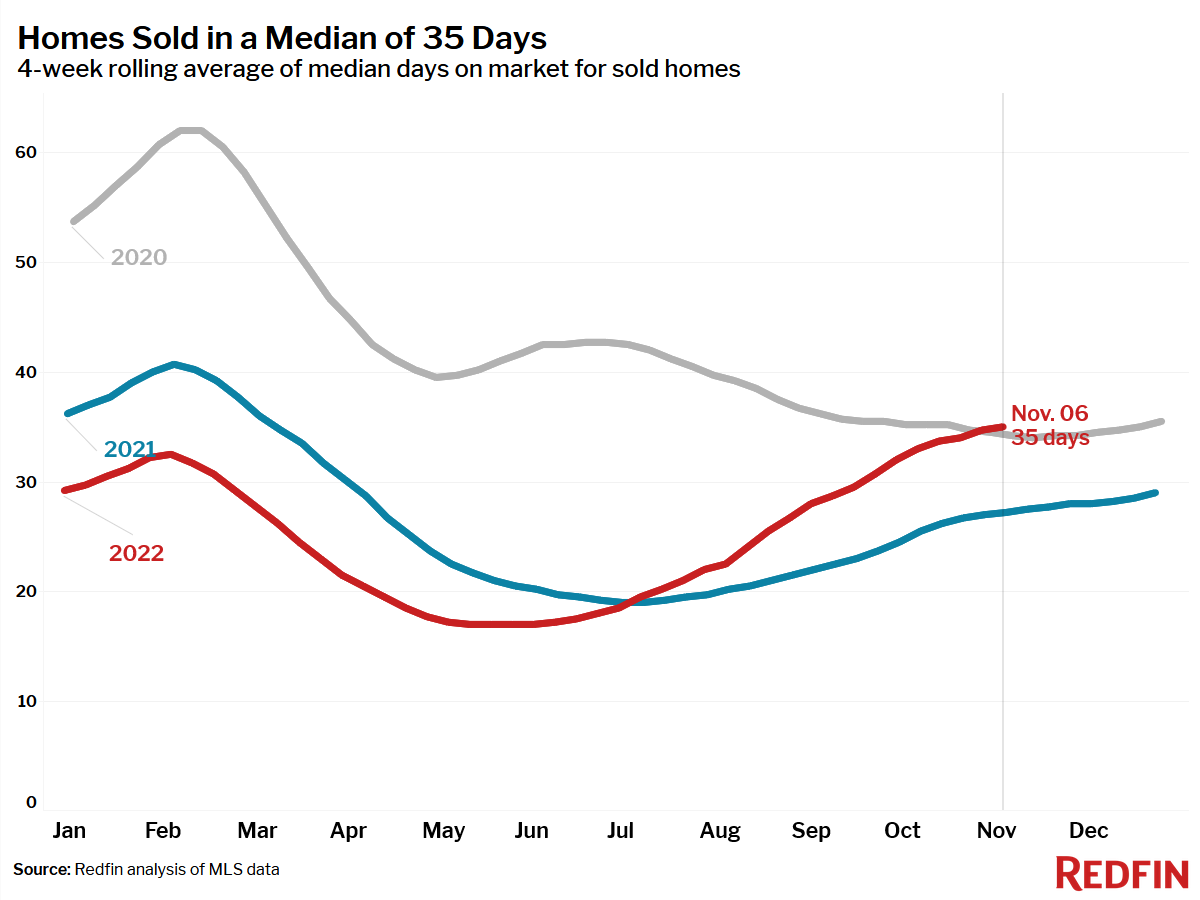
- Homes that sold were on the market for a median of 35 days, up more than a week from 27 days a year earlier and up from the record low of 17 days set in May and early June.
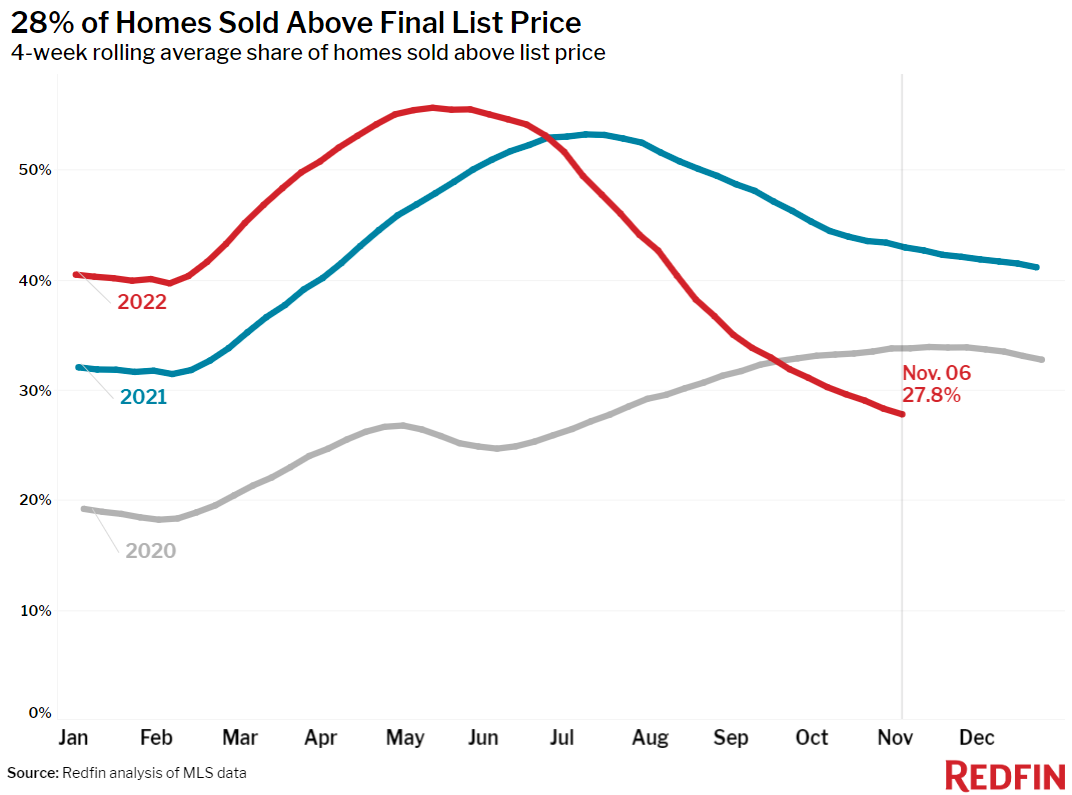
- 28% of homes sold above their final list price, down from 43% a year earlier and the lowest level since July 2020.
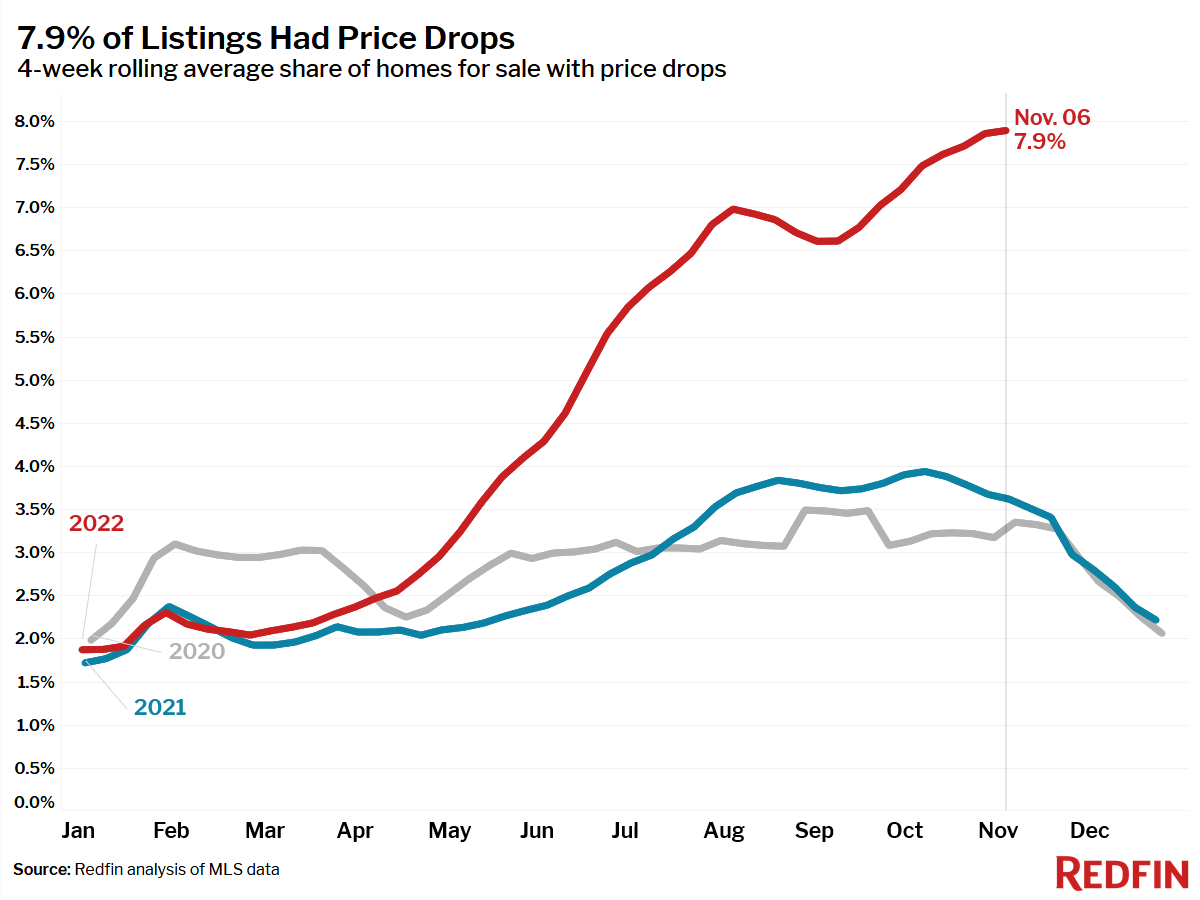
- On average, a record 7.9% of homes for sale each week had a price drop, up from 3.6% a year earlier.
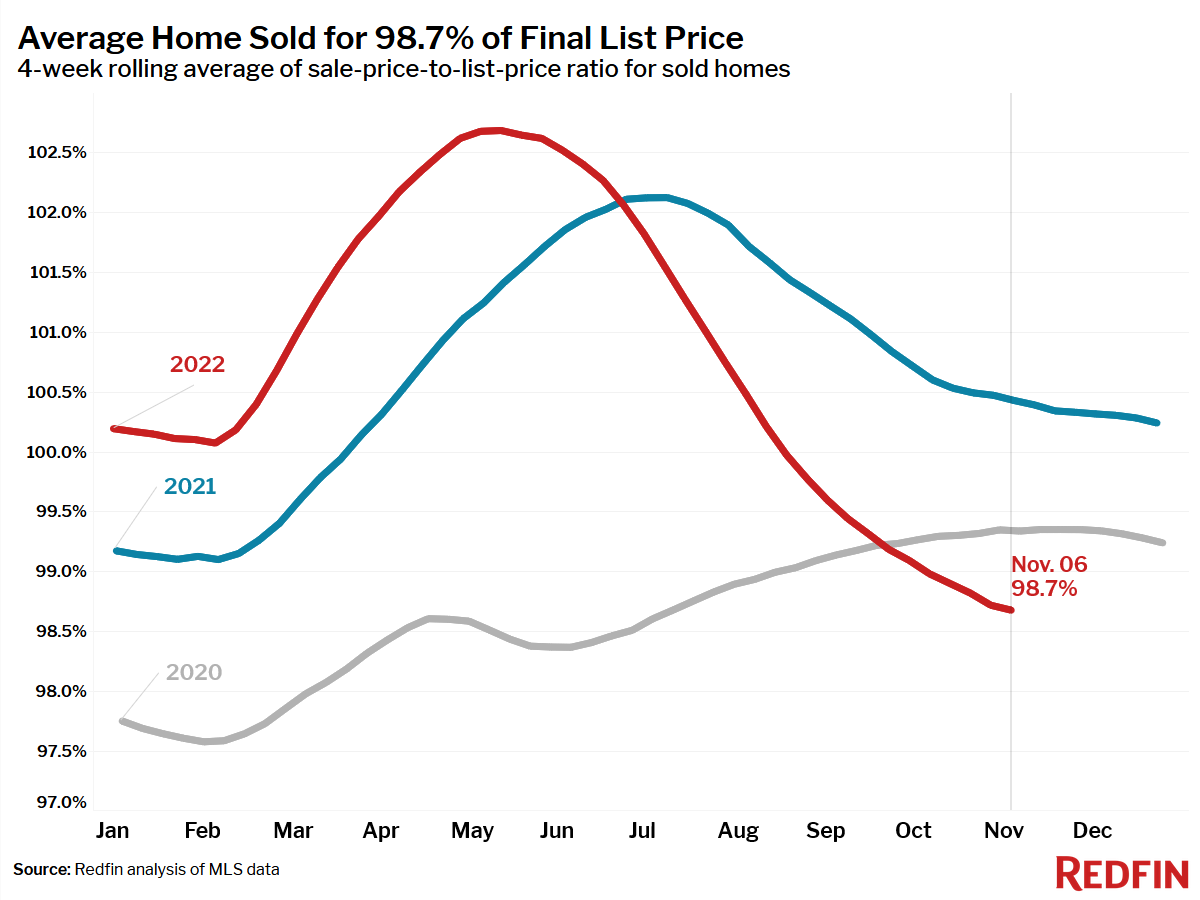
- The average sale-to-list price ratio, which measures how close homes are selling to their final asking prices, fell to 98.7% from 100.4% a year earlier. This was the lowest level since July 2020.
Refer to our metrics definition page for explanations of all the metrics used in this report.

 United States
 Canada