A few measures of homebuying demand ticked up in the last week of October, a month that saw one-third fewer pending sales than a year earlier. A glimmer of hope could be seen in the data that mostly reflects a housing market coping with the pain of high mortgage rates, which this week’s Fed statement suggests may take longer to come down than previously expected.
One-third fewer homes went under contract in October than last year, the largest decline since at least 2015, with several pandemic boomtowns including Las Vegas, Miami and Phoenix posting declines of around 50%. Nationwide, a record high share of home sellers dropped their price last month.
But as mortgage rates dipped below 7% in the final week of October, a handful of key measures of homebuying demand stabilized after several weeks of declines: Google searches of “homes for sale,” Redfin’s Homebuyer Demand Index, mortgage purchase applications and pending sales.
Redfin agents in the Midwest and Mountain West report that they have seen first-time and other budget-restricted buyers return to the market in recent weeks to take advantage of the opportunity to be choosy about home features, take their time to make sure they are offering on the right home at the right price, do thorough inspections, make below-asking offers and negotiate for concessions from sellers.
It’s too soon to say whether this is a momentary pause in the market’s cooling trend as buyers who have been watching and waiting seized a moment of stability in mortgage rates to make their bid, or if it’s the start of a broader leveling off in market activity as buyers adjust their budgets and expectations around a 7% mortgage rate.
“This week the Fed brought into view the light at the end of the tunnel for slowing the pace of interest rate hikes, but that the tunnel’s exit may be more dreadful than expected,” said Redfin Deputy Chief Economist Taylor Marr. “There is also a glimmer of hope in the data that buyers stopped leaving the market as mortgage rates leveled off this week, but we’re still deep in a market that is coping with the pains of higher mortgage rates. Mortgage rates may take longer to come down than many have expected, which means housing trends could continue to worsen as the economy adjusts to higher rates. If last year’s housing market was as overheated as Chair Powell stated on Wednesday, then record growth in rates was like a bucket of water poured on the flames to bring it into balance. It may take some time for the smoke to clear to see where things stand next year.”
Leading indicators of homebuying activity:
- For the week ending November 3, 30-year mortgage rates fell to 6.95%.
- Fewer people searched for “homes for sale” on Google than this time in 2021. Searches during the week ending October 29 were down 32% from a year earlier, but ticked up a point from the previous week.
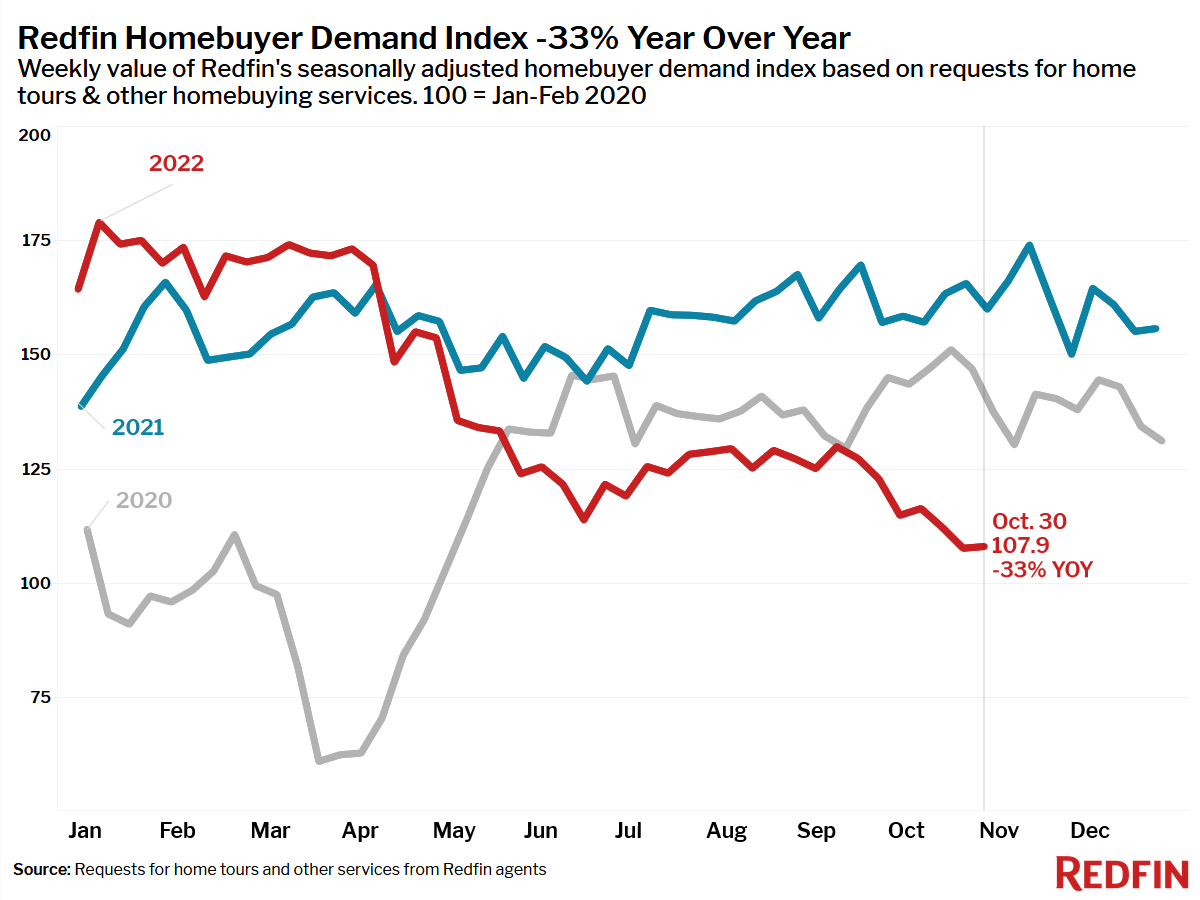
- The seasonally adjusted Redfin Homebuyer Demand Index—a measure of requests for home tours and other home-buying services from Redfin agents—rose half a percent in the past week, and was down 33% year over year.
- Touring activity as of October 30 was down 30% from the start of the year, compared to a 2% increase at the same time last year, according to home tour technology company ShowingTime. The gap between touring activity in 2022 and 2021 shrank 3 percentage points in the past week, indicating that the seasonal decline last week in touring is less severe this year.
- Mortgage purchase applications during the week ending October 28 were down 1% week over week, seasonally adjusted, the smallest week-over-week decline in five weeks. Purchase applications were down 41% from a year earlier.
Key housing market takeaways for 400+ U.S. metro areas:
Unless otherwise noted, the data in this report covers the four-week period ending October 2. Redfin’s housing market data goes back through 2012.
Data based on homes listed and/or sold during the period:
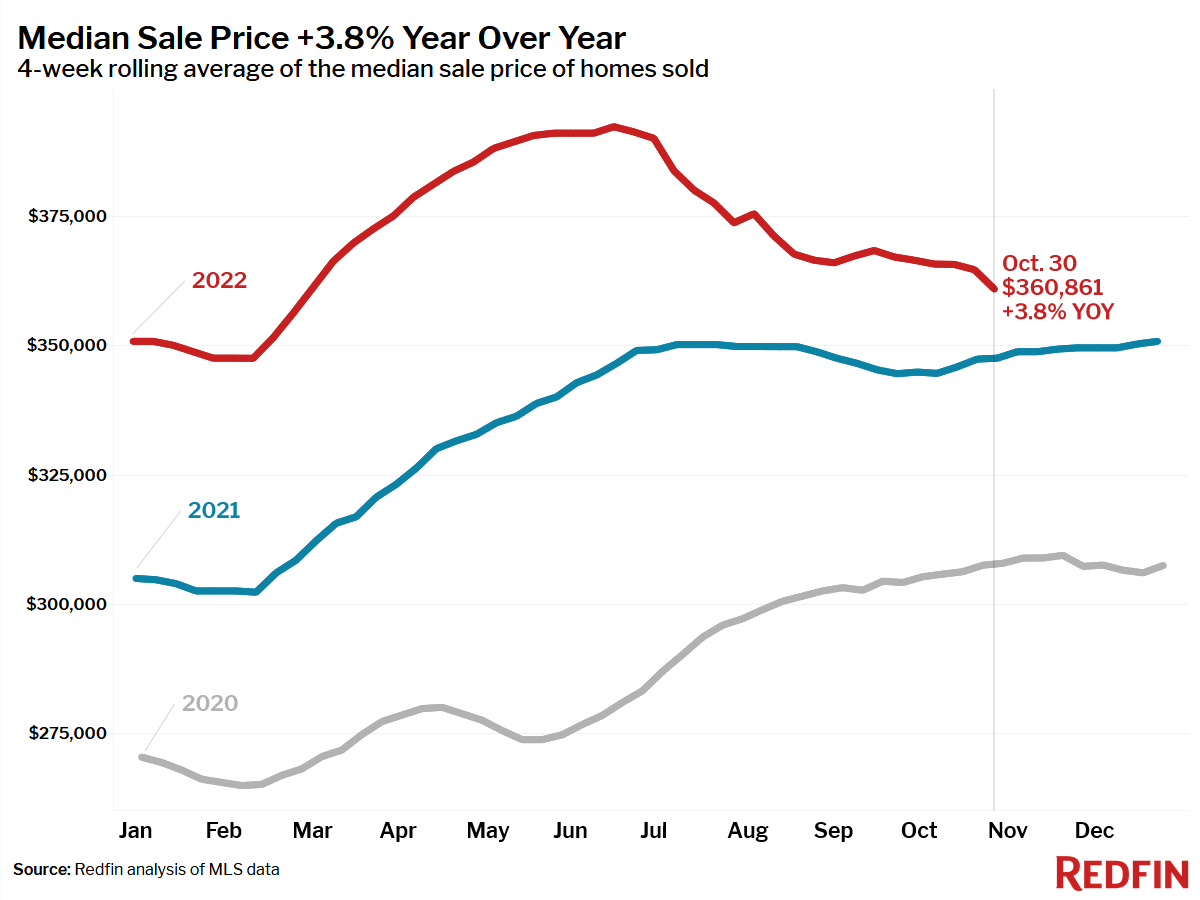
- The median home sale price was $360,861, up 4% year over year. This growth rate was down 13 points from the peak annual increase in March.
- Home-sale prices fell from a year earlier in four U.S. metro areas: Prices declined 5% year over year in San Francisco, 2% in Oakland, CA, 2% in San Jose, CA and less than 1% in Lake County, IL.
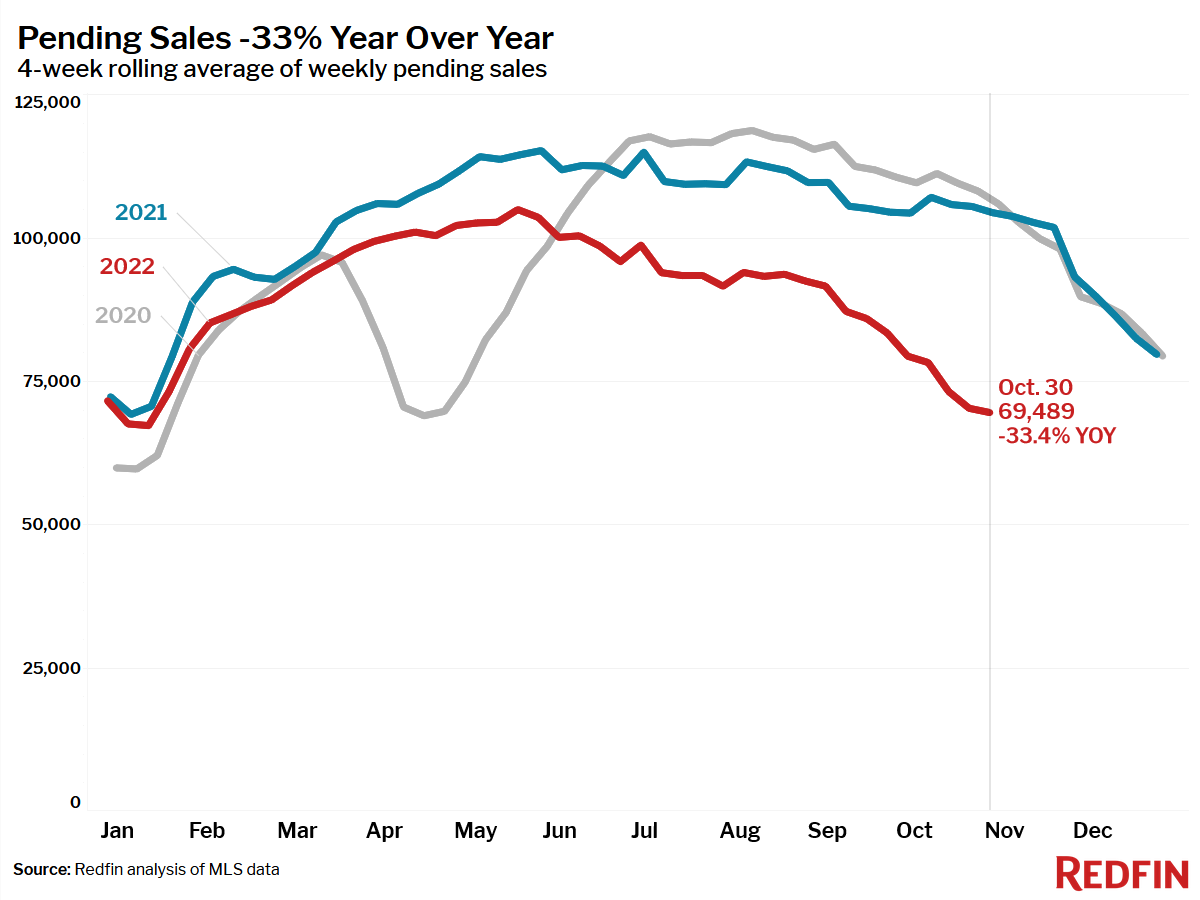
- Among metro areas with at least 500 pending sales during the period, pending sales fell the most from a year ago in Las Vegas (-53%), Miami (-48%), Seattle (-48%), Phoenix, (-47%), Portland, OR (-46%) and Riverside, CA (-45%).
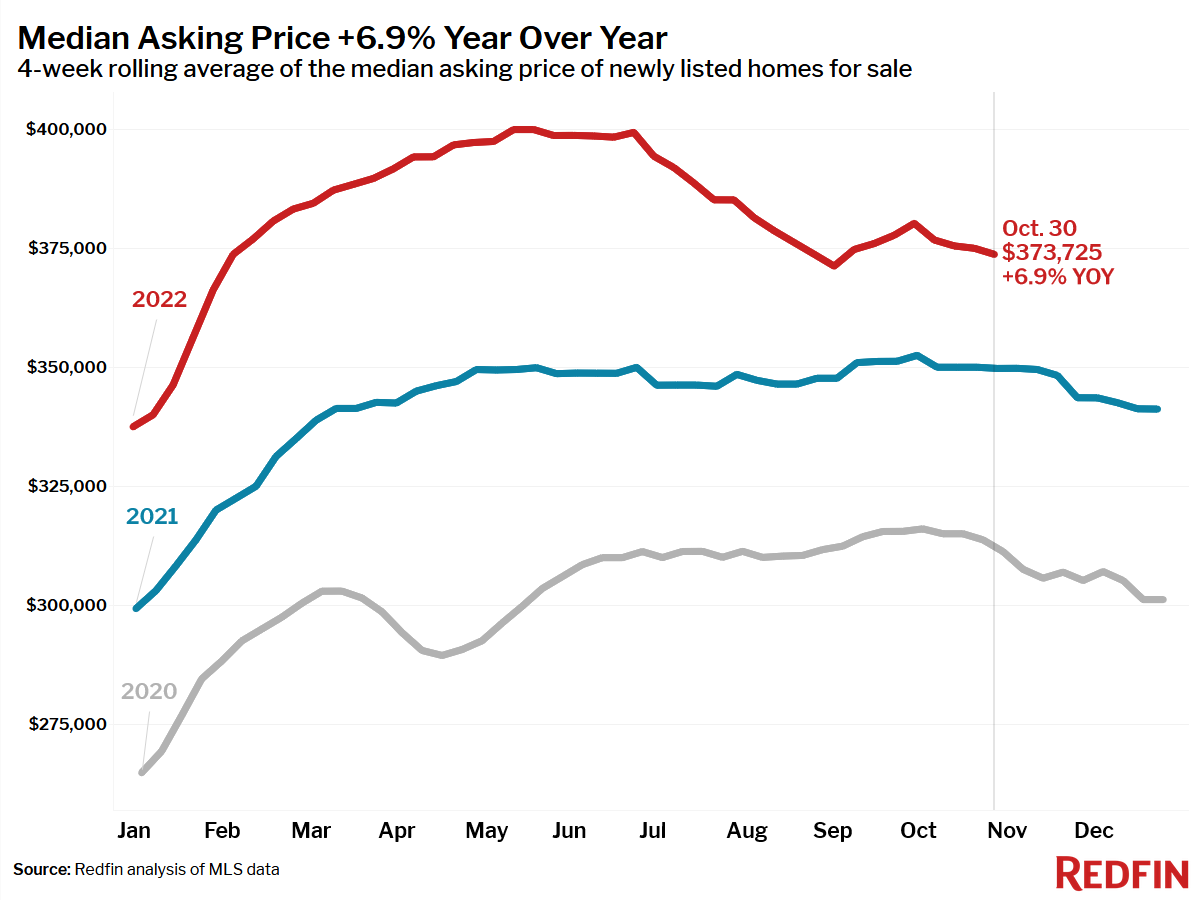
- The median asking price of newly listed homes was 7% higher than a year ago at $373,725, but down 7% from a record high of $399,975 in May.
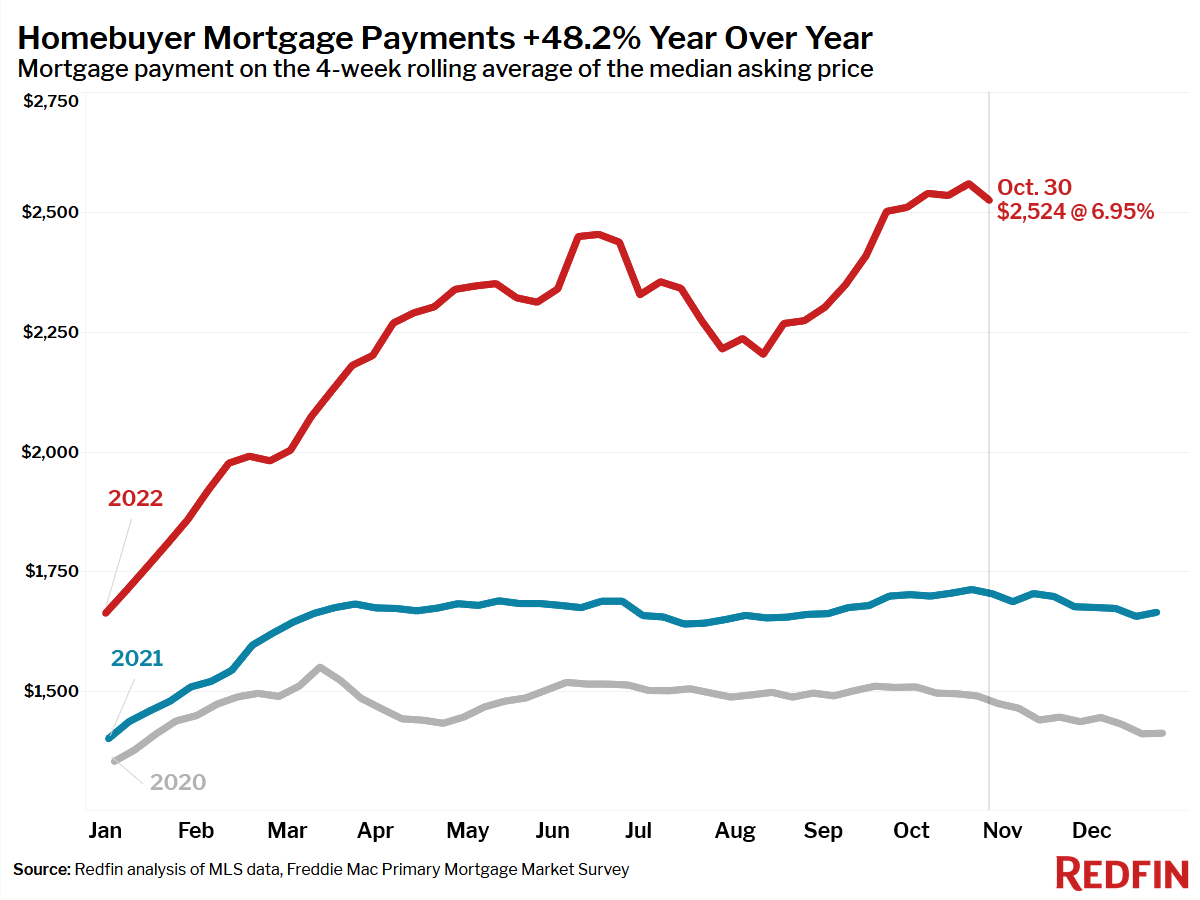
- The monthly mortgage payment on the median-asking-price home was $2,524 at the current 6.95% mortgage rate, up 48% from $1,703 a year earlier, when mortgage rates were 3.09% and up from a recent low of $2,203 during the four-week period ending August 14.
- Pending home sales were down 33% year over year, the largest decline since at least January 2015, as far back as this data goes, but during the seven-day period ending October 30, pending sales were up slightly from the previous week, the first increase in two months.
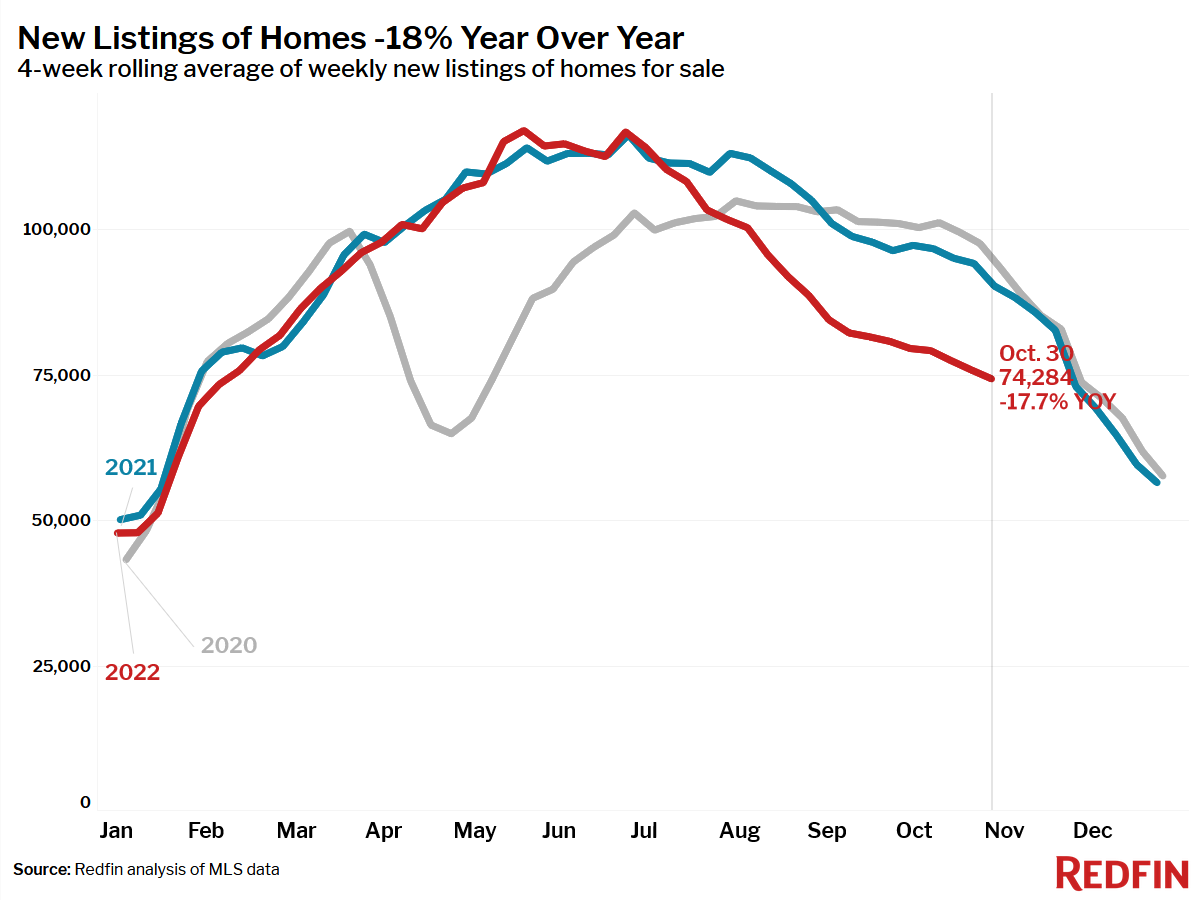
- New listings of homes for sale were down 18% from a year earlier. This was less extreme than the 20% decline in the four-week period ending October 23.
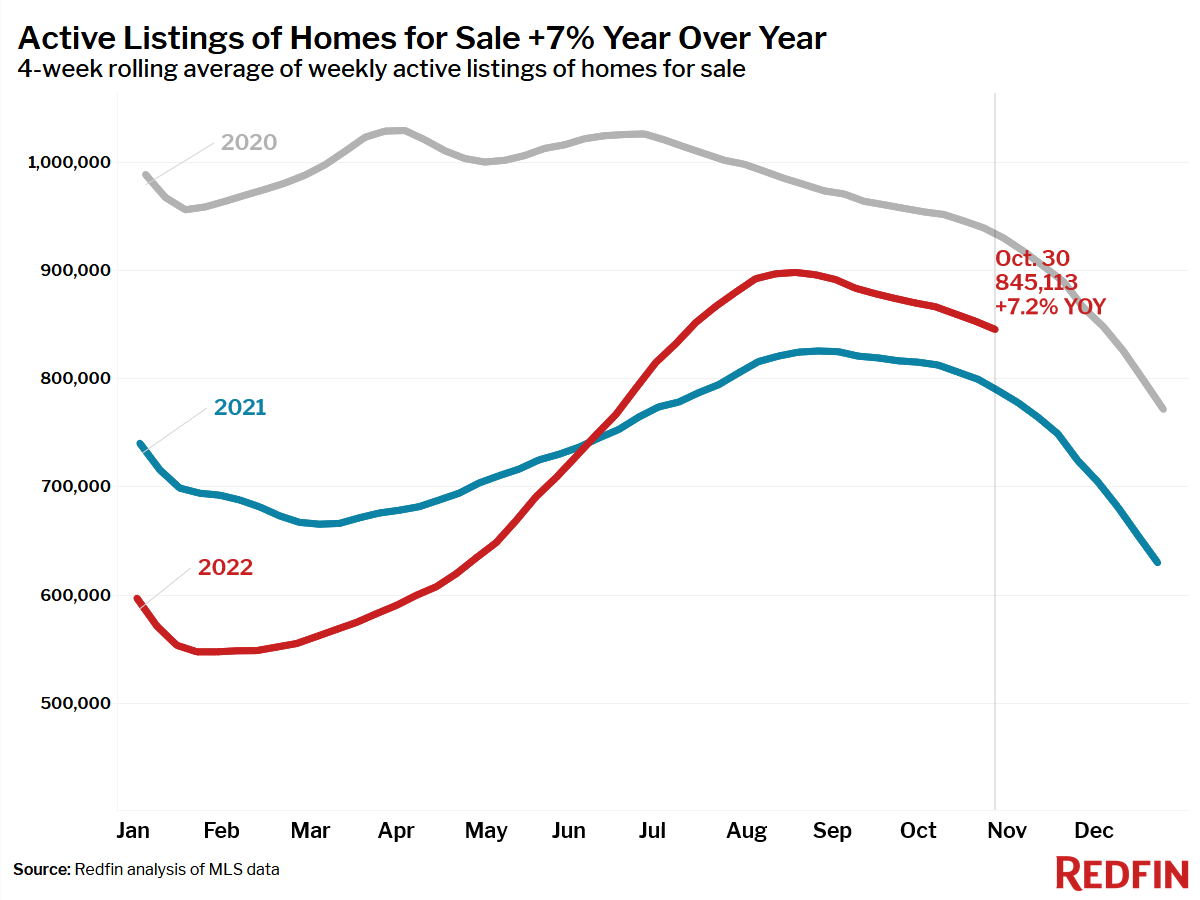
- Active listings (the number of homes listed for sale at any point during the period) were 7.4% above a year earlier. This was up from 7.0% in the previous period and the largest increase in six weeks.
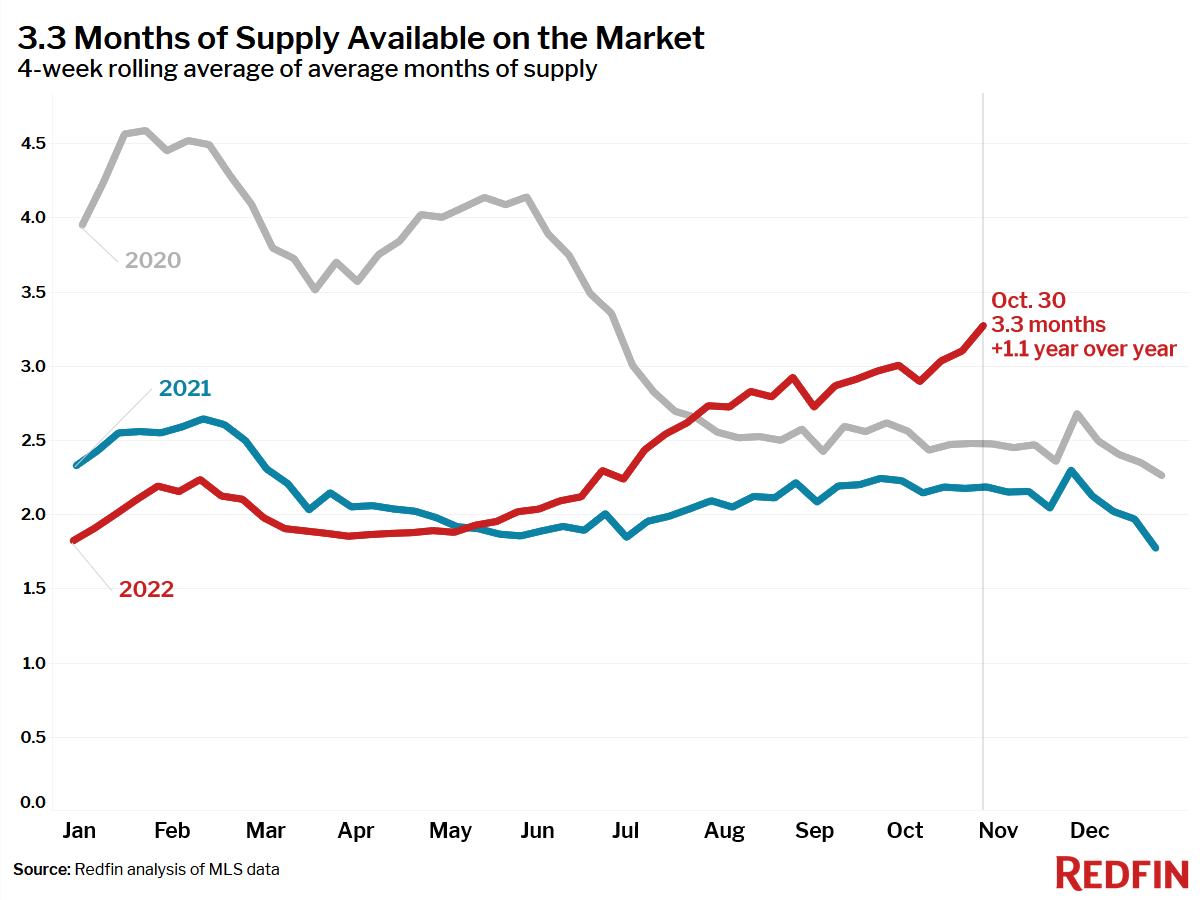
- Months of supply—a measure of the balance between supply and demand, calculated by dividing the number of active listings by closed sales—increased to 3.3 months, the highest level since June 2020.
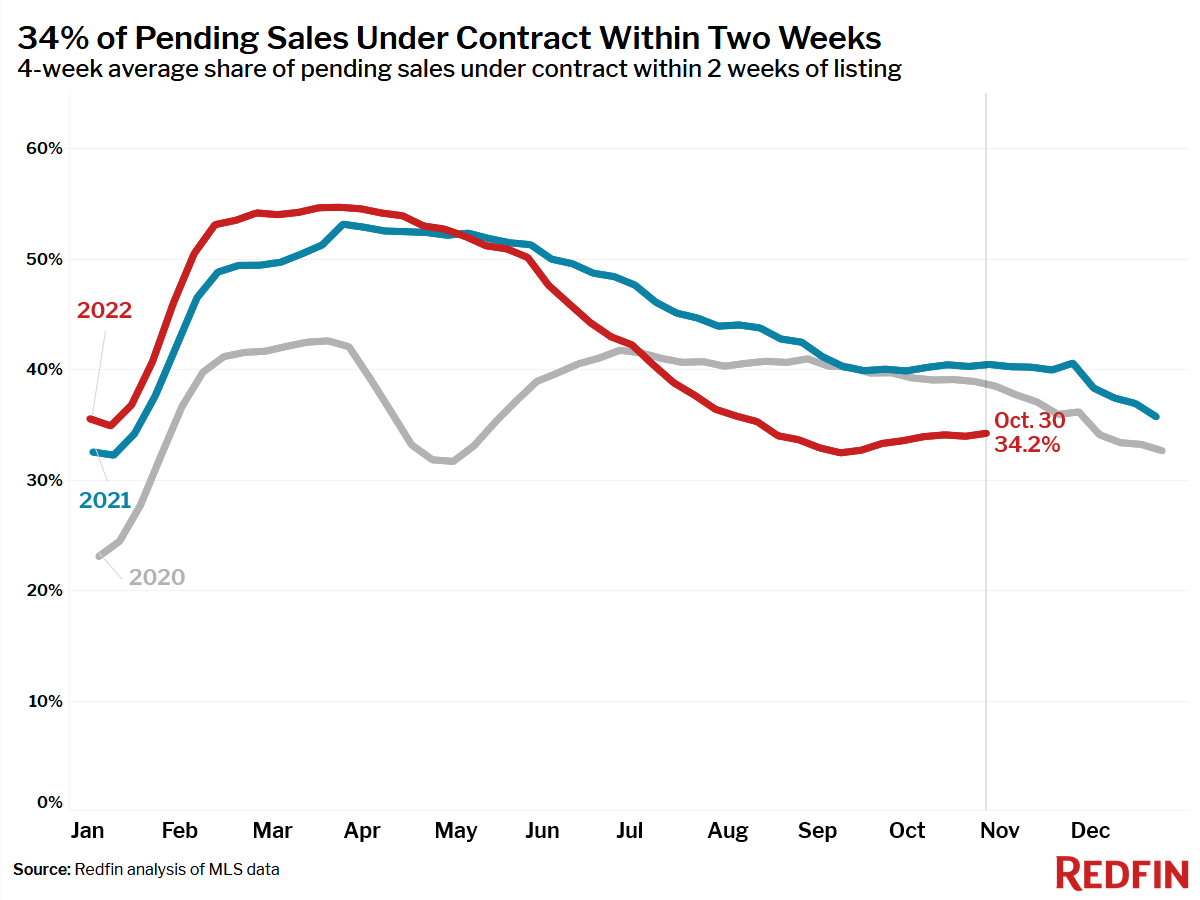
- 34% of homes that went under contract had an accepted offer within the first two weeks on the market, little changed from the prior four-week period but down from 40% a year earlier.
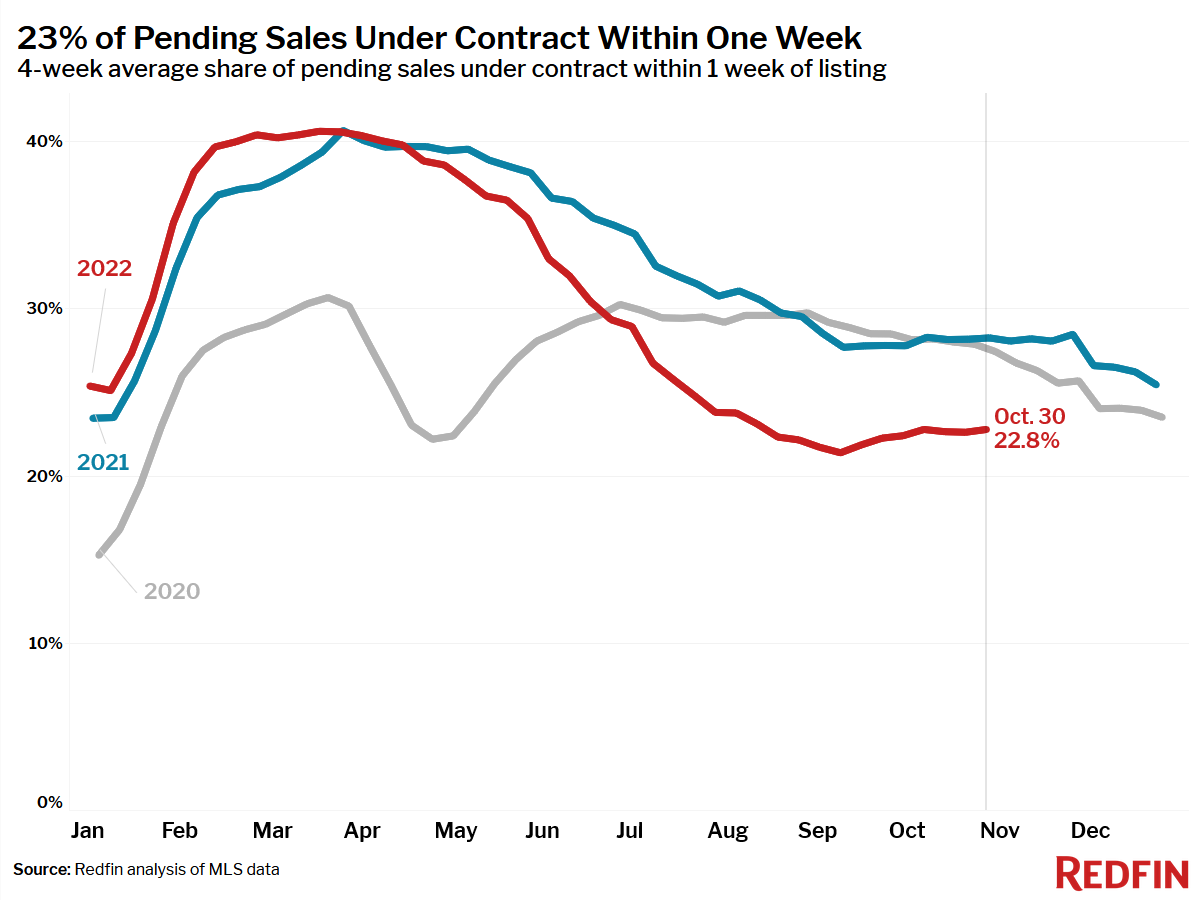
- 23% of homes that went under contract had an accepted offer within one week of hitting the market, little changed from the prior four-week period but down from 28% a year earlier.
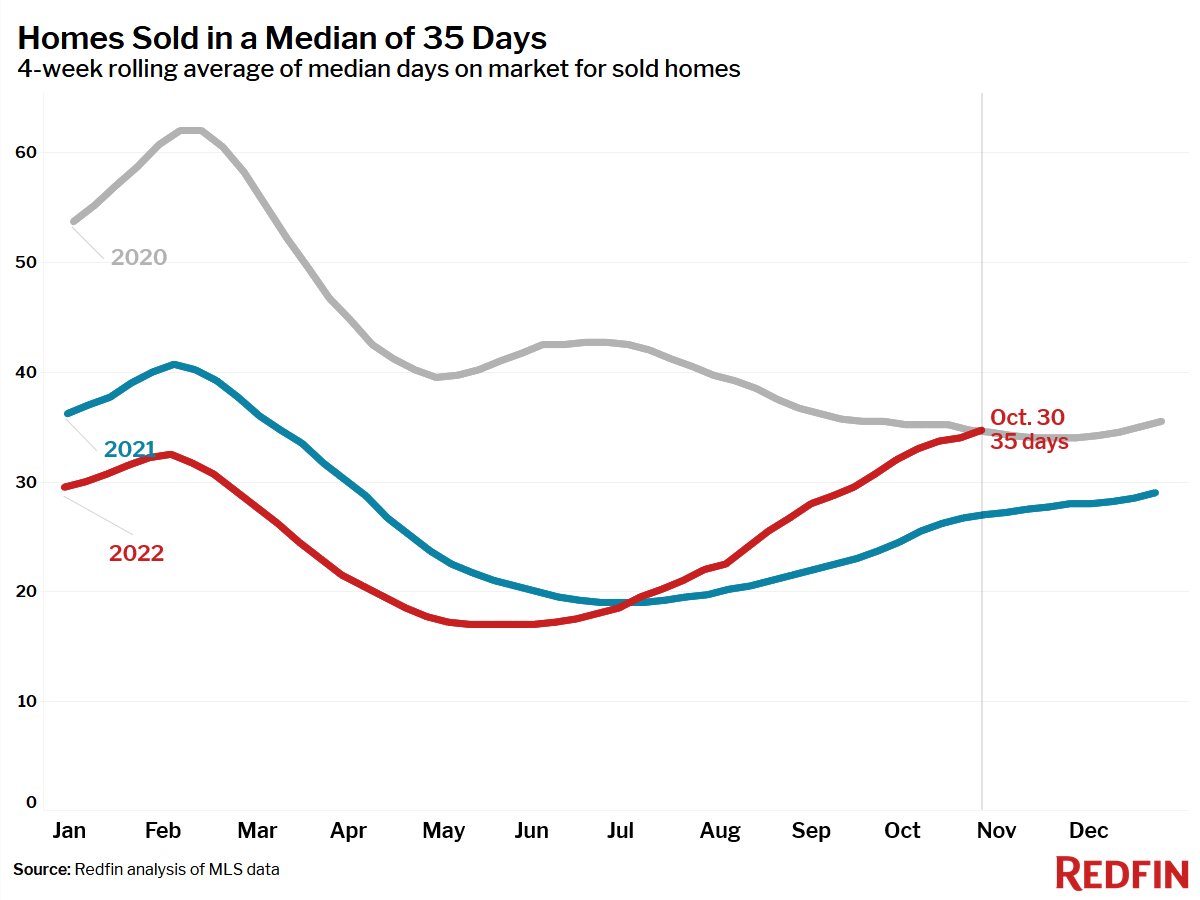
- Homes that sold were on the market for a median of 35 days, up a full week from 27 days a year earlier and up 18 days from the record low of 17 days set in May and early June.
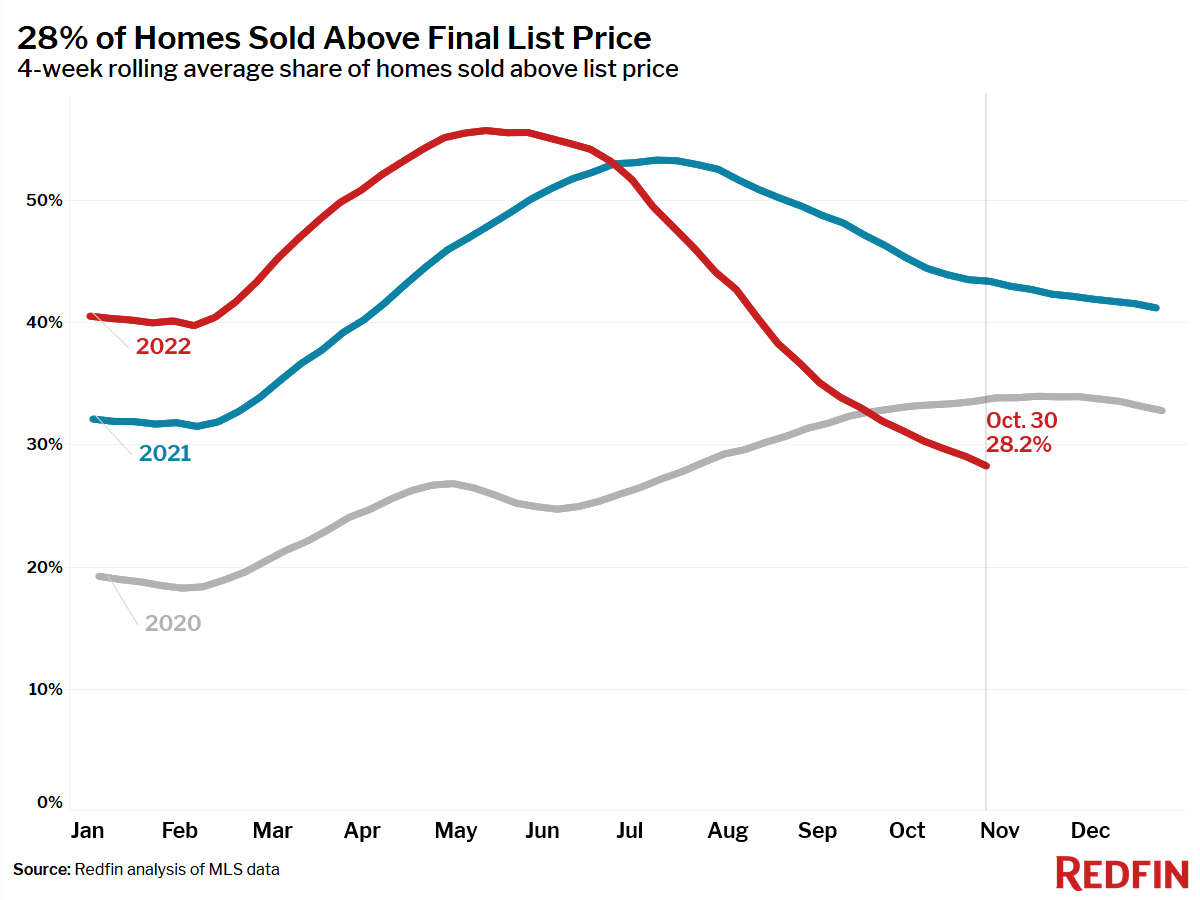
- 28% of homes sold above list price, down from 43% a year earlier and the lowest level since July 2020.
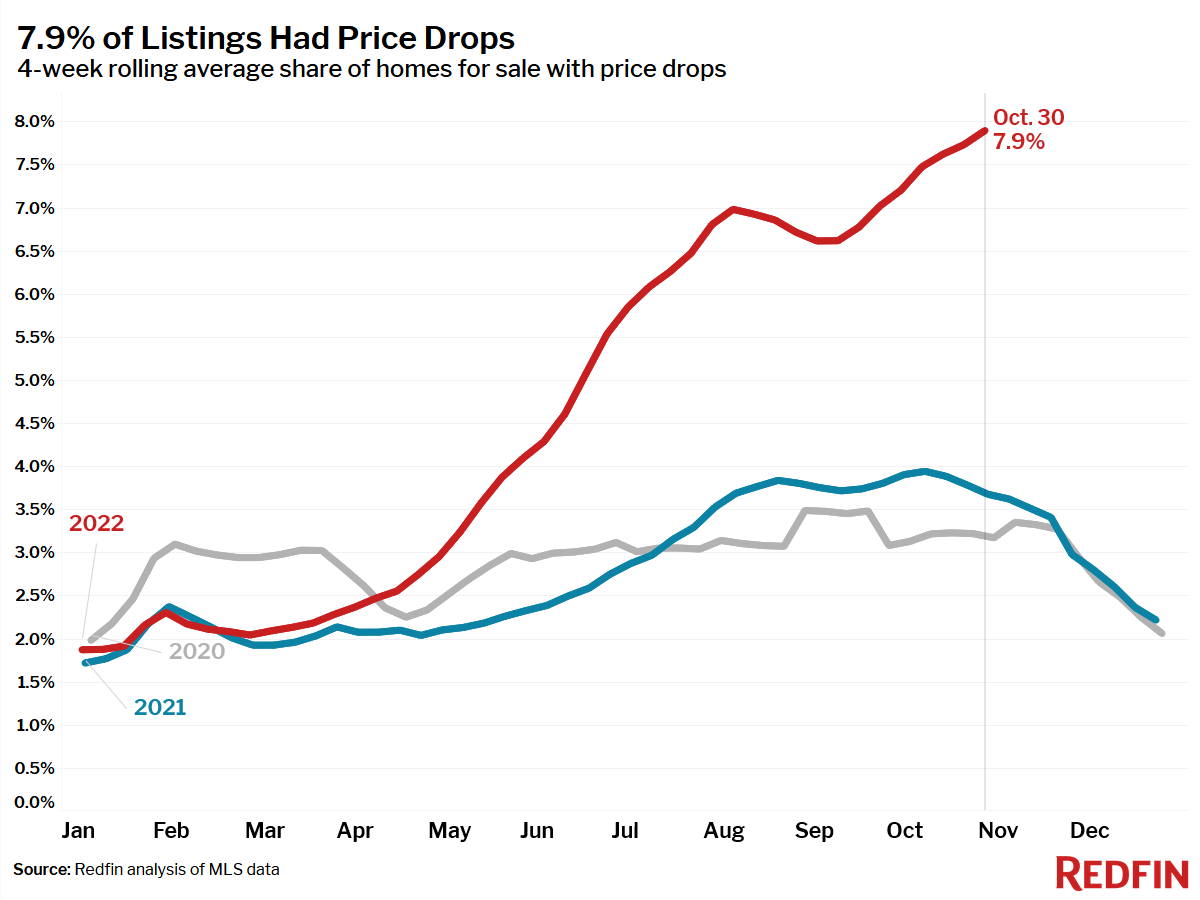
- On average, a record 7.9% of homes for sale each week had a price drop, up from 3.7% a year earlier.
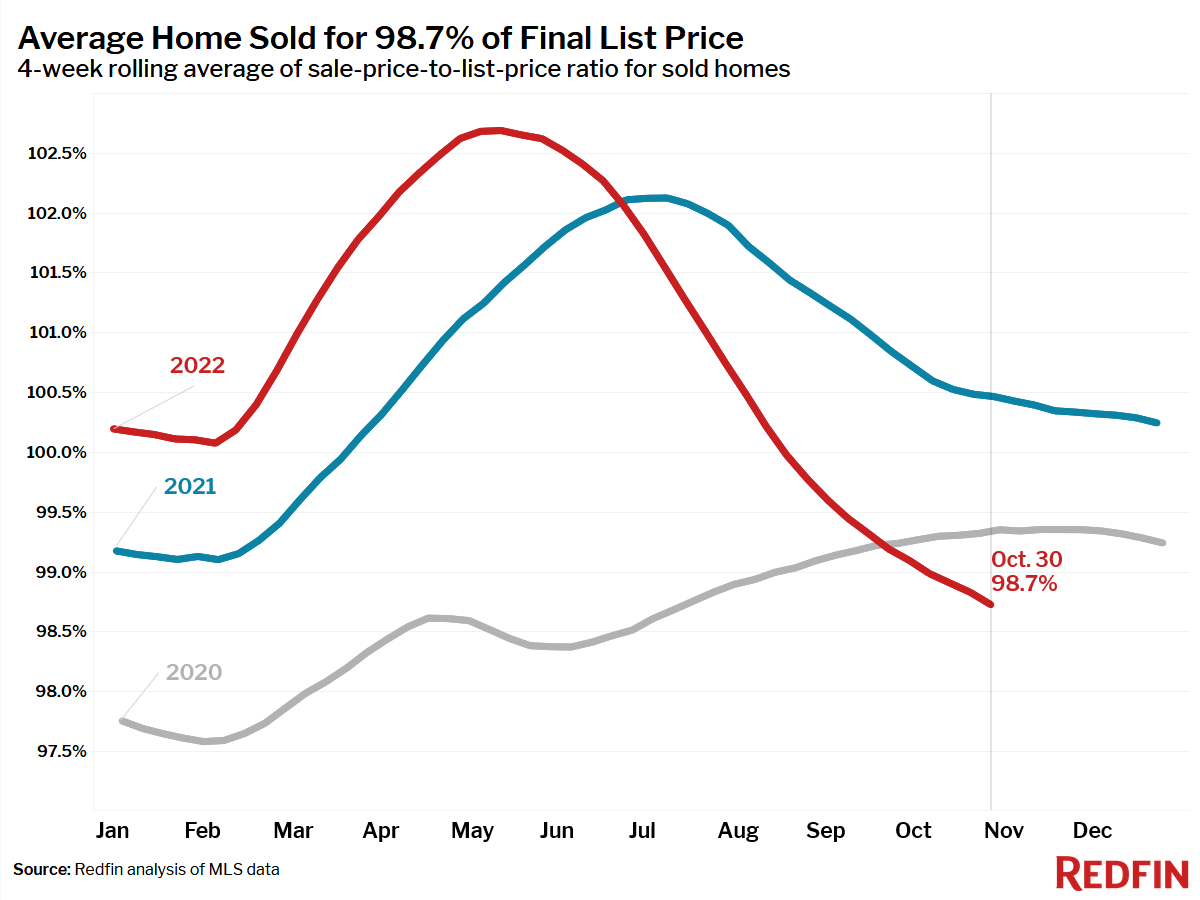
- The average sale-to-list price ratio, which measures how close homes are selling to their final asking prices, fell to 98.7% from 100.5% a year earlier. This was the lowest level since July 2020.
Refer to our metrics definition page for explanations of all the metrics used in this report.