Declining mortgage rates and a double-digit increase in new listings are bringing house hunters off the sidelines, with pending sales posting their smallest decline in about 20 months.
We’re taking a break from analysis this week, but please see the tables and charts below for this week’s housing-market data. We’ll be back with full commentary in next week’s report. Happy holidays!
Leading indicators
| Indicators of homebuying demand and activity | ||||
| Value (if applicable) | Recent change | Year-over-year change | Source | |
| Daily average 30-year fixed mortgage rate | 6.61% (Dec. 27) | Lowest level since May | Up slightly from 6.50% | Mortgage News Daily |
| Weekly average 30-year fixed mortgage rate | 6.67% (week ending Dec. 21) | Lowest level since June | Up from 6.27% | Freddie Mac |
| Mortgage-purchase applications (seasonally adjusted) | Down 1% from a week earlier; up 7% from a month earlier (as of week ending Dec. 15, the most recent week for which data is available) | Down 18% | Mortgage Bankers Association | |
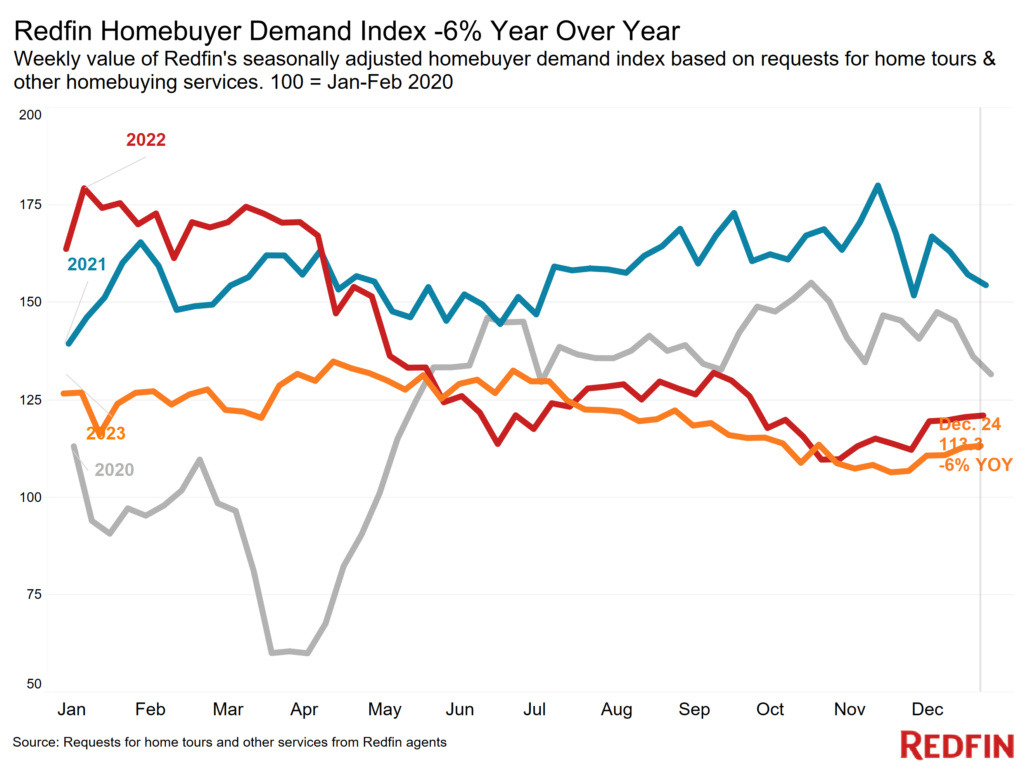
| Redfin Homebuyer Demand Index (seasonally adjusted) | Up 6% from a month earlier (as of the week ending Dec. 24) | Down 6% | Redfin Homebuyer Demand Index, a measure of requests for tours and other homebuying services from Redfin agents | |
| Google searches for “home for sale” | Up 8% from a month earlier (as of Dec. 23) | Unchanged | Google Trends | |
Key housing-market data
| U.S. highlights: Four weeks ending December 24, 2023
Redfin’s national metrics include data from 400+ U.S. metro areas, and is based on homes listed and/or sold during the period. Weekly housing-market data goes back through 2015. Subject to revision. |
|||
| Four weeks ending December 24, 2023 | Year-over-year change | Notes | |
| Median sale price | $364,250 | 4.5% | Biggest increase since Oct. 2022. Prices are up partly because rapidly rising mortgage rates were hampering prices during this time last year |
| Median asking price | $363,484 | 5.1% | |
| Median monthly mortgage payment | $2,401 at a 6.67% mortgage rate | 7.3% | Down $334 (-12.2%) from all-time high set during the four weeks ending Oct. 22. Lowest level since February. |
| Pending sales | 57,600 | -4% | Smallest decline since March 2022 |
| New listings | 53,243 | 12.2% | Biggest uptick since June 2021. The increase is partly because new listings were falling at this time last year. |
| Active listings | 817,863 | -3.8% | Smallest decline since June |
| Months of supply | 3.6 months | +0.2 pts. | 4 to 5 months of supply is considered balanced, with a lower number indicating seller’s market conditions. |
| Share of homes off market in two weeks | 27.4% | Up from 25% | |
| Median days on market | 39 | -2 days | |
| Share of homes sold above list price | 25% | Up from 23% | |
| Share of homes with a price drop | 5% | +0.8 pts. | |
| Average sale-to-list price ratio | 98.5% | +0.5 pts. | |
| Metro-level highlights: Four weeks ending December 24, 2023
Redfin’s metro-level data includes the 50 most populous U.S. metros. Select metros may be excluded from time to time to ensure data accuracy. |
|||
| Metros with biggest year-over-year increases | Metros with biggest year-over-year decreases | Notes | |
| Median sale price | Anaheim, CA (18.2%)
Newark, NJ (17%) Fort Lauderdale, FL (13.6%) West Palm Beach, FL (13.2%) Miami (12.6%) |
Austin, TX (-4%)
Fort Worth, TX (-2.2%) San Francisco (-1.1%) |
Declined in 3 metros |
| Pending sales | Dallas (8.5%)
Milwaukee (8.4%) Austin (5.1%) Orlando, FL (5%) Fort Worth, TX (4.6%) |
Providence, RI (-15.2%)
Virginia Beach, VA (-10.6%) Jacksonville, FL (-10.2%) West Palm Beach (-10.2%) Tampa, FL (-9.6%) |
Increased in 14 metros |
| New listings | Phoenix (31.5%)
San Antonio (25.6%) Dallas (21.4%) Washington, D.C. (20.6%) Montgomery County, PA (19.6%) |
San Francisco (-25.7%)
Indianapolis, IN (-12.8%) Atlanta (-11.5%) Warren, MI (-6.4%) Newark (-3.9%) |
Declined in 10 metros |
Refer to our metrics definition page for explanations of all the metrics used in this report.