A record 57% of homes sold in two weeks and the typical monthly mortgage payment soared to a new high, approaching $2,000.
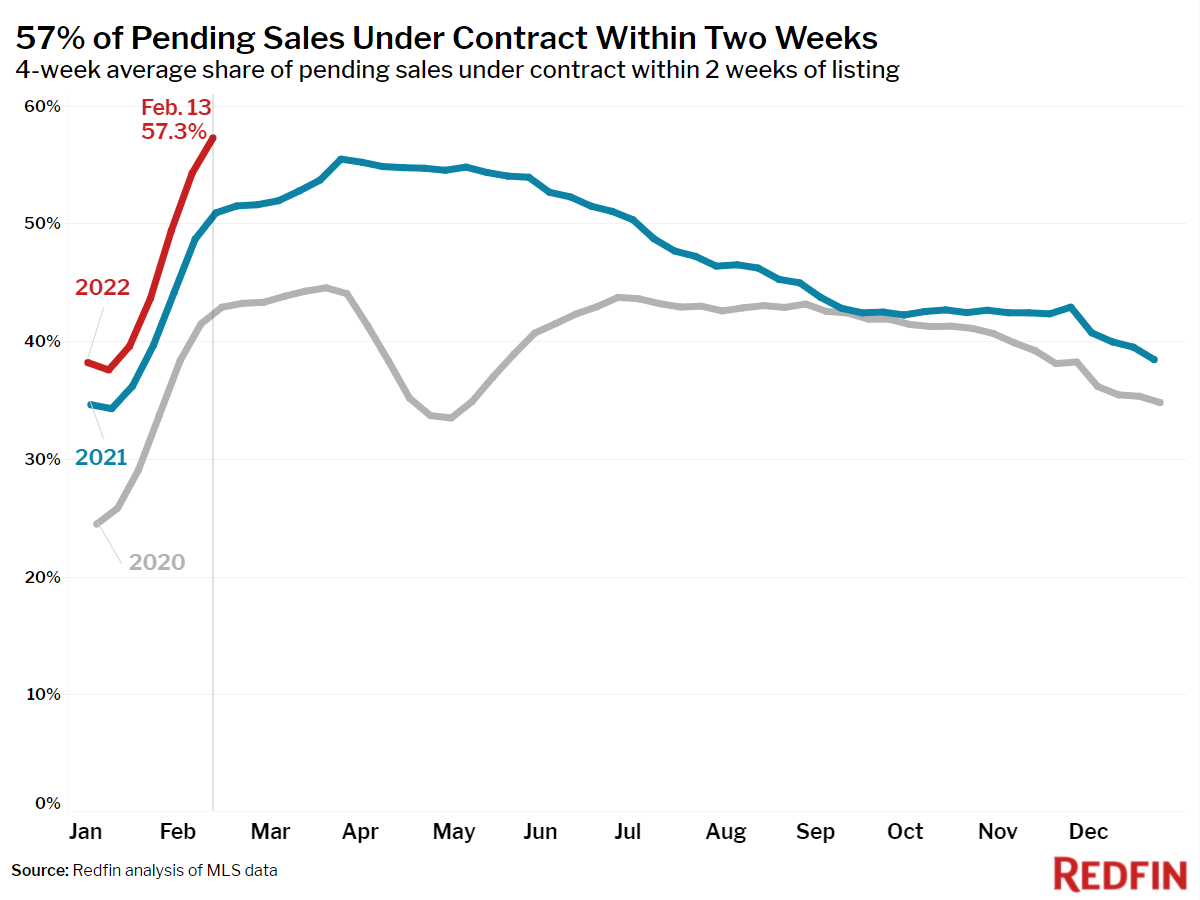
Homes sold faster than ever during the four weeks ending February 13, as a record 57% of homes that went under contract did so within two weeks of being listed. People buying homes now are paying more than ever before, too—a median $1,997 per month—as asking prices soared 16% year over year to a new high and mortgage rates shot up to their highest level since May 2019.
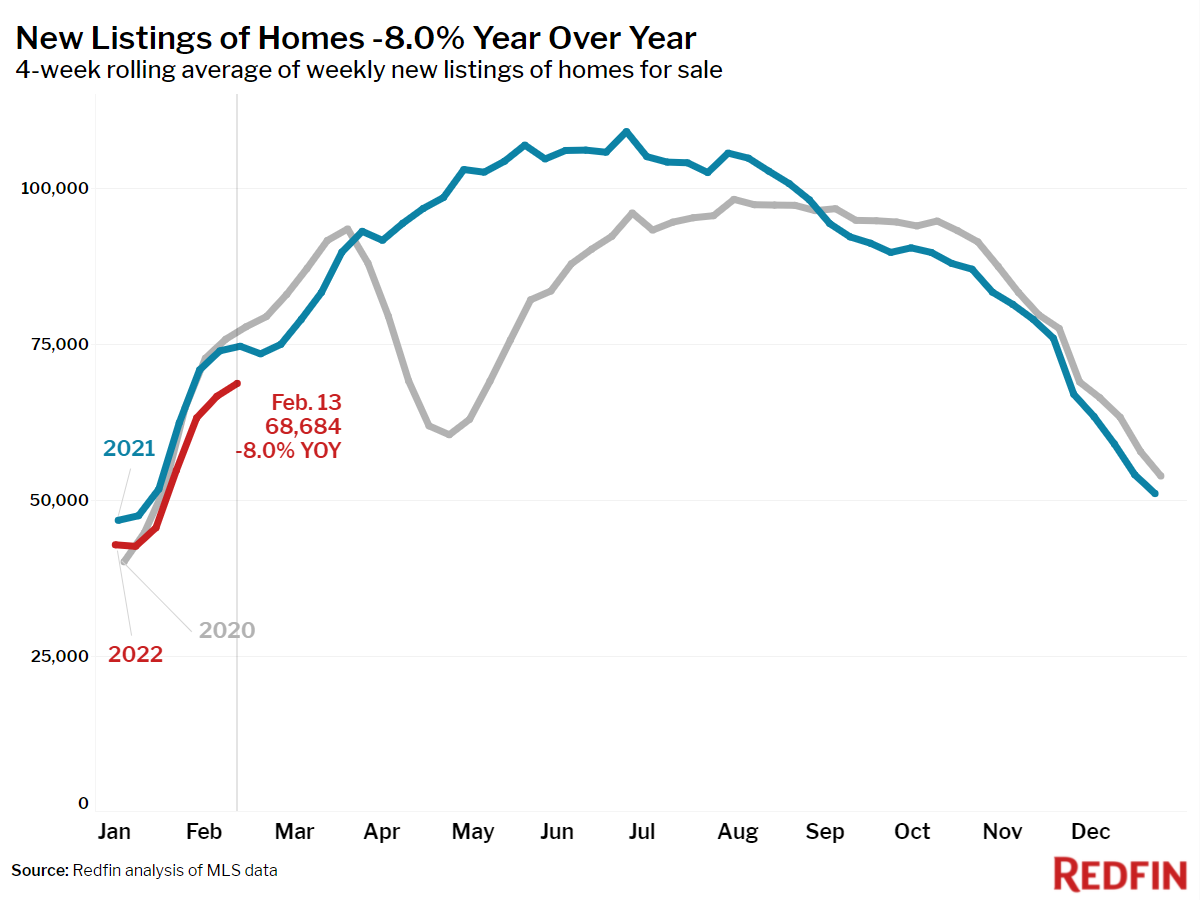
The pace and cost of homebuying are soaring largely because there is so little to buy. New listings fell 8% year over year, sending overall supply to a new low and putting a damper on pending sales, which fell 2.7%. “The acute shortage of new listings of homes for sale is the biggest problem the housing market faces right now,” said Redfin Deputy Chief Economist Taylor Marr. “If you think of the housing market like a bathtub, water (supply of homes for sale) is flowing down the drain (buyers sucking up supply) faster than new water (new listings) is coming in through the faucet. Rising mortgage rates may slow the drain down a bit (cool demand) as record-high monthly payments take a toll on buyers’ budgets. Bottom line: without a flood of new listings we will be sitting in a very shallow bath for a while.”
Key housing market takeaways for 400+ U.S. metro areas:
Unless otherwise noted, the data in this report covers the four-week period ending February 13. Redfin’s housing market data goes back through 2012.
Data based on homes listed and/or sold during the period:
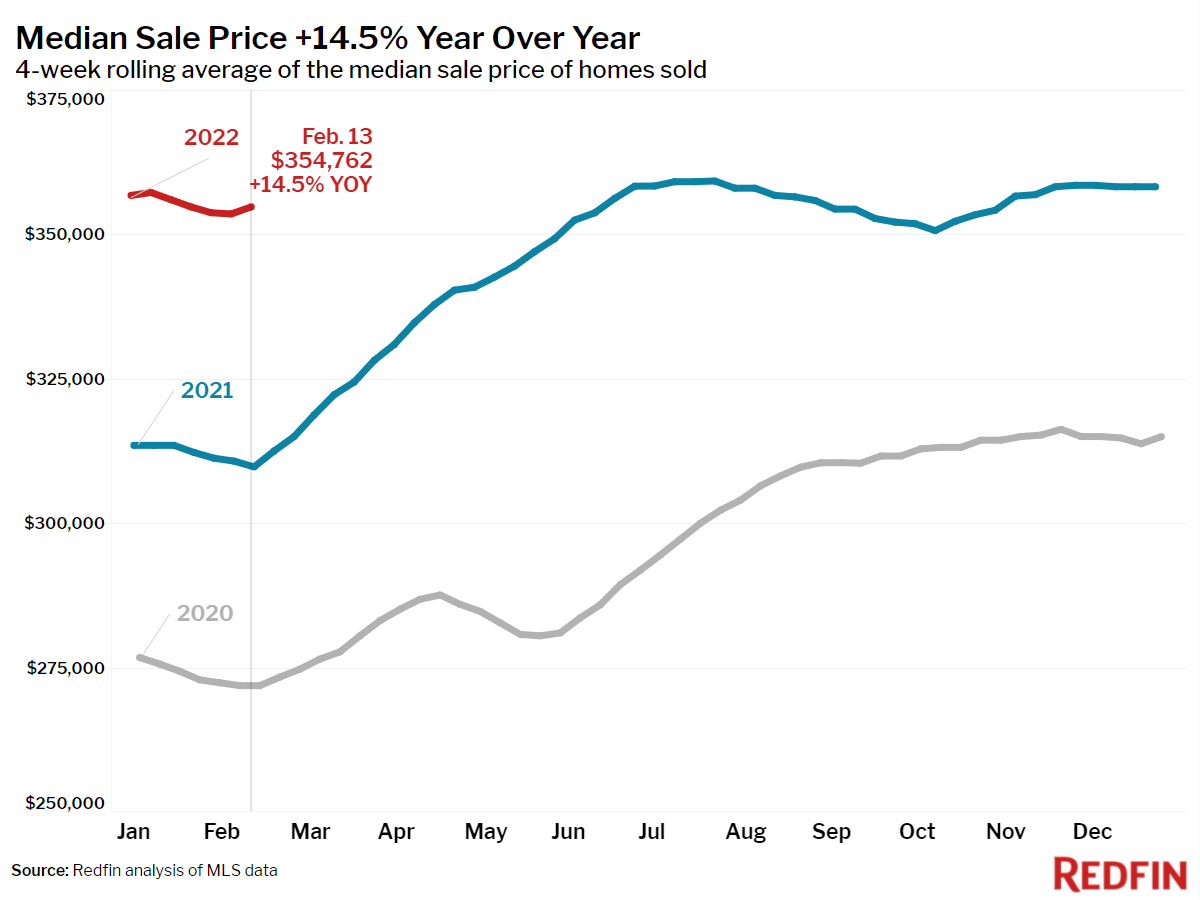
- The median home sale price was up 15% year over year to $354,762. This was up 30% from the same time in 2020.
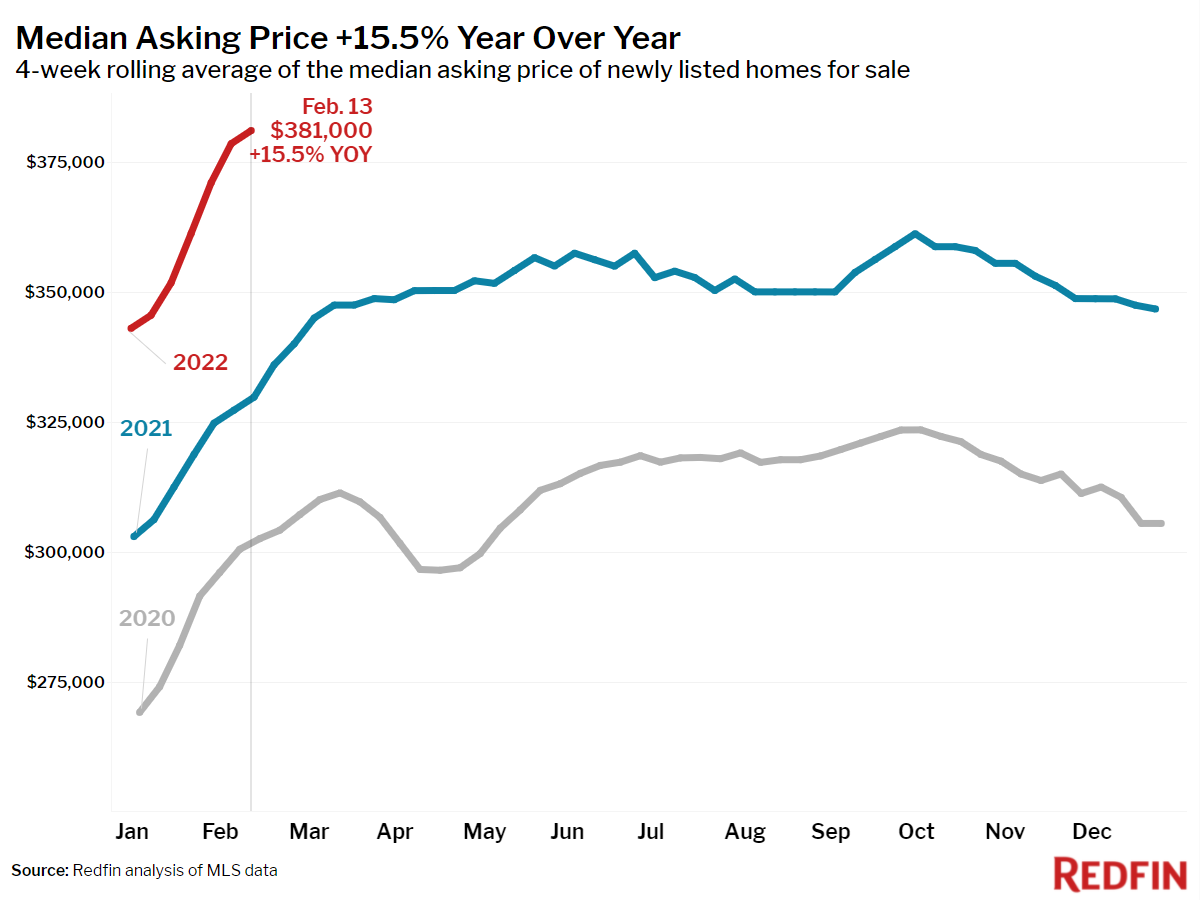
- The median asking price of newly listed homes increased 16% year over year to an all-time high of $381,000. This was up 26% from the same time in 2020.
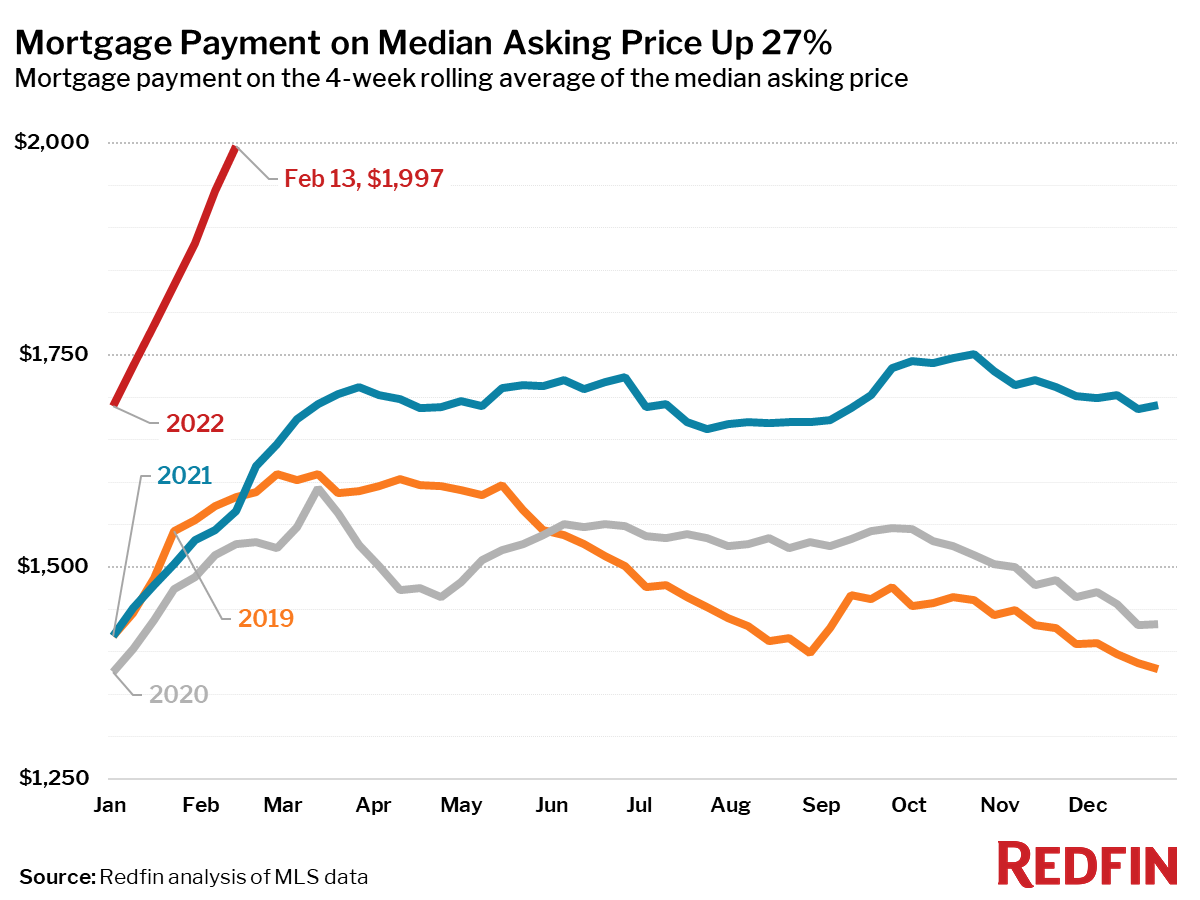
- The monthly mortgage payment on the median asking price rose to an all-time high of $1,997. This was up 27% from a year earlier when mortgage rates were 2.73%, and was up 31% from the same period in 2020 when rates were 3.47%.
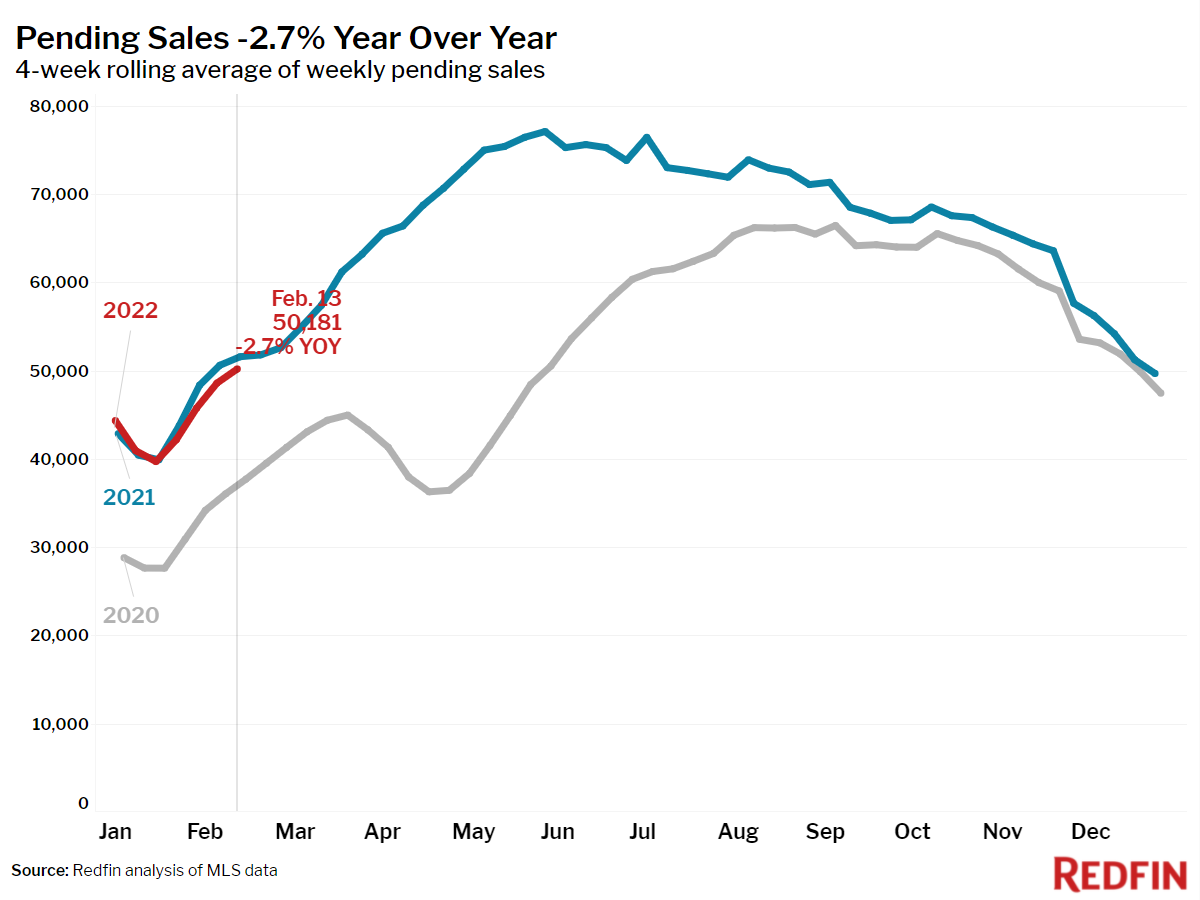
- Pending home sales were down 2.7% year over year, but were up 35% from the same period in 2020, just prior to the start of the pandemic.
- New listings of homes for sale were down 8% from a year earlier. Compared to 2020, new listings were down 12%.
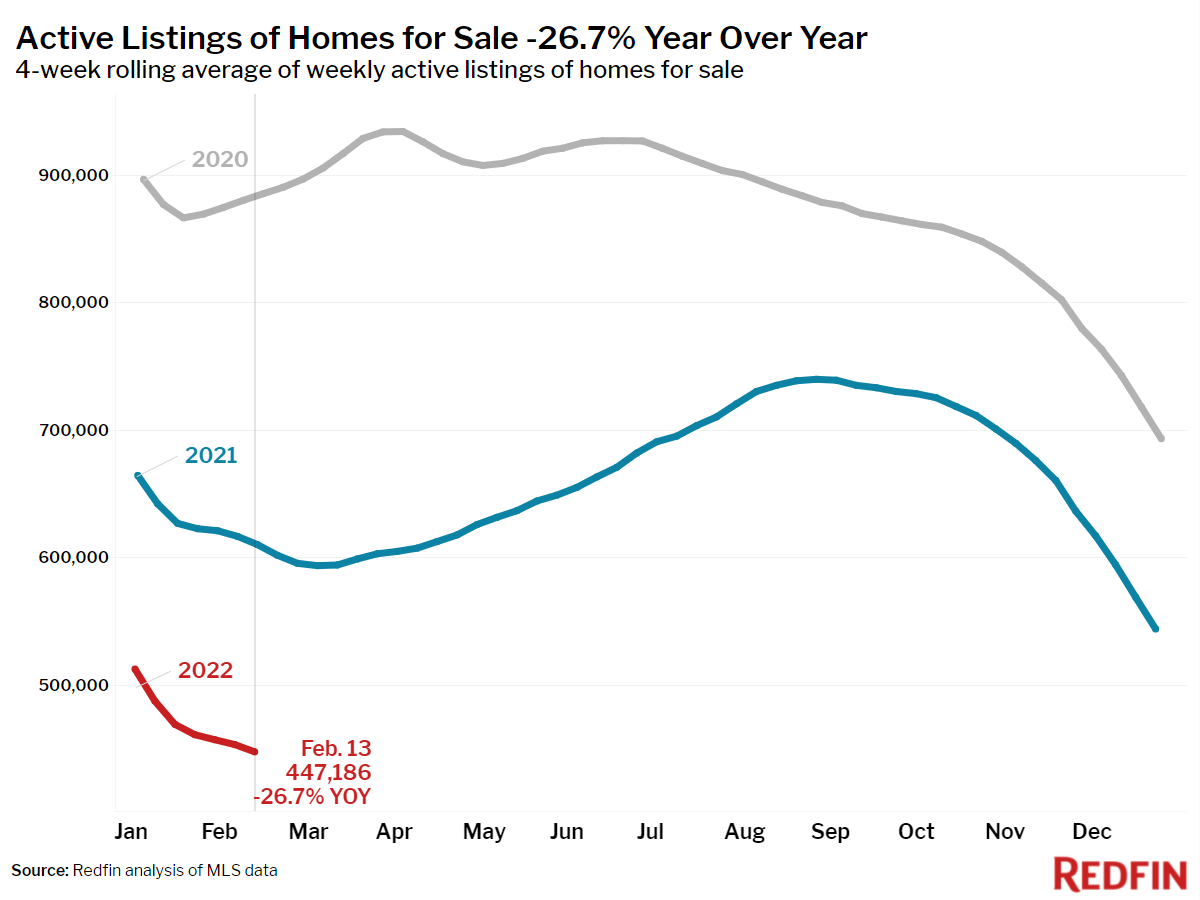
- Active listings (the number of homes listed for sale at any point during the period) fell 27% year over year, dropping to an all-time low of 447,000. Listings were down 49% from the same period in 2020.
- 57% of homes that went under contract had an accepted offer within the first two weeks on the market, an all-time high. This was up from the 51% rate of a year earlier and 43% in 2020.
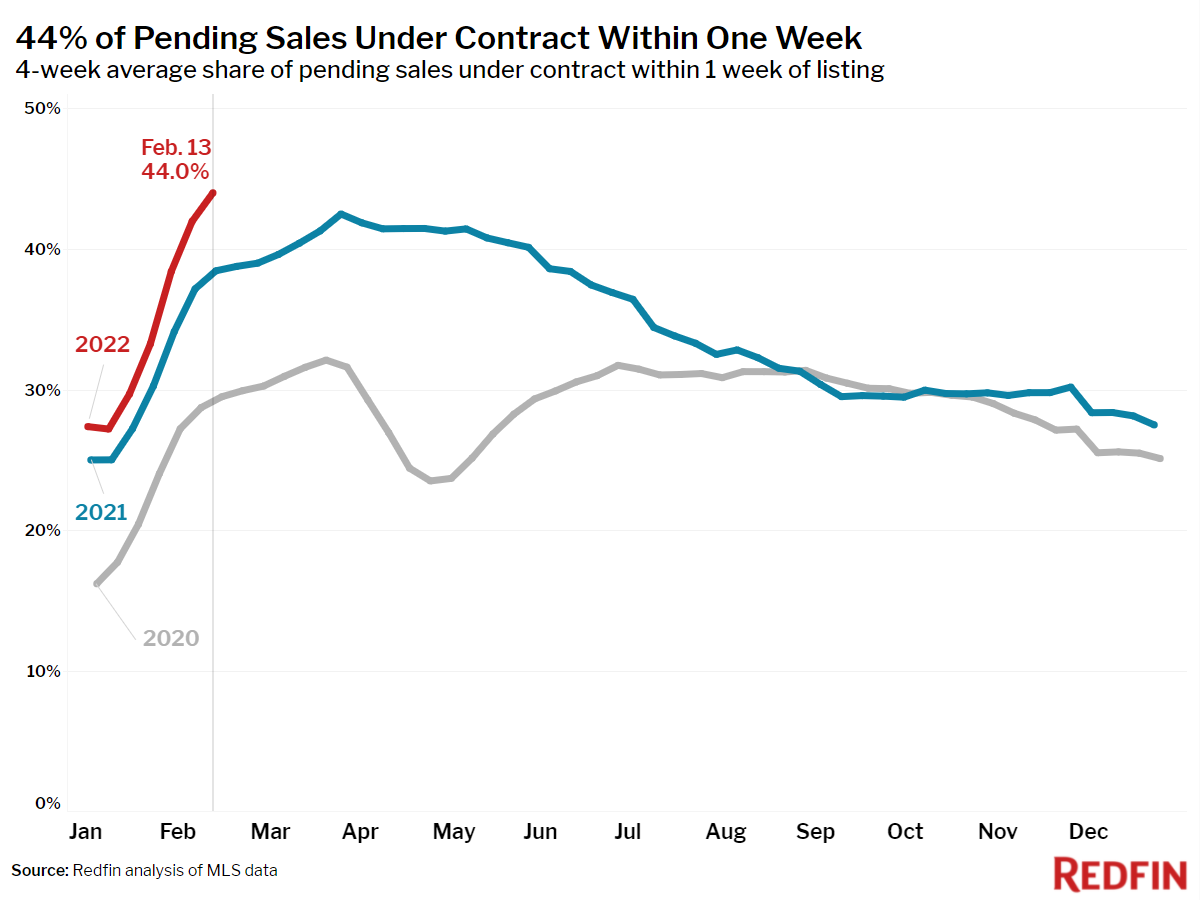
- 44% of homes that went under contract had an accepted offer within one week of hitting the market, an all-time high. This was up from 38% during the same period a year earlier and 29% in 2020.
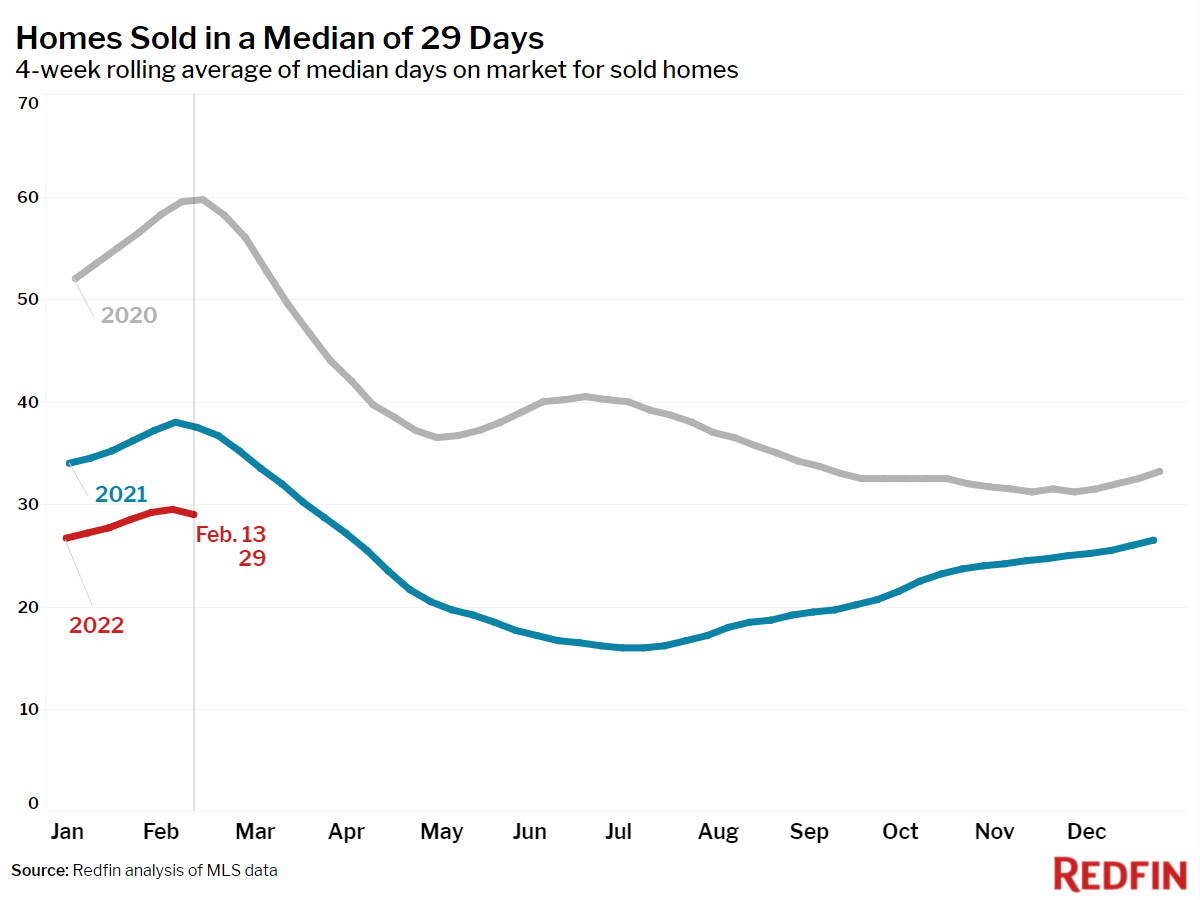
- Homes that sold were on the market for a median of 29 days, down from 38 days a year earlier and 60 days in 2020.
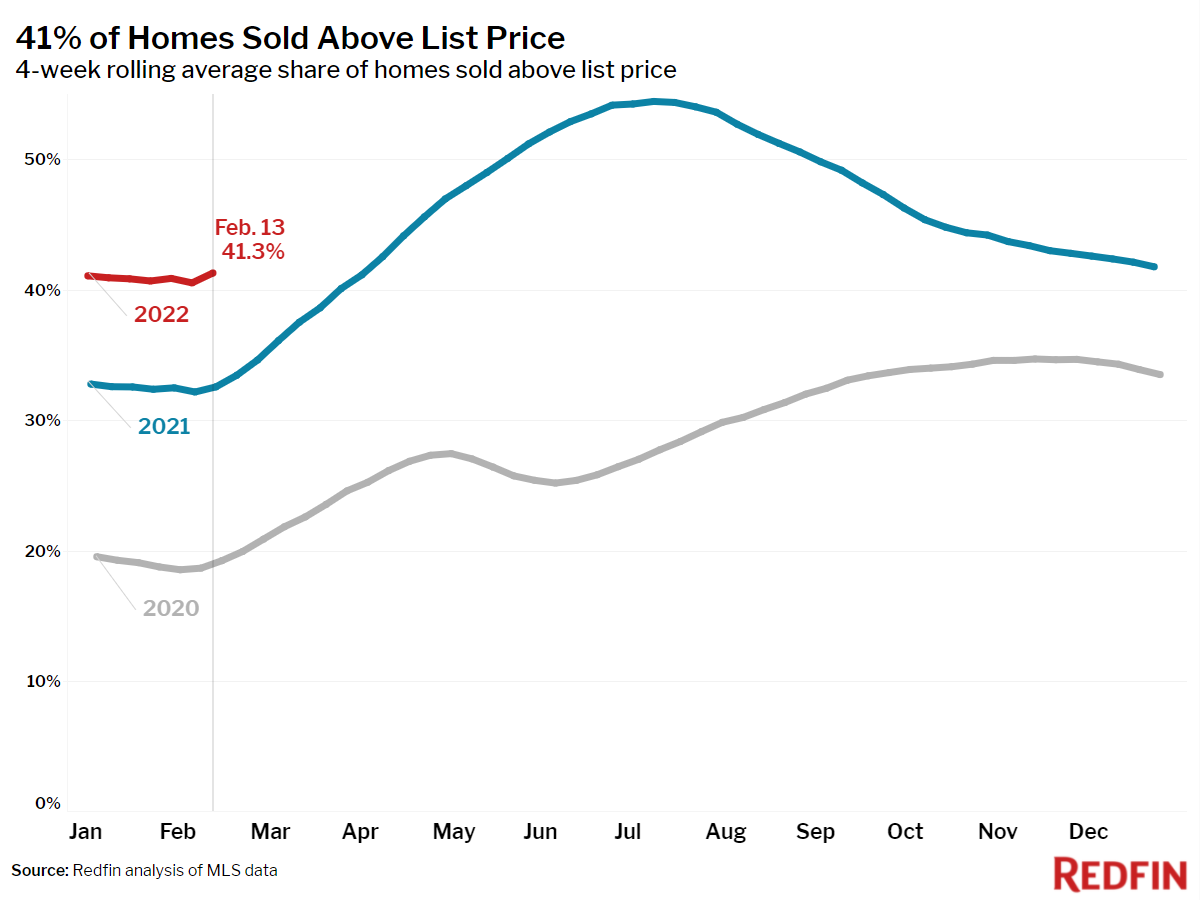
- 41% of homes sold above list price, up from 33% a year earlier and 19% in 2020.
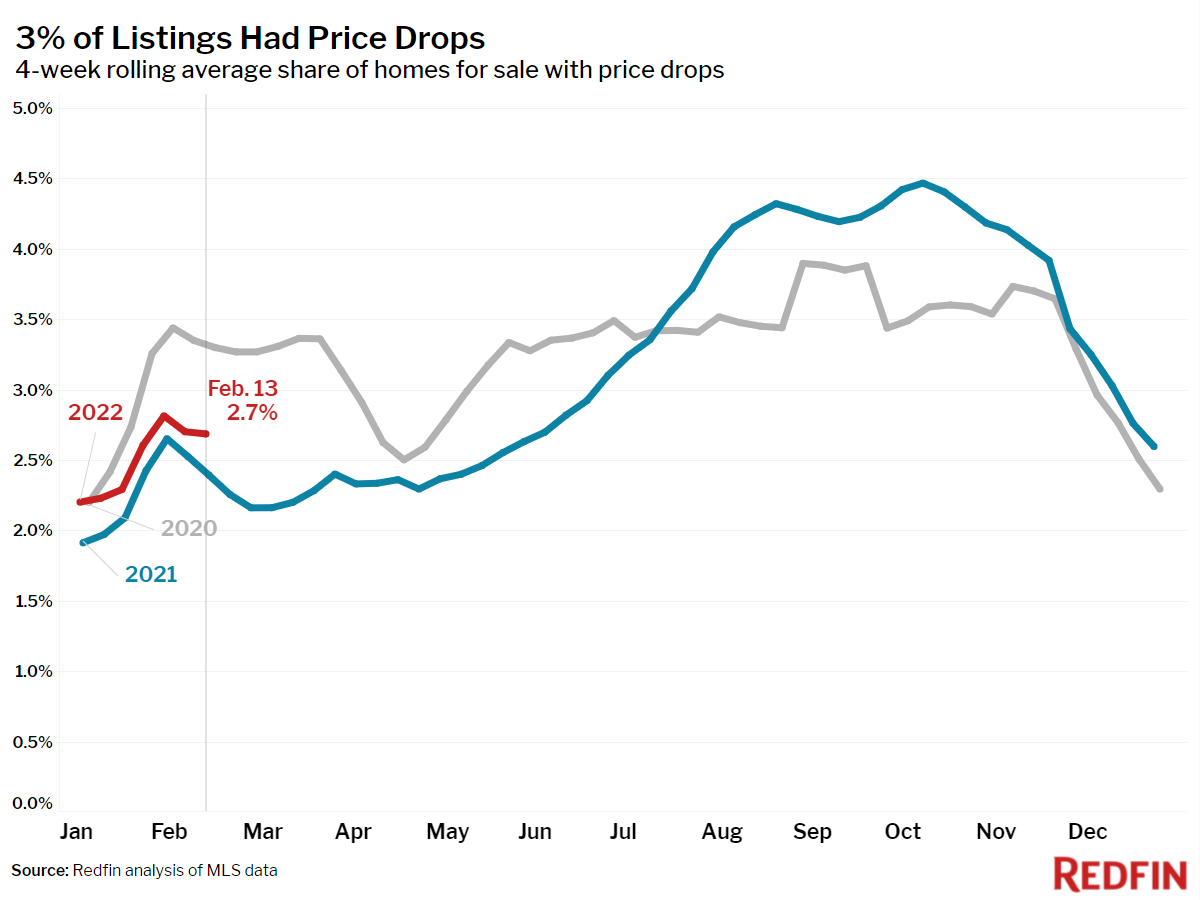
- On average, 2.7% of homes for sale each week had a price drop, up 0.4 percentage points from the same time in 2021, but down 0.6 percentage points from 2020.
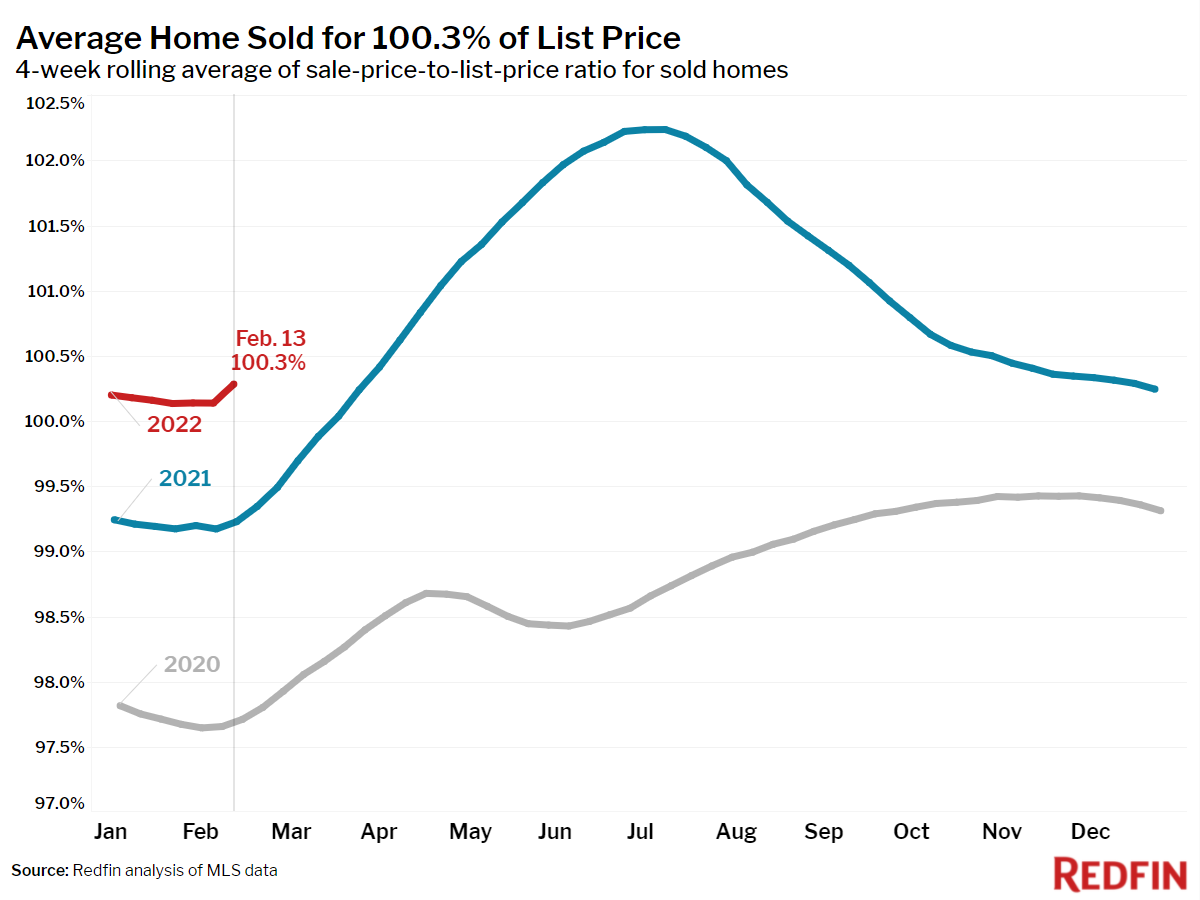
- The average sale-to-list price ratio, which measures how close homes are selling to their asking prices, rose to 100.3%. In other words, the average home sold for 0.3% above its asking price.
Other leading indicators of homebuying activity:
- Mortgage purchase applications decreased 1% week over week (seasonally adjusted) during the week ending February 11. For the week ending February 17, 30-year mortgage rates rose to 3.92%, the highest level since May 2019.
- Touring activity through February 13 was 4 percentage points ahead of 2021 and 4 points behind 2020 relative to the first week of January according to home tour technology company ShowingTime.
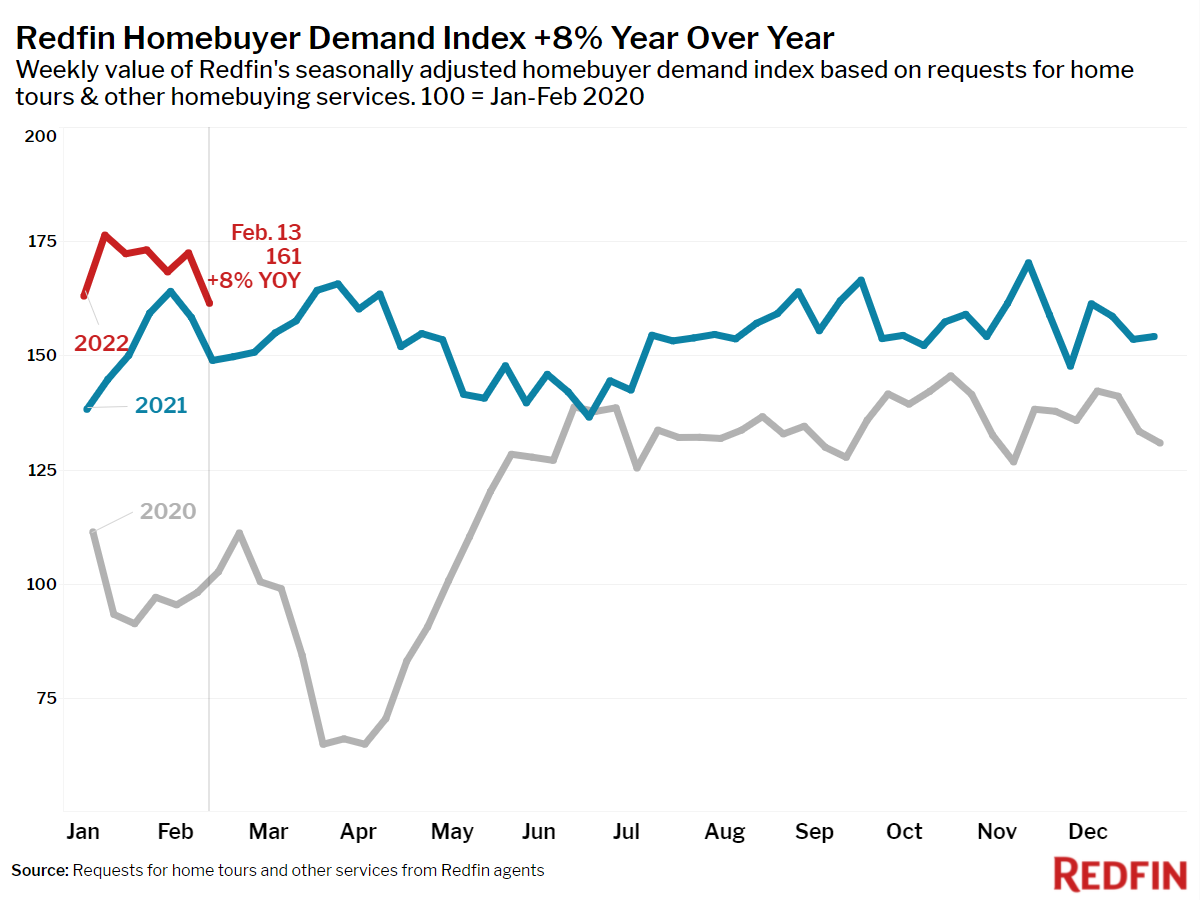
- The Redfin Homebuyer Demand Index fell 6% during the week ending February 13 and was up 8% from a year earlier. The seasonally adjusted Redfin Homebuyer Demand Index is a measure of requests for home tours and other home-buying services from Redfin agents.
Refer to our metrics definition page for explanations of all the metrics used in this report.