The housing market is gaining slight momentum as the summer winds down, but demand remains subdued overall.
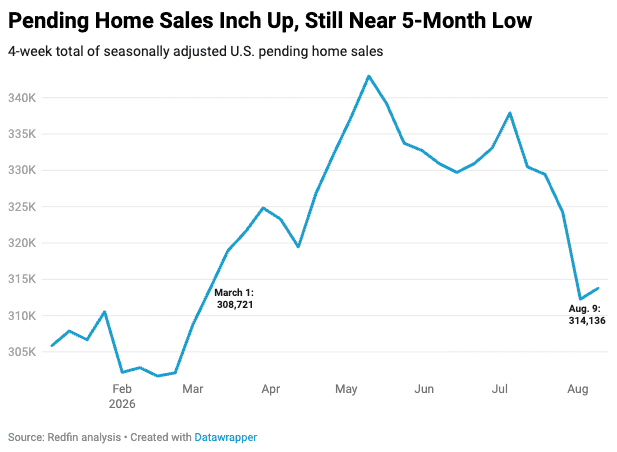
U.S. pending home sales edged up 0.4% week over week during the four weeks ending August 9 on a seasonally adjusted basis, offering a small boost to this summer’s sluggish housing market. Mortgage-purchase applications rose 3% week over week.
Pending sales are still at their second-lowest level since March, and the latest weekly uptick may reflect normal week-to-week changes rather than a meaningful shift in momentum. On a year-over-year basis, pending sales are down 1.6%.
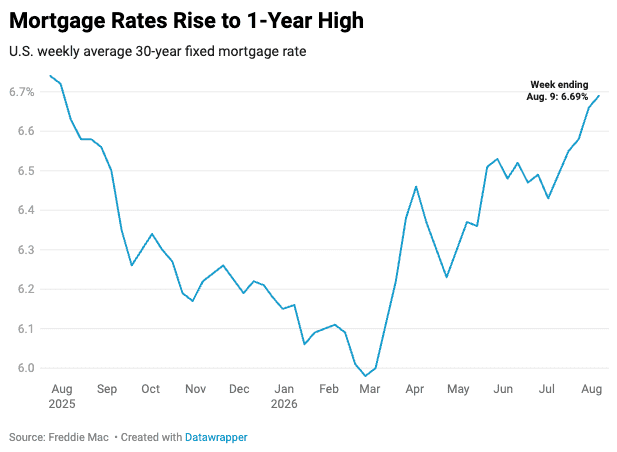
Many would-be homebuyers are still on the sidelines, largely because mortgage rates are high: The weekly average mortgage rate is 6.69%, its highest level in over a year, pushing the median monthly housing payment up 1.7% year over year to $2,626. Some house hunters are also turned off by the topsy turvy economy.
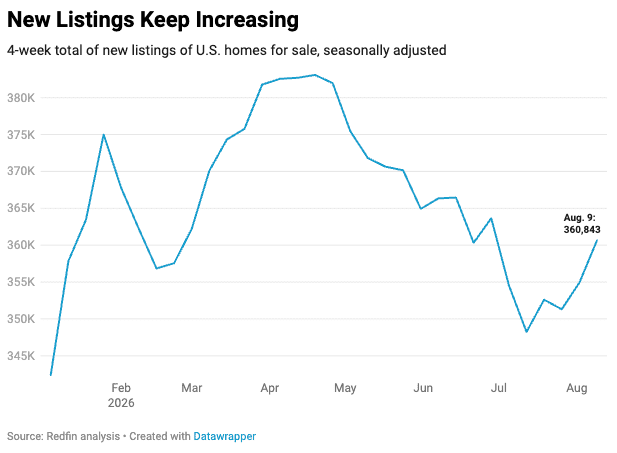
The selling side gained a bit more steam, with new listings jumping 1.7% from a week earlier–the biggest gain in five months. The increase in new listings, along with many homes for sale lingering on the market, pushed the total number of listings up 0.7% week over week. The uptick in listings gives buyers in much of the country more negotiating power.
“Buyers should know that this isn’t 2021 and 2022; the sellers’ list price is a starting point for negotiations,” said Sheryl Wingate, a Redfin Premier agent in the greater Seattle area. “Some sellers are flexible, and their biggest priority is selling their home quickly: If a buyer loves a home, they should make an offer they’re comfortable with, ask for the concessions they want, and open negotiations. More often than not, they can get a deal done.”
Wingate also noted that even in a slow market, some homes are competitive. Clean, turnkey, relatively affordable homes tend to sell quickly, and luxury homes are attracting buyers who are less sensitive to mortgage rates and economic conditions.
For Redfin economists’ takes on the housing market, please visit Redfin’s “From Our Economists” page.
Leading indicators
| Indicators of homebuying demand and activity | ||||
| Value (if applicable) | Recent change | Year-over-year change | Source | |
| Daily average 30-year fixed mortgage rate | 6.74% (Aug. 12) | Down from 6.83% a week earlier | Up from 6.57% | Mortgage News Daily |
| Weekly average 30-year fixed mortgage rate | 6.69% (week ending Aug. 9) | Highest level in over a year | Up from 6.63% | Freddie Mac |
| Mortgage-purchase applications (seasonally adjusted) | Up 3% from a week earlier (as of week ending Aug. 7) | Down 1% | Mortgage Bankers Association | |
| Google searches of “homes for sale” | Unchanged from a month earlier (as of Aug. 8) | Down 3% | Google Trends | |
| Touring activity | Up 12% from the start of the year (as of Aug. 8) | At this time last year, it was up 29% from the start of 2025 | ShowingTime | |
Key housing-market data
| U.S. highlights: Four weeks ending Aug. 9, 2026
Redfin’s national metrics include data from 900+ U.S. metro areas and are based on homes listed and/or sold during the period. Weekly housing-market data goes back through 2021. Subject to revision. |
||||
| Four weeks ending Aug. 9, 2026 | Year-over-year change | Week-over-week change (where applicable) | Notes | |
| Median sale price | $403,706 | 2.2% | ||
| Median asking price (seasonally adjusted) | $397,008 | 1.2% | ||
| Median monthly mortgage payment (seasonally adjusted) | $2,626 at a 6.69% mortgage rate | 1.7% | ||
| Pending sales (seasonally adjusted) | 314,136 | -1.6% | 0.4% | Lowest level since March, except the prior week |
| New listings (seasonally adjusted) | 360,843 | 2.2% | 1.7% | Biggest weekly increase since March |
| Active listings (seasonally adjusted) | 1,480,356 | 0.5% | 0.7% | |
| Months of supply | 3.7 | Unchanged | 4 to 5 months of supply is considered balanced, with a lower number indicating seller’s market conditions | |
| Share of homes off market in two weeks | 31.9% | Unchanged | ||
| Median days on market | 42 | Unchanged | ||
| Share of home listings with price drops | 21% | Unchanged | ||
| Share of homes sold above list price | 27.2% | Up from about 26% | ||
| Average sale-to-list price ratio | 98.9% | Up from 98.7% | ||
|
Metro-level highlights: Four weeks ending Aug. 9, 2026 Redfin’s metro-level data includes the 50 most populous U.S. metros. Select metros may be excluded from time to time to ensure data accuracy. |
|||
|---|---|---|---|
| Metros with biggest year-over-year increases | Metros with biggest year-over-year decreases |
Notes |
|
| Median sale price | Newark, NJ (9.9%)
West Palm Beach, FL (9%) San Francisco (7.8%) Chicago (7.7%) St. Louis (7.6%) |
Seattle (-3.8%) San Jose, CA (-3%) Austin, TX (-2.2%) Las Vegas (-1.6%) Dallas (-1.5%) |
|
| Pending sales | West Palm Beach, FL (16.4%)
Cincinnati (6.5%) Pittsburgh (6.3%) Warren, MI (5.4%) Montgomery County, PA (5.1%) |
Seattle (-18.5%)
Houston (-15.9%) San Diego (-11.7%) Denver (-10.5%) Atlanta (-8%) |
|
| New listings | San Jose, CA (16.2%)
St. Louis (13.4%) Virginia Beach, VA (12.5%) Houston (11.5%) Cleveland (10.6%) |
Dallas (-14.6%)
San Antonio (-10.1%) Fort Worth, TX (-9.6%) Atlanta (-9.6%) Miami (-6.8%) |
|
Refer to our metrics definition page for explanations of all the metrics used in this report.