Despite high housing costs and a limited supply of homes for sale, many people are out house hunting.
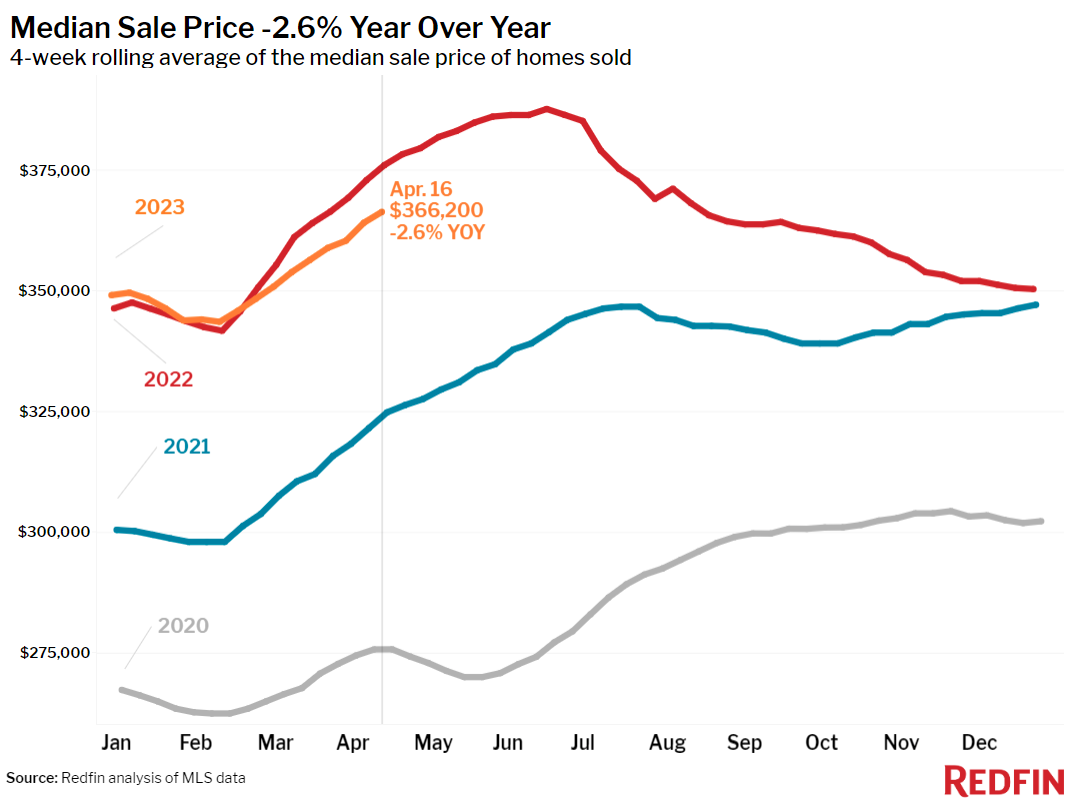
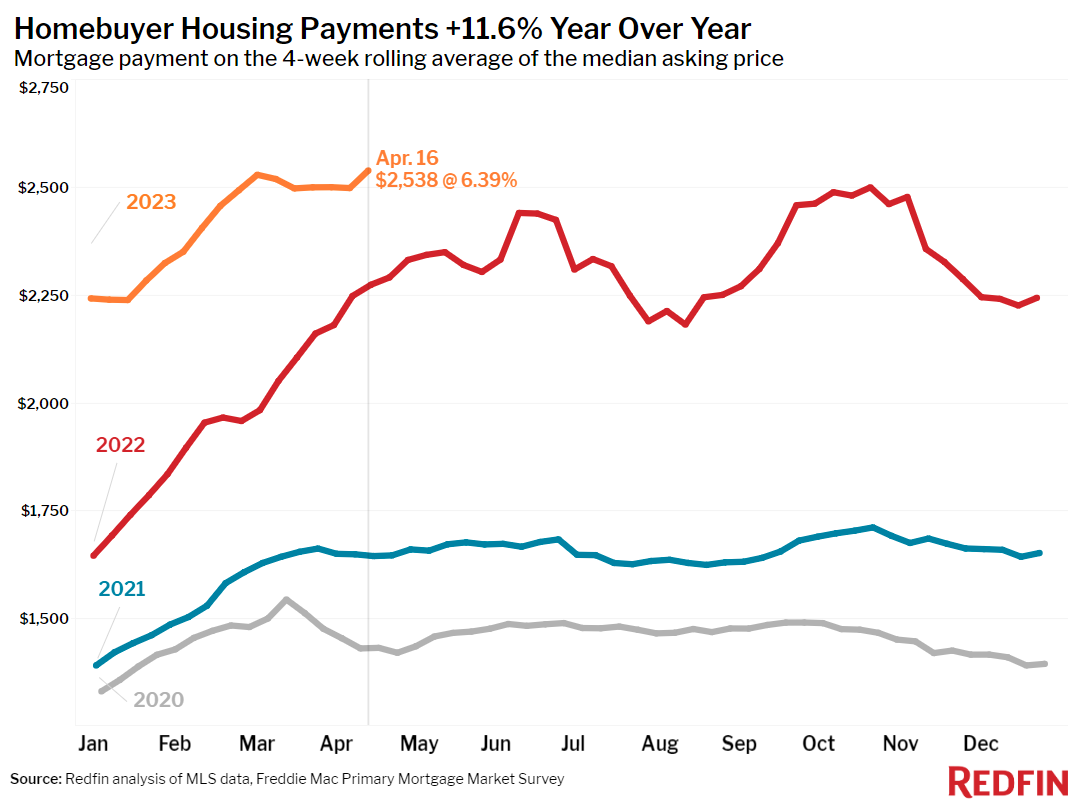
The typical U.S. homebuyer’s monthly housing payment hit an all-time high of $2,538 as average weekly mortgage rates rose to 6.39% after five consecutive weeks of declines. The new high comes in spite of the median home-sale price dropping 2.6% from a year earlier during the four weeks ending April 16, the biggest decline in over a decade.
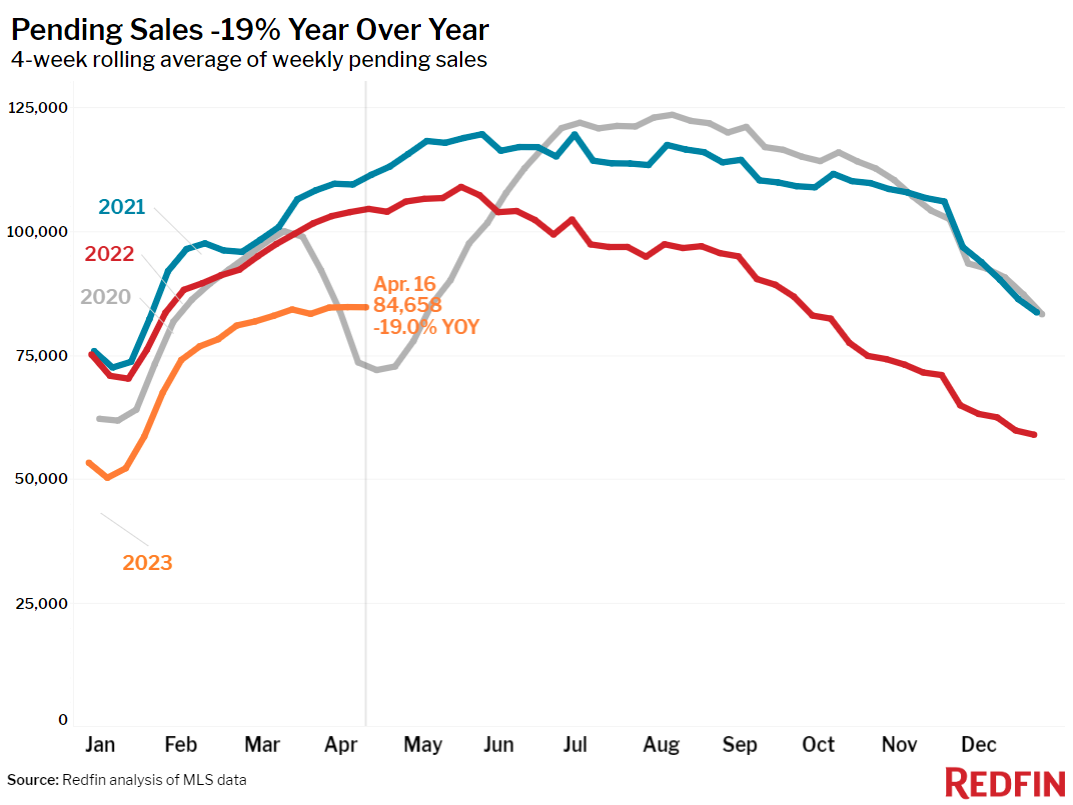
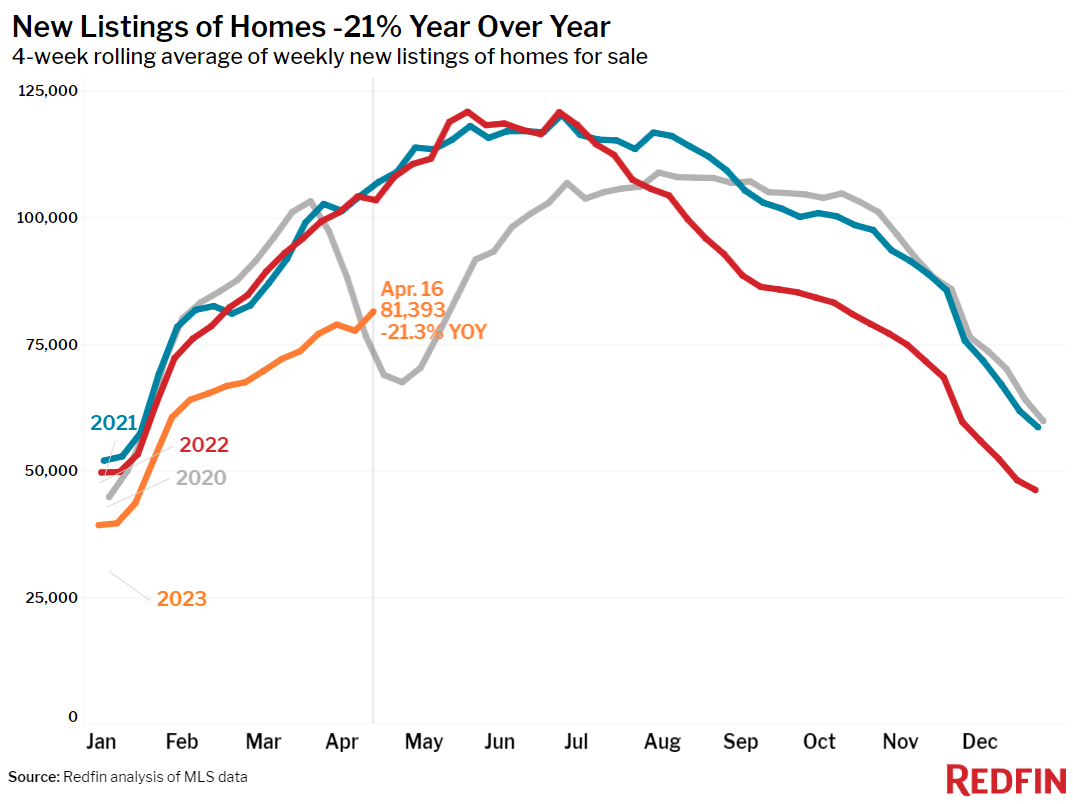
Elevated housing costs are one reason would-be homebuyers are backing off: Pending home sales are down 19% from a year ago, the biggest drop in nearly three months, and mortgage-purchase applications declined 10% over the last week. Buyers are also limited by the shortage of homes for sale, with new listings down 21% as homeowners stay put to hang onto comparatively low mortgage rates.
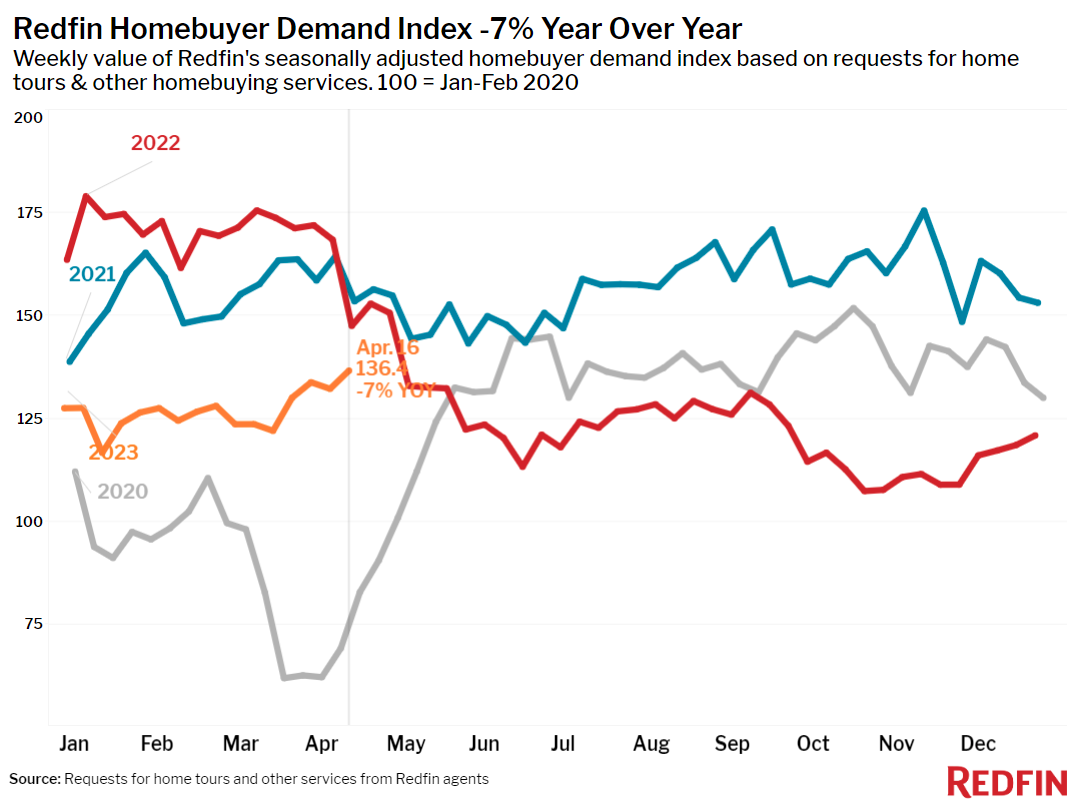
But while fewer people are buying homes, many are searching. Redfin’s Homebuyer Demand Index–a measure of requests to tour homes, make an offer or start a home search–rose 3% from a week earlier and 12% from a month earlier during the week ending April 16. The demand index was down 7% from a year ago, but that’s the smallest decline in eleven months.
“Homebuyers are window shopping and many are entering the store, but few of them are making it to the cash register yet,” said Redfin Deputy Chief Economist Taylor Marr. “There’s not much on the shelves to choose from, and high mortgage rates and still-high prices are making homes too expensive for many buyers. Some buyers are discouraged by mortgage rates rising this week, which is partly due to stronger-than-expected bank earnings making it more likely the Fed will hike interest rates next month.”
The market looks different in different parts of the country. Los Angeles Redfin agent Costanza Genoese Zerbi said that while few homeowners are moving, locked in by low rates, first-time buyers are on the hunt . There’s enough demand and such limited supply that all her recent listings received multiple offers.
“I listed a three-bedroom home that needed work in a desirable part of Long Beach. It was listed at $1.3 million, got 17 offers and sold for $1.5 million,” she said. “My advice for today’s buyers is to look for a home you love, not an investment. Mortgage rates are high and prices are still high, so you may not earn equity as quickly as you would have if you’d purchased a home two years ago. But if you’re buying your dream home in a place you want to live, it’s worth it.”
In Washington, D.C., some homeowners are taking advantage of limited supply and the uptick in competition. “Many sellers are sitting on a ton of equity. Maybe they bought their home 10 years ago and it’s gone up in value by hundreds of thousands of dollars,” said local Redfin agent Marshall Carey. “Even with high rates, it’s a good time to move up because they have so much money in the bank to get a nicer home in a better location.”
Home Prices Falling in More Than Half of the U.S.
The median U.S. home-sale price fell for the eighth straight four-week period after more than a decade of increases.
Home-sale prices dropped in 30 of the 50 most populous U.S. metros, with the biggest drop in Austin, TX (-15.1% YoY). It’s followed by Oakland, CA (-11.5%), Sacramento, CA (-9.5%), San Francisco (-9.2%) and Seattle (-9.1%).
On the other end of the spectrum, sale prices increased most in Fort Lauderdale, FL, where they rose 9.1% year over year. Next come Cincinnati (9%), Miami (8.5%), West Palm Beach, FL (8%) and Milwaukee (7.2%).
Leading indicators of homebuying activity:
-
- For the week ending April 20, average 30-year fixed mortgage rates increased to 6.39%, the first increase after five straight weeks of declines. The daily average was 6.67% on April 20.
- Mortgage-purchase applications during the week ending April 14 declined 10% from a week earlier, seasonally adjusted. Purchase applications were down 36% from a year earlier.
- The seasonally adjusted Redfin Homebuyer Demand Index–a measure of request for home tours and other homebuying services from Redfin agents–hit its highest level in nearly a year during the week ending April 16. It was down 7% from a year earlier.
- Google searches for “homes for sale” were up about 43% from the trough they hit in November during the week ending April 15, but down about 17% from a year earlier.
- Touring activity as of April 18 was up about 31% from the start of the year, compared with a 5% increase at the same time last year, according to home tour technology company ShowingTime.
Key housing market takeaways for 400+ U.S. metro areas:
Unless otherwise noted, the data in this report covers the four-week period ending April 16. Redfin’s weekly housing market data goes back through 2015.
Data based on homes listed and/or sold during the period:
- The median home sale price was $366,200, down 2.6% from a year earlier. That’s the biggest decline in more than 10 years, according to Redfin’s monthly dataset, which goes back through 2012.
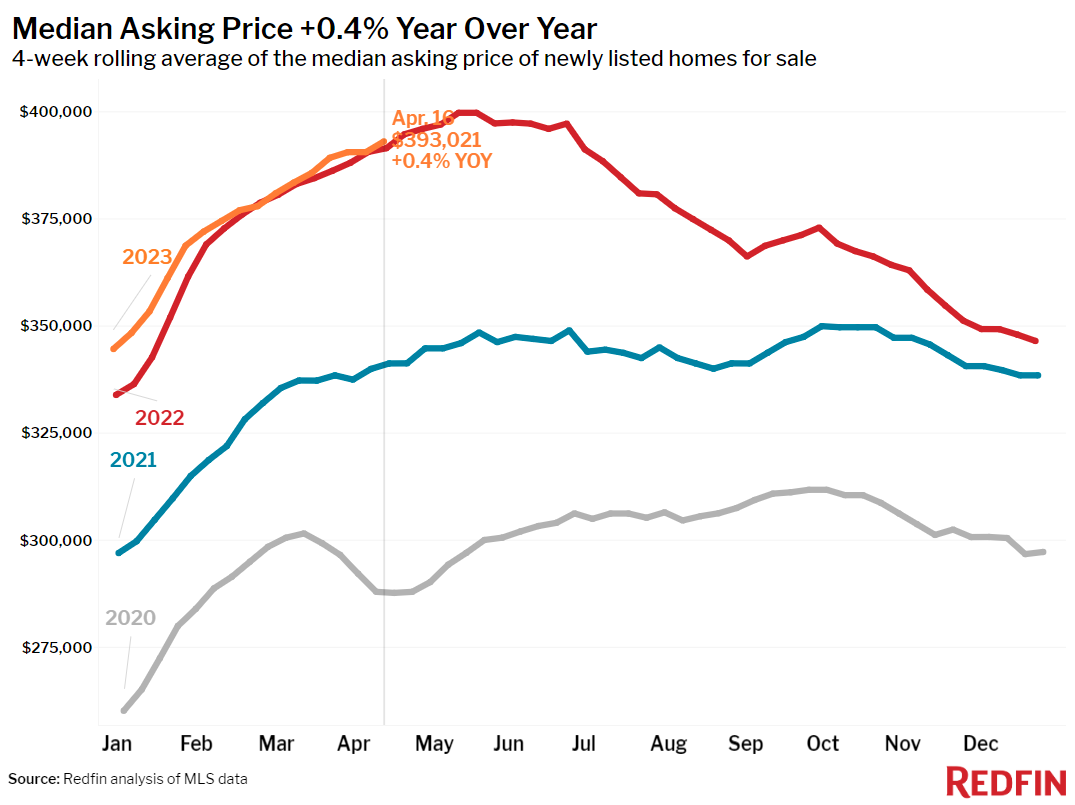
- The median asking price of newly listed homes was $393,021, up 0.4% year over year.
- The monthly mortgage payment on the median-asking-price home was $2,538 at a 6.39% mortgage rate, the current weekly average. That’s an all-time high and up 12% ($265) from a year ago.
- Pending home sales were down 19% year over year, the biggest decline in nearly three months.
- Pending home sales fell in all 50 of the most populous U.S. metros. They declined most in Oakland (-42.3% YoY), Las Vegas (-42.2%), Portland, OR (-41%), Seattle (-41%) and San Jose (-40.4%).
- New listings of homes for sale fell 21.3% year over year.
- New listings declined in all 50 of the most populous U.S. metros. They dropped most in Oakland (-42.2% YoY), Seattle (-39.8%), Sacramento (-39.3%), San Diego (-39.2%) and Riverside, CA (-36.5%).
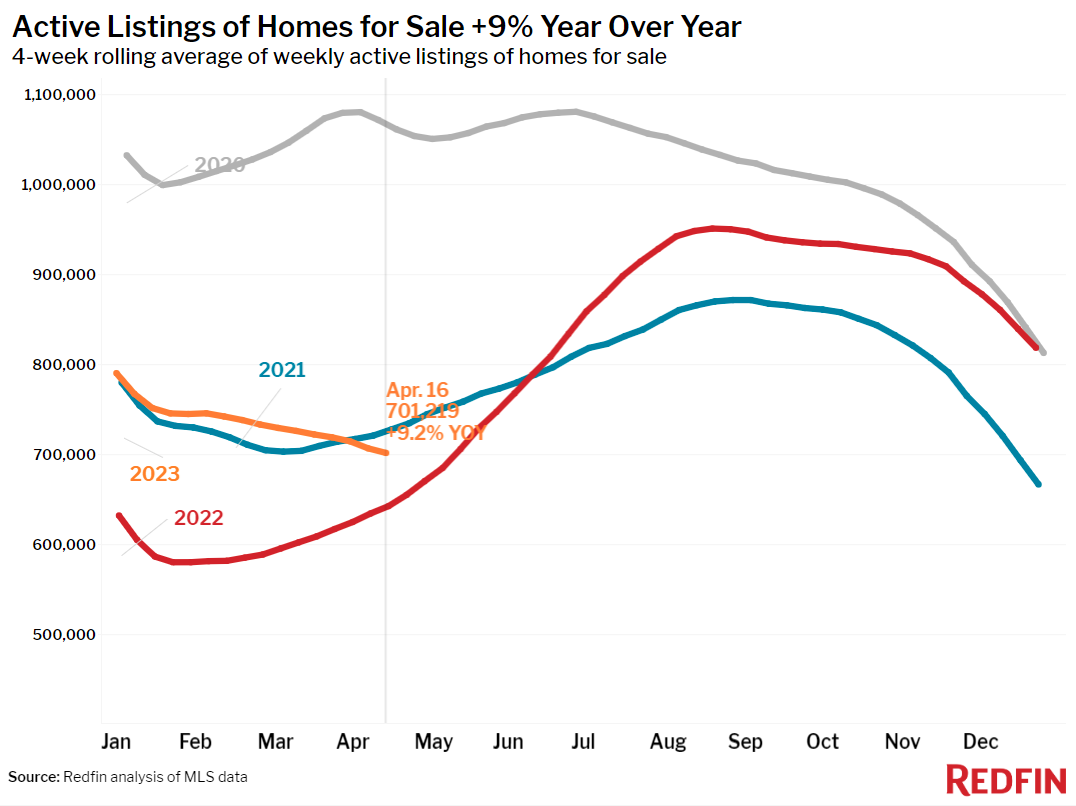
- Active listings (the number of homes listed for sale at any point during the period) were up 9.2% from a year earlier, the smallest increase in six months. This metric posted an unseasonal decline.
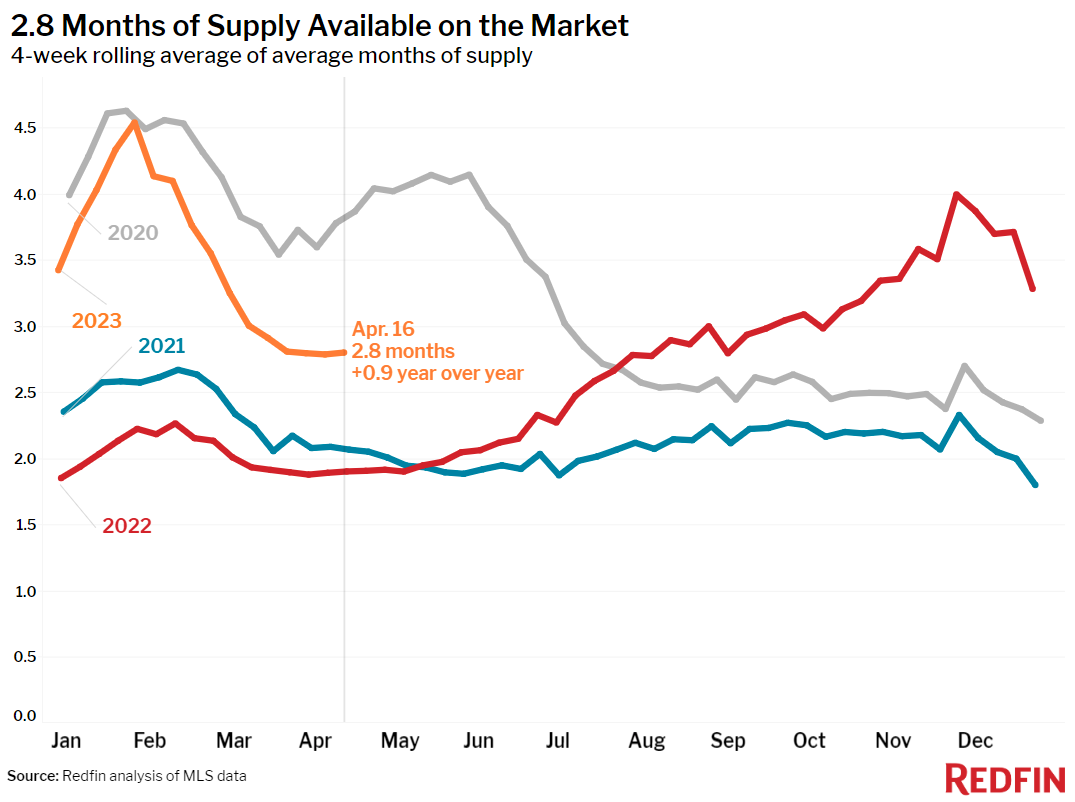
- Months of supply—a measure of the balance between supply and demand, calculated by the number of months it would take for the current inventory to sell at the current sales pace—was 2.8 months, up from 1.9 months a year earlier. Four to five months of supply is considered balanced, with a lower number indicating seller’s market conditions.
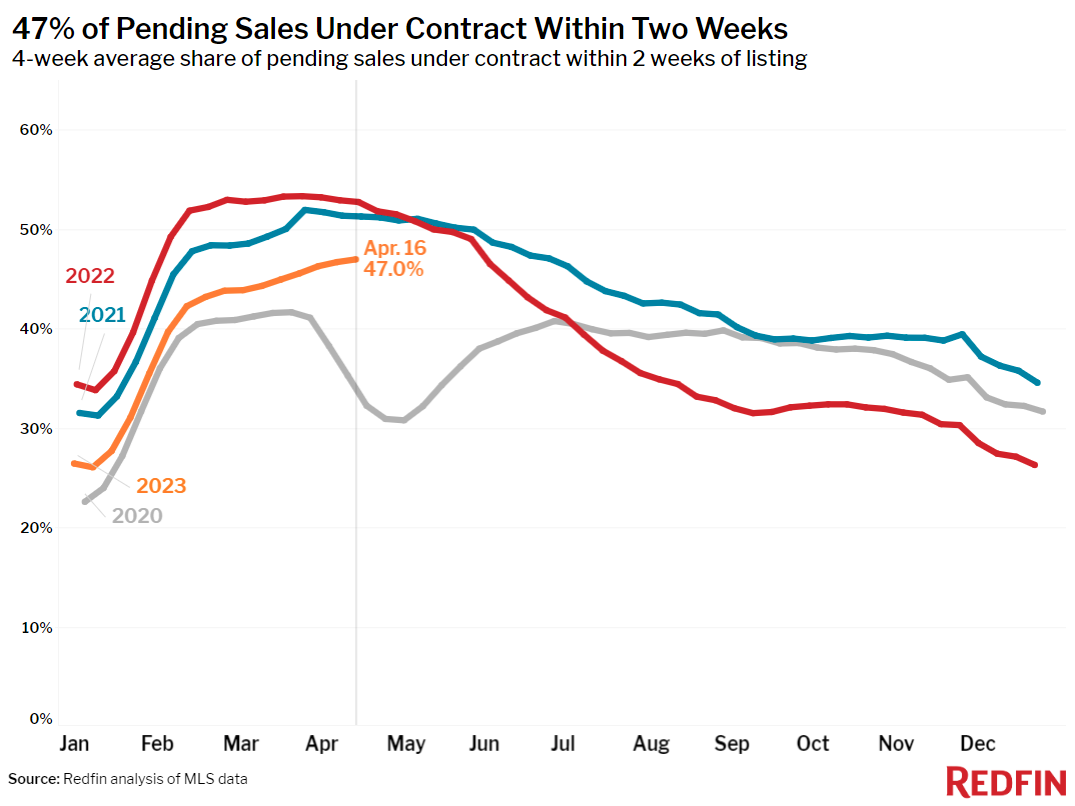
- 47% of homes that went under contract had an accepted offer within the first two weeks on the market, the highest level since June, but down from 53% a year earlier.
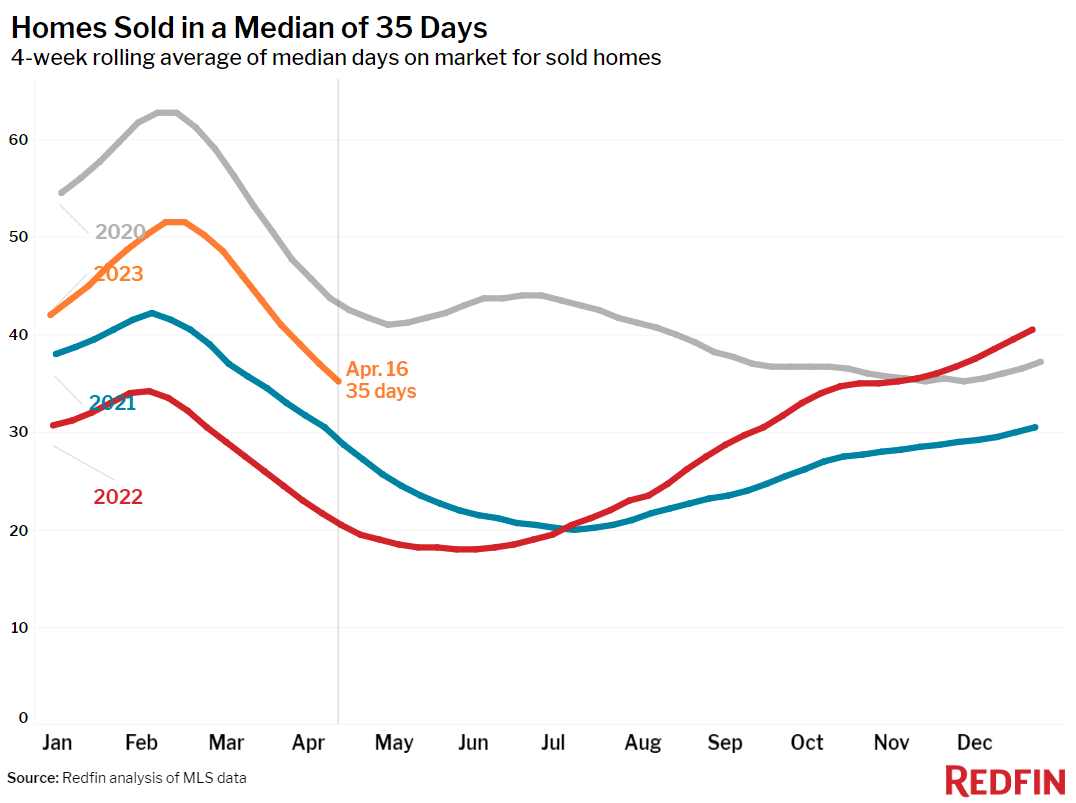
- Homes that sold were on the market for a median of 35 days, the shortest span since November. That’s up from 21 days a year earlier and the record low of 18 days set last May.
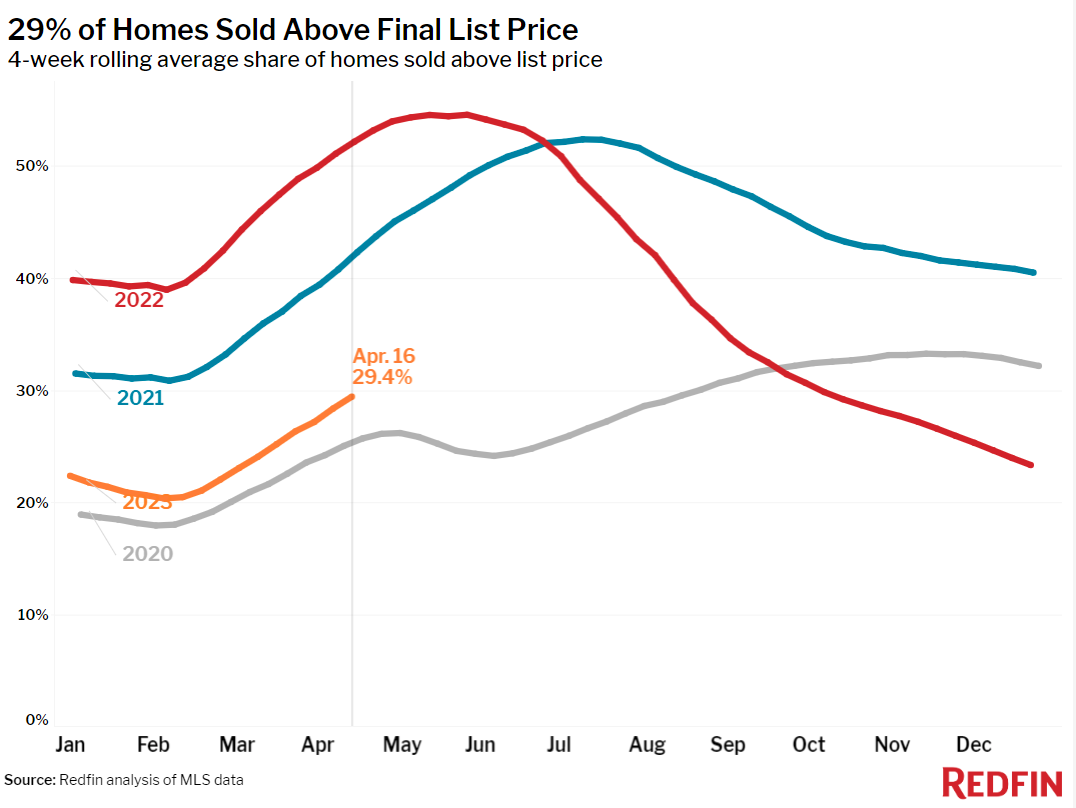
- 29% of homes sold above their final list price, the highest share in five months but down from 52% a year earlier.
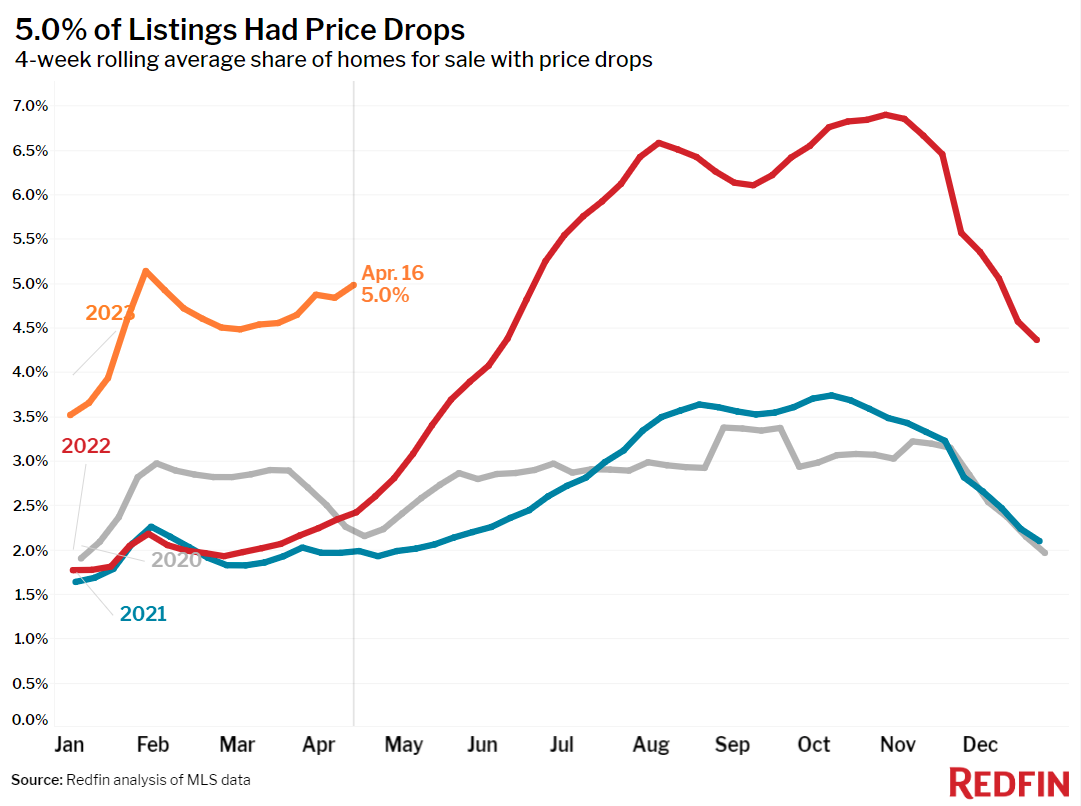
- On average, 5% of homes for sale each week had a price drop, up from 2.4% a year earlier.
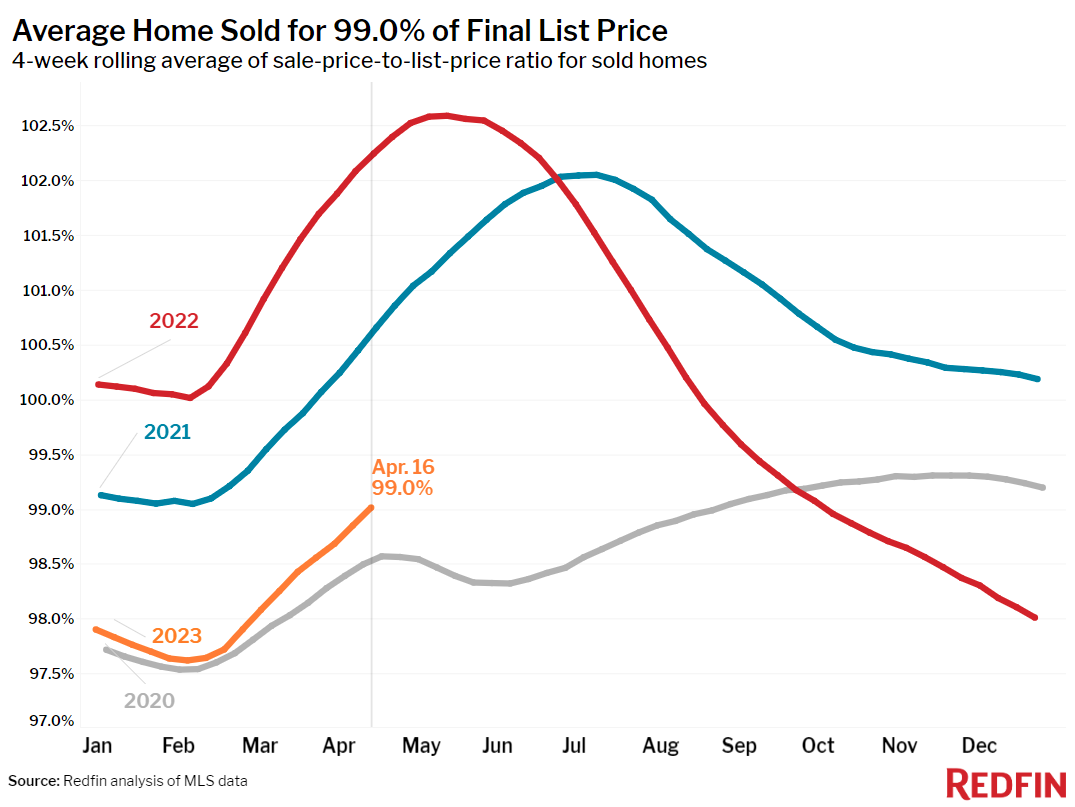
- The average sale-to-list price ratio, which measures how close homes are selling to their final asking prices, was 99%, the highest level in nearly six months but down from 102.2% a year earlier.
Refer to our metrics definition page for explanations of all the metrics used in this report.

 United States
 Canada