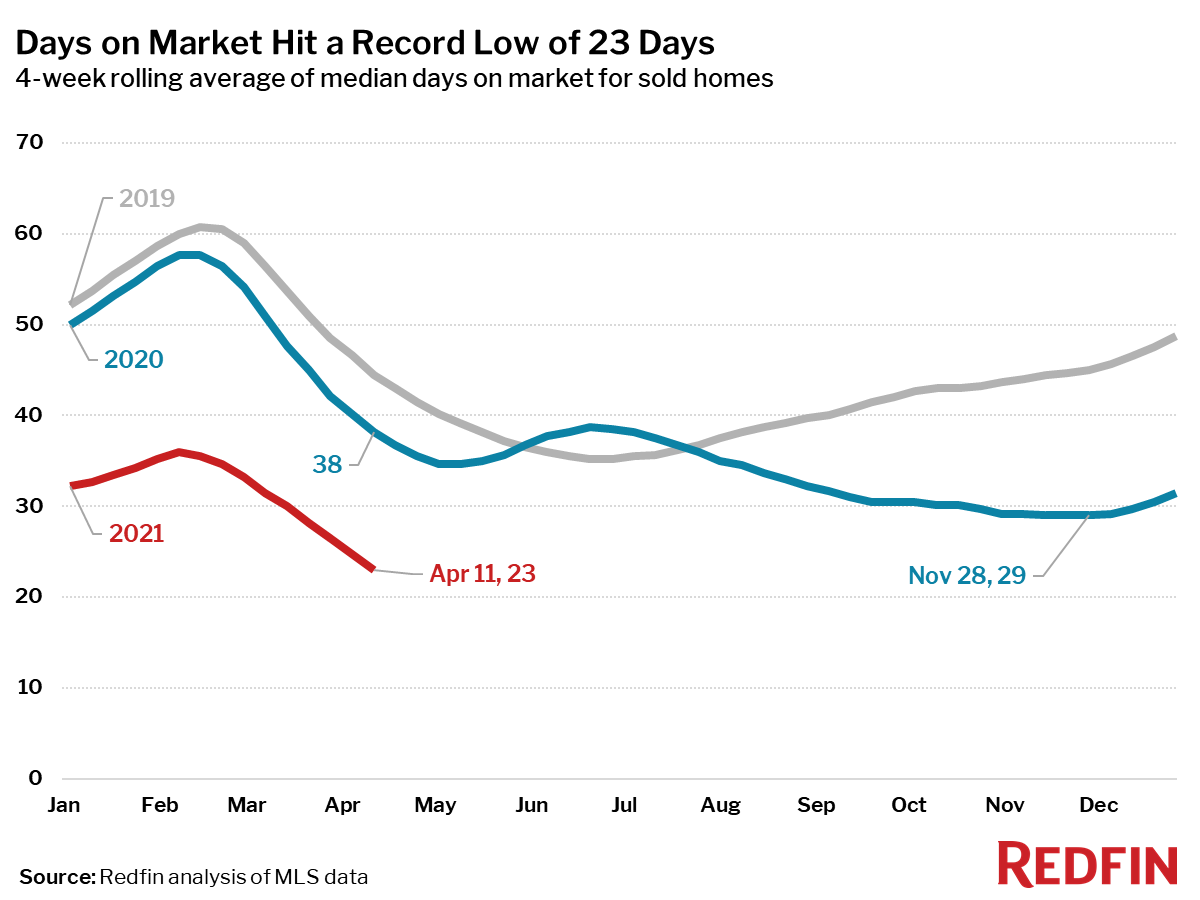
Homes are selling faster than ever, with the typical house getting snatched up in just 23 days.
Key housing market takeaways for 400+ U.S. metro areas during the four-week period ending April 11:
Note: At this time last year, pandemic stay-at-home orders halted homebuying and selling, which makes year-over-year comparisons unreliable for select housing metrics. As such, we have broken this report into two sections: metrics that are OK to compare to the same period in 2020, and metrics for which it makes more sense to compare to the same period in 2019.
Metrics to compare to 2020:
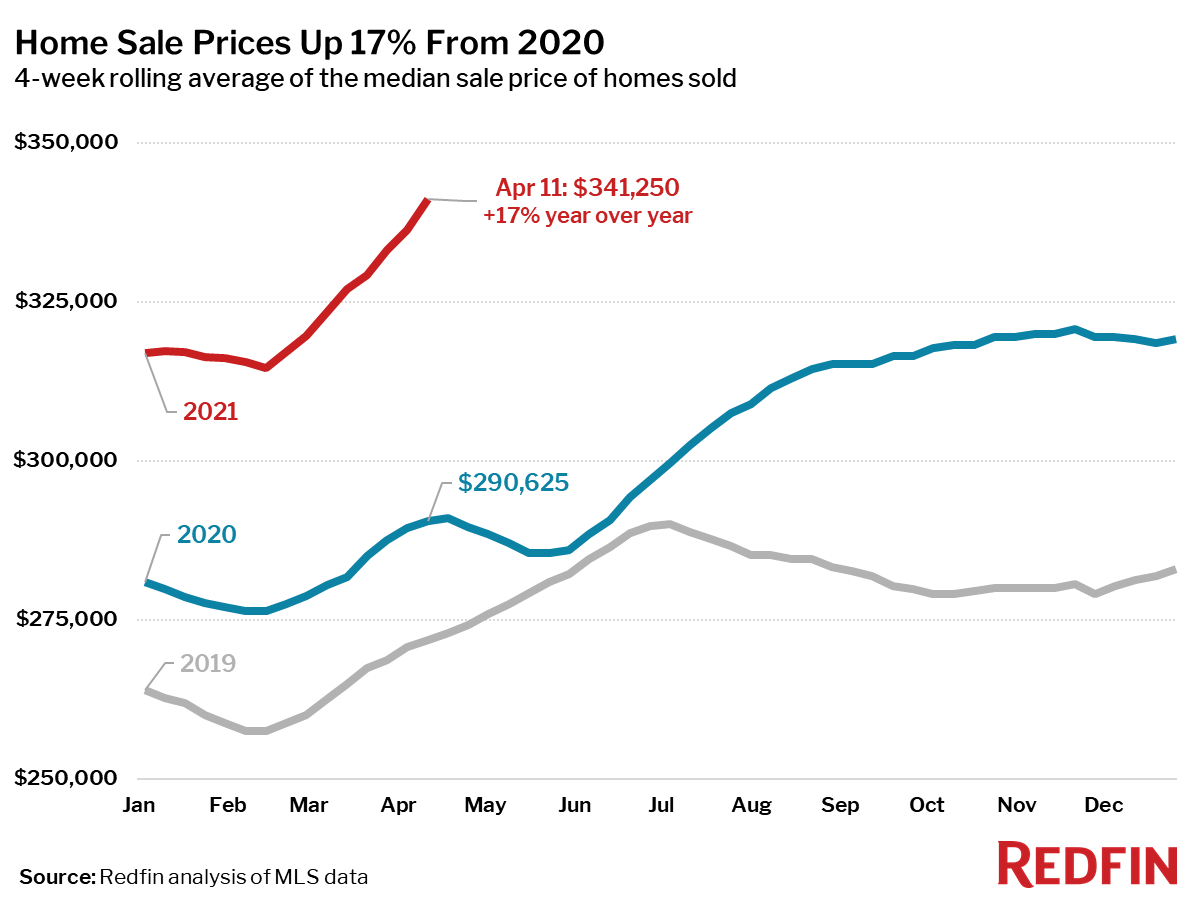
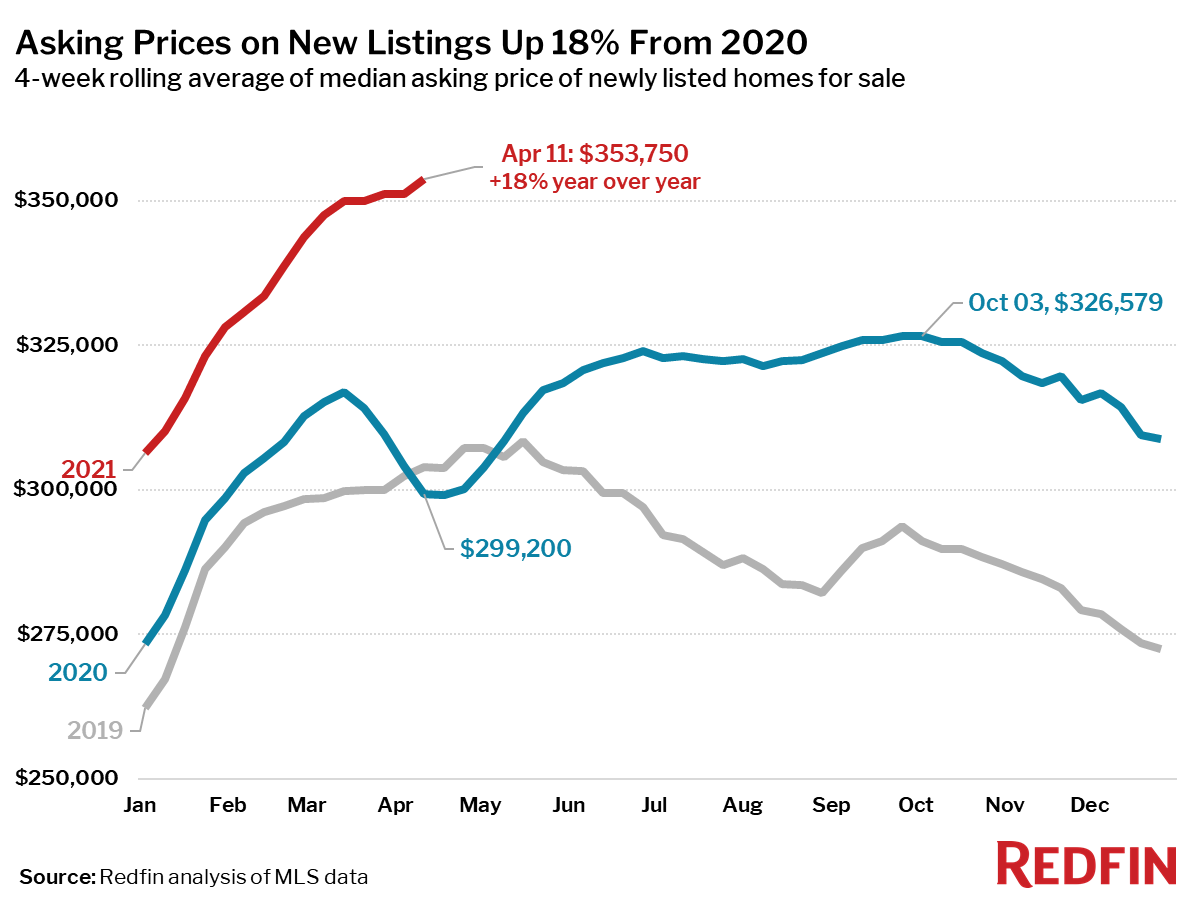
- The median home-sale price increased 17% year over year to $341,250, an all-time high. Asking prices reached an all-time high of $353,750.
- Homes that sold during the period were on the market for a median of 23 days, the shortest time on market since 2012. This was 15 days fewer than the same period in 2020.
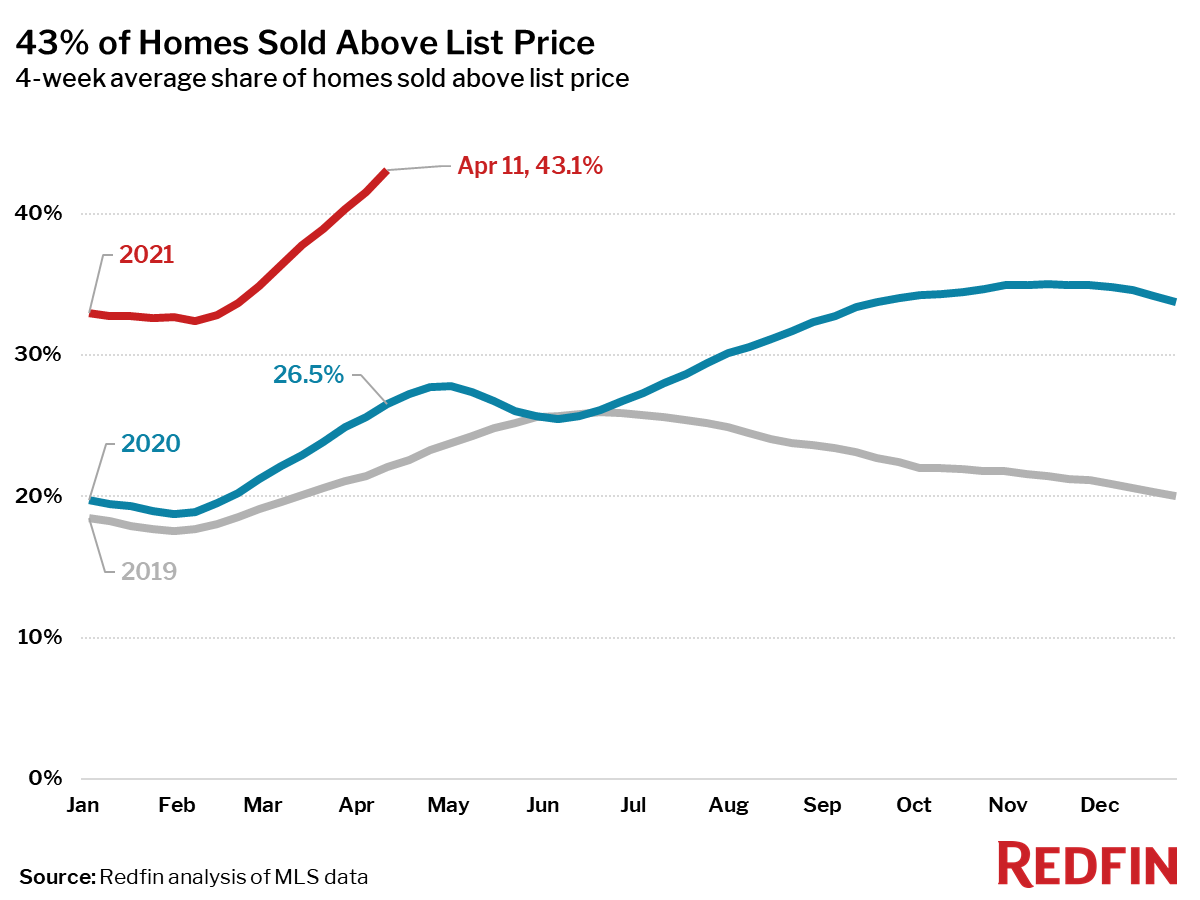
- 43% of homes sold for more than their list price, an all-time high. This was 17 percentage points higher than the same period a year earlier.
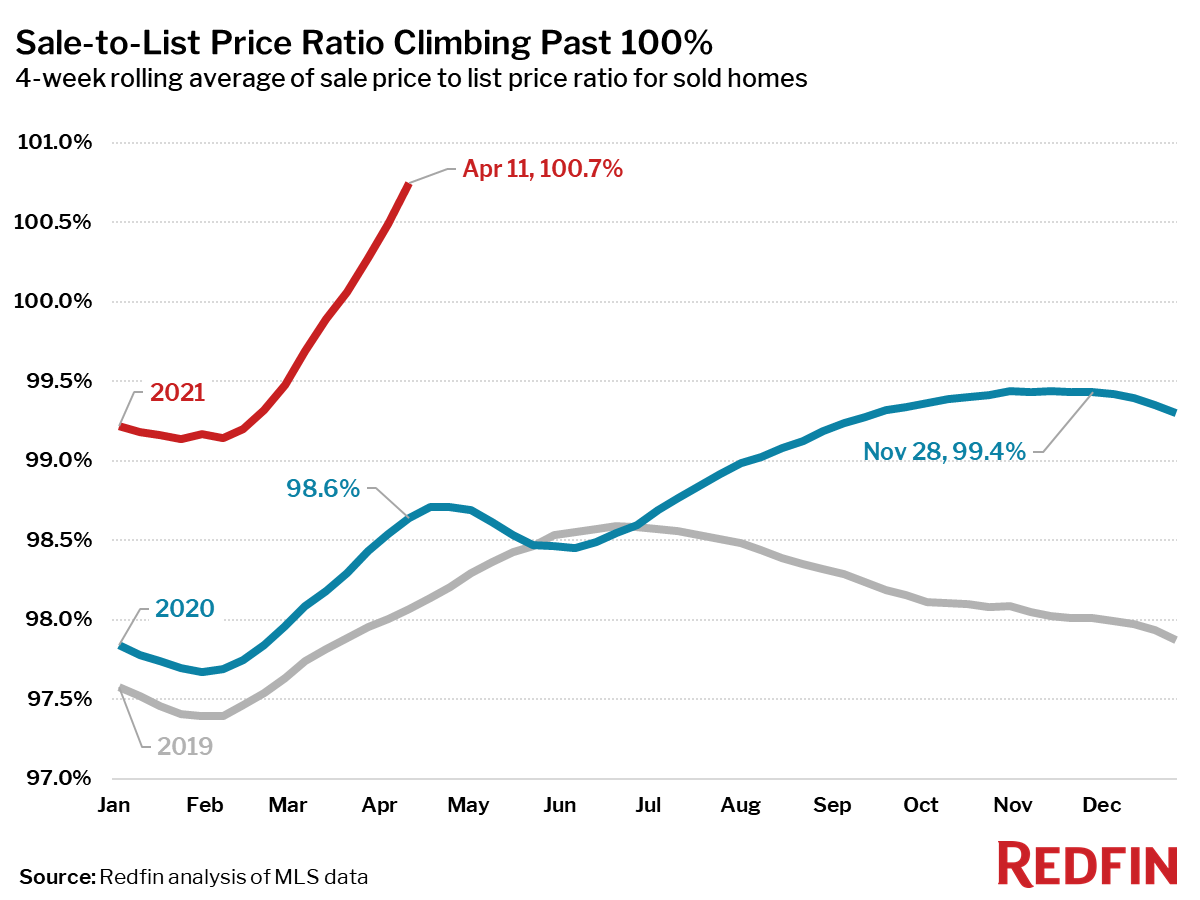
- The average sale-to-list price ratio, which measures how close homes are selling to their asking prices, increased 2.1 percentage points year over year to an all-time high of 100.7%, meaning the average home sold for 0.7% more than its asking price.
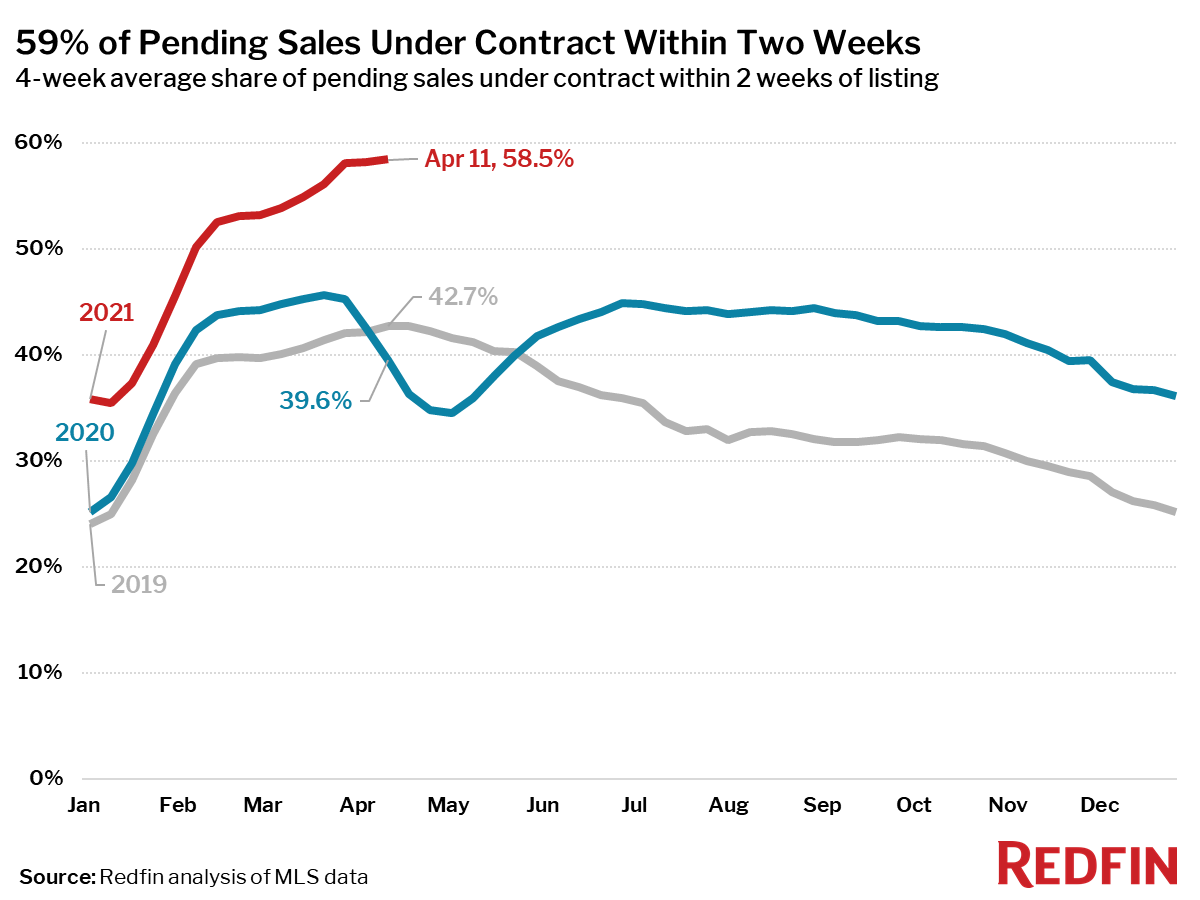
- 59% of homes that went under contract had an accepted offer within the first two weeks on the market. This is a new all-time high (Redfin’s data for this measure goes back to 2012).
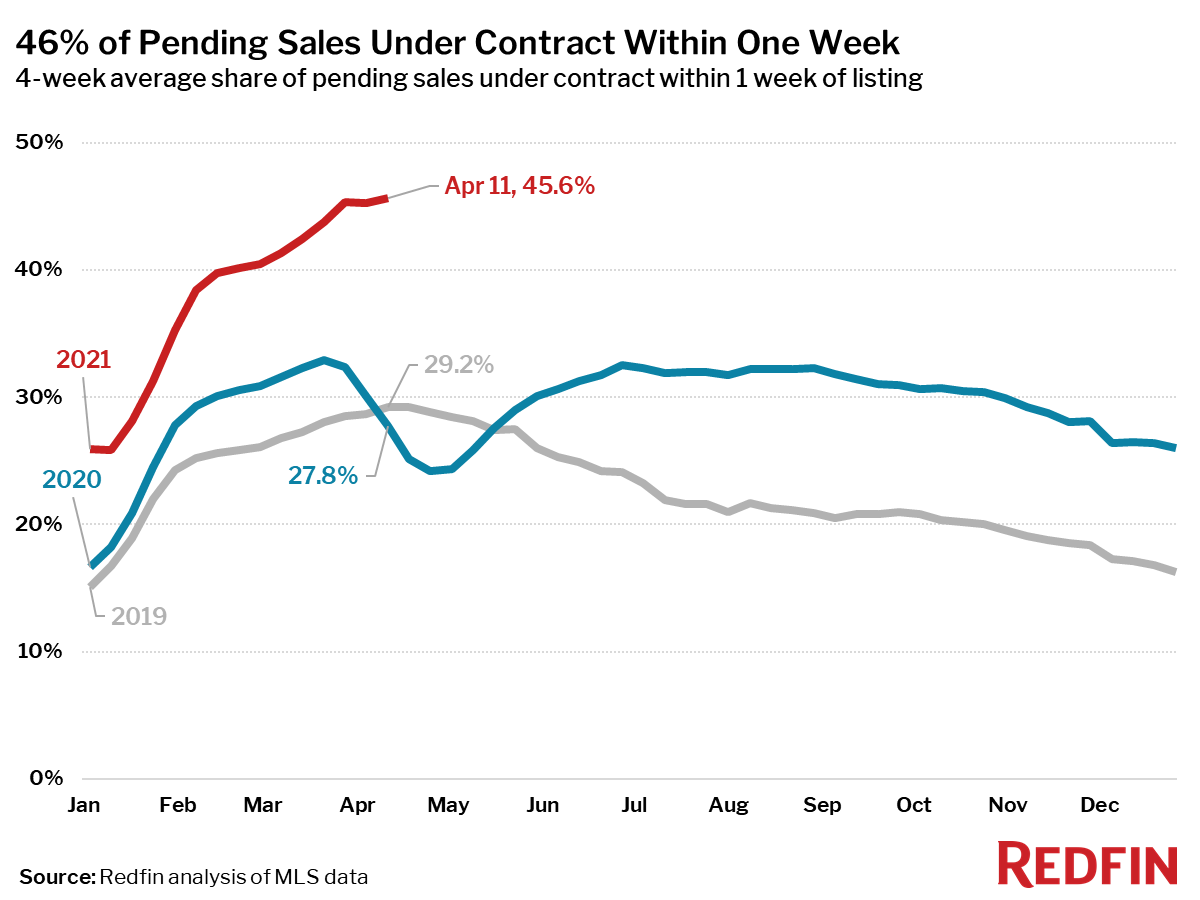
- 46% of homes that went under contract had an accepted offer within one week of hitting the market, an all-time high.
Metrics to compare to 2019:
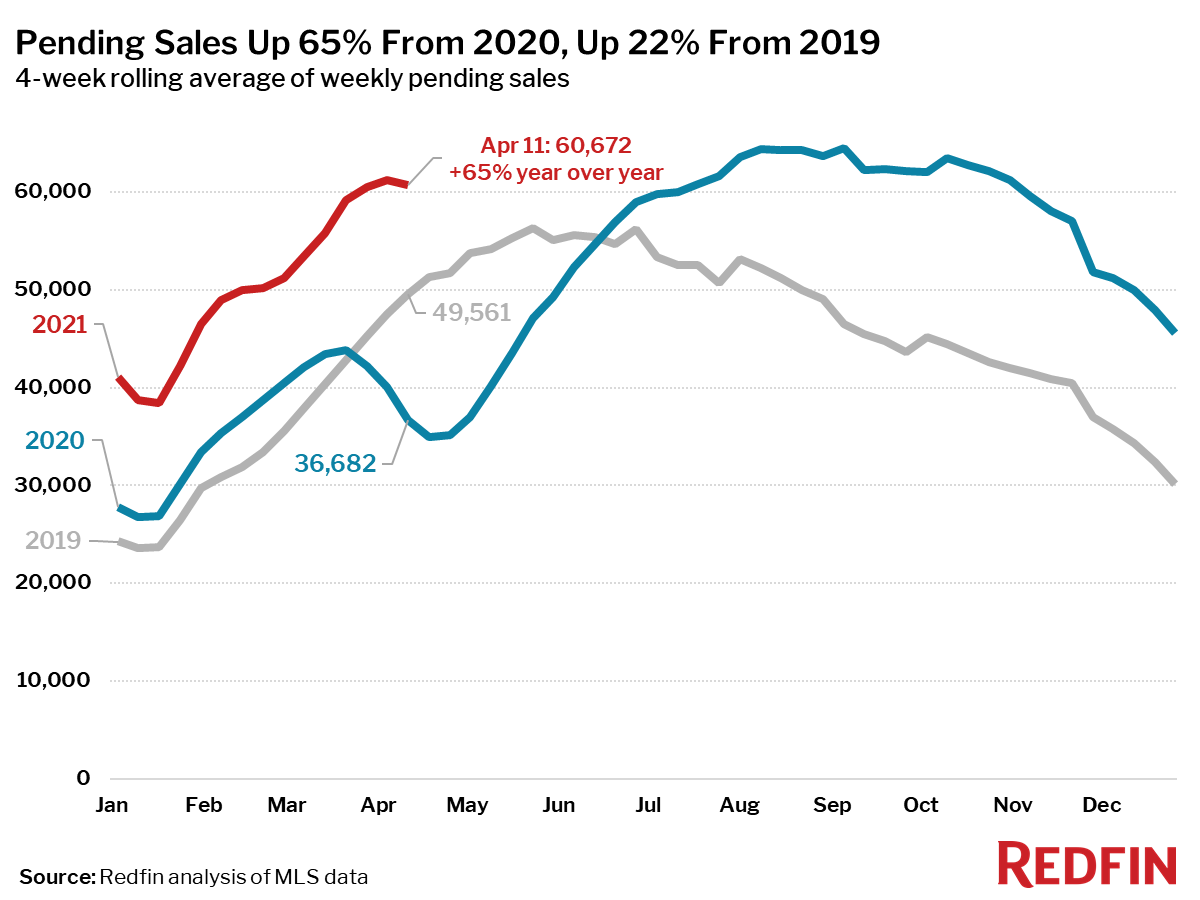
- Pending home sales were up 22% from the same period in 2019.
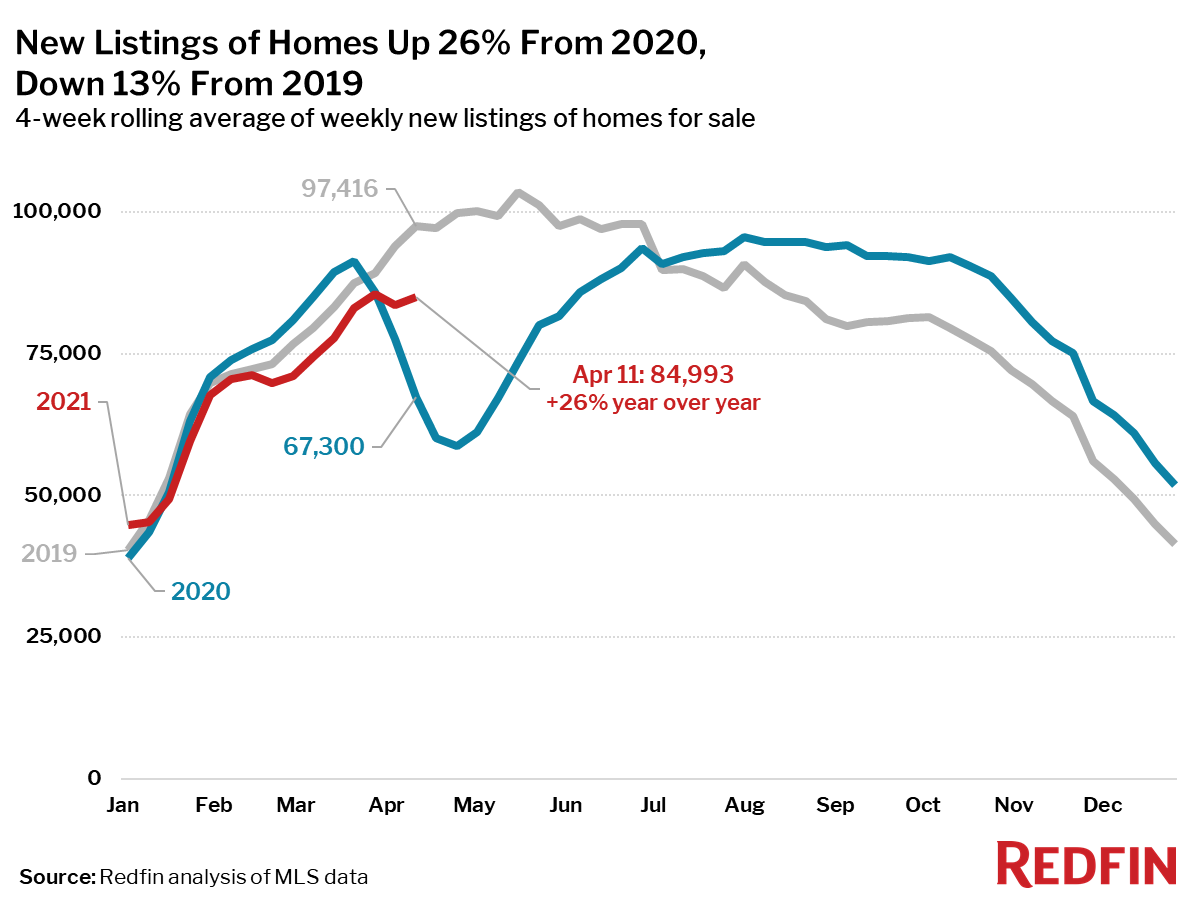
- New listings of homes for sale were down 13% from the same period in 2019.
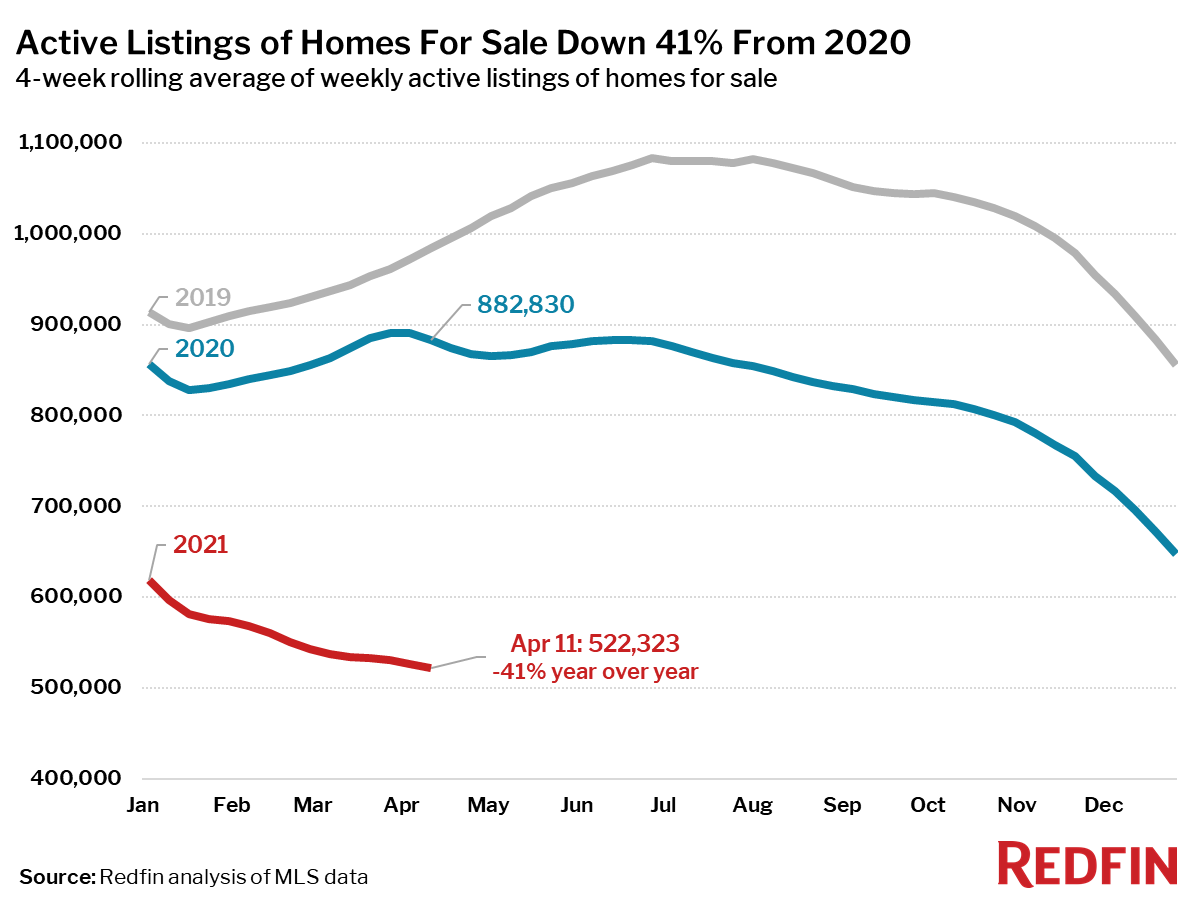
- Active listings (the number of homes listed for sale at any point during the period) fell 47% from the same period in 2019 to a new all-time low.
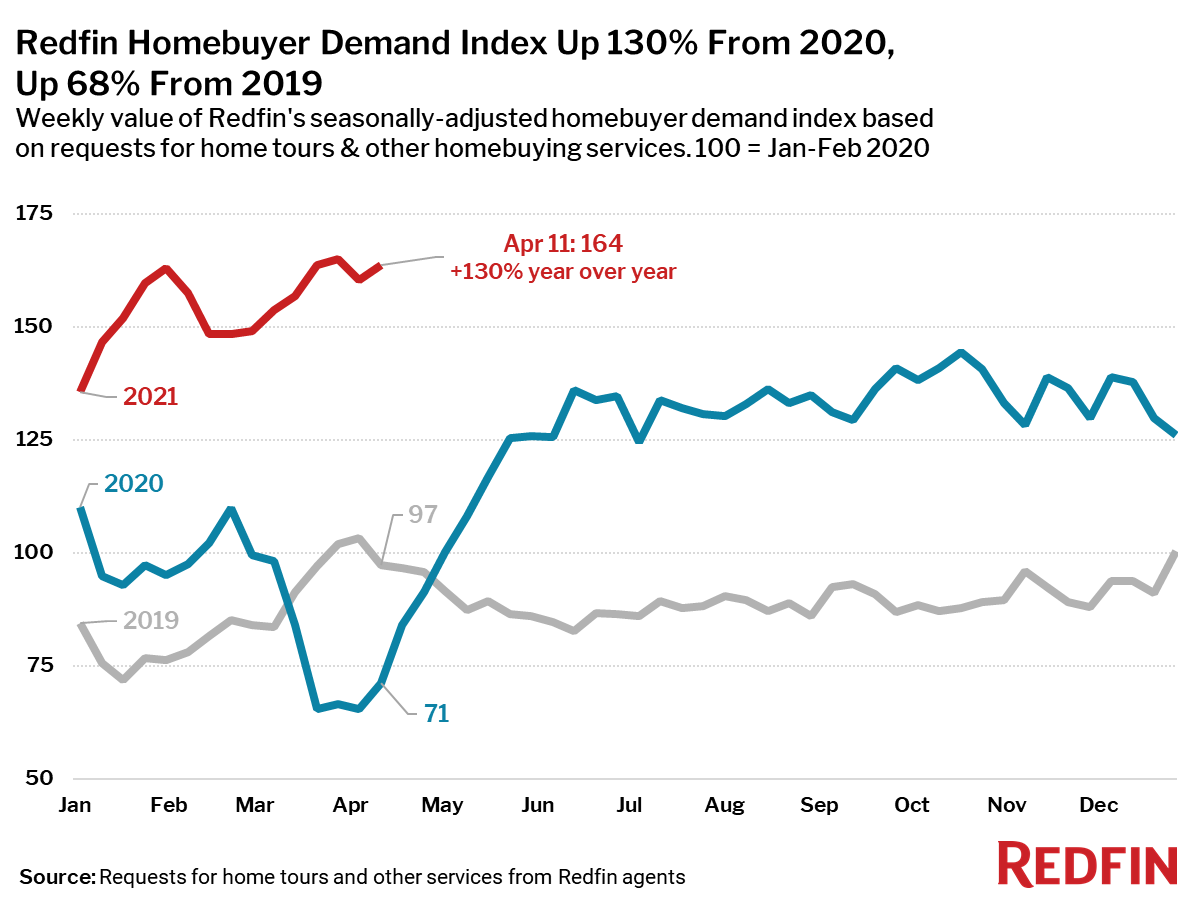
“The Easter holiday may have contributed to the latest decline in new listings, as many Americans were spending time with family instead of putting their homes on the market. The overall lack of homes for sale is limiting how much home sales can grow,” said Redfin Lead Economist Taylor Marr. “However, Redfin’s homebuyer demand index is up 4.3% from a month ago, revealing that house hunters are still out in full force. They’re jumping on low mortgage rates, which are sliding back down toward 3%, and bidding up prices of the homes that do hit the market. The good news for buyers is that they should start to see more homes listed now that Easter is behind us.”
Refer to our metrics definition page for explanations of all the metrics used in this report.