More than one in five home sellers dropped their price while several measures of homebuyer demand posted largest declines since spring 2020
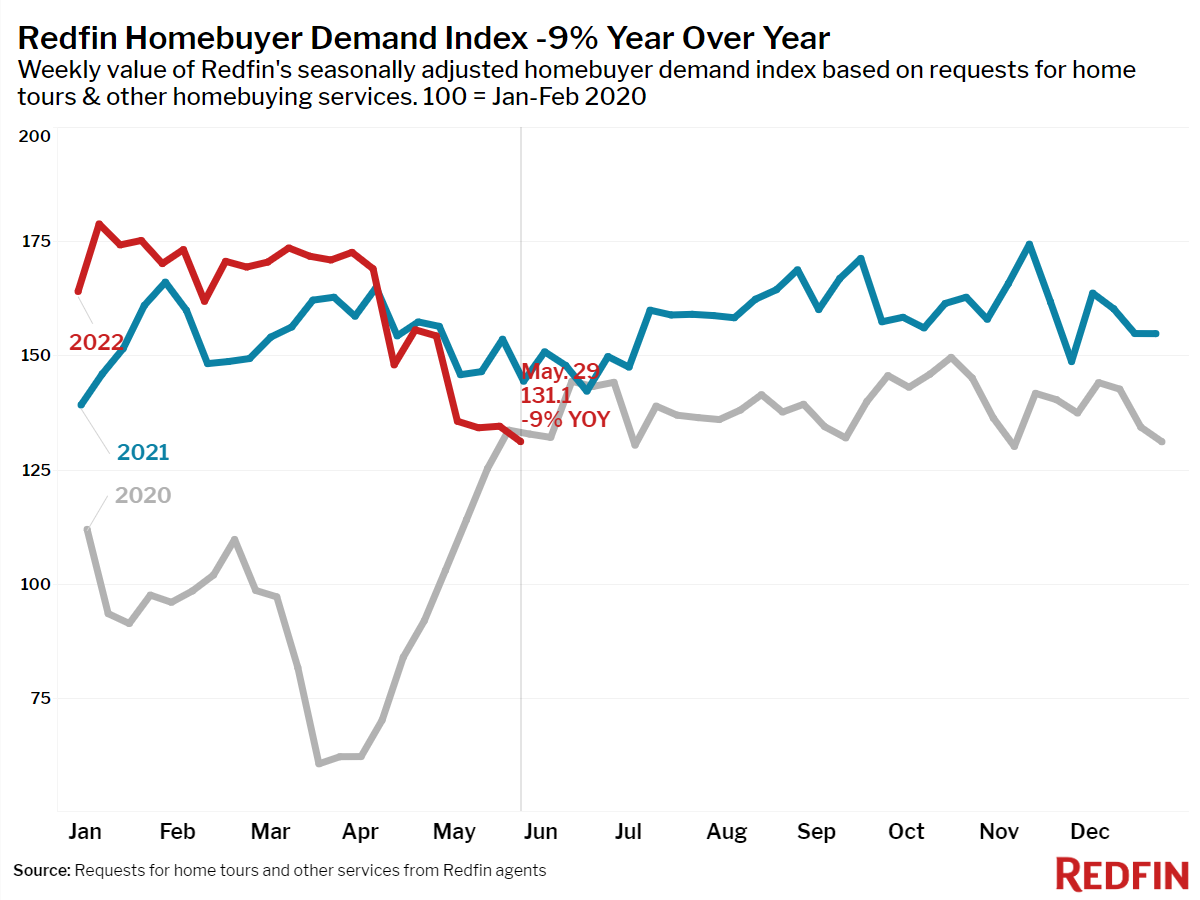
May marked a turning point in the pandemic housing frenzy, as buyers regained some control over the market. This limited sense of control comes at a great cost, as 5% mortgage rates and record-high prices have edged many buyers out of the market. Pending sales posted their largest annual decline since spring 2020, while the Redfin Homebuyer Demand Index declined 9% during the four weeks ending May 29. The number of homes for sale climbed to a new high for this year, posting its smallest decline since April 2020. A growing share of sellers are recognizing the new limits to their power. More than one in five dropped their price, the highest rate since October 2019.
“The sudden surge in mortgage rates led to a sudden and significant cooldown in the housing market in May,” said Redfin Economics Research Lead Chen Zhao. “However, mortgage rates are now stabilizing and homes remain in short supply, so while we do expect home-price growth rates to decline, we don’t expect prices to fall much at the national level. For homebuyers trying to determine the best timing this year, the main benefit of waiting is that there may be less competition as supply starts to build up.“
Leading indicators of homebuying activity:
- Fewer people searched for “homes for sale” on Google—searches during the week ending May 21 were down 10% from a year earlier.
- The seasonally-adjusted Redfin Homebuyer Demand Index—a measure of requests for home tours and other home-buying services from Redfin agents—was down 9% year over year during the week ending May 29. This was the seventh consecutive decline in the index.
- Touring activity from the first week of January through May 29 was 27 percentage points behind the same period in 2021, according to home tour technology company ShowingTime. Touring activity was lower than the first week of January for the first time this year.
- Mortgage purchase applications were down 14% from a year earlier, while the seasonally-adjusted index was down 1% week over week during the week ending May 27.
- For the week ending June 2, 30-year mortgage rates decreased slightly to 5.09%.
Key housing market takeaways for 400+ U.S. metro areas:
Unless otherwise noted, the data in this report covers the four-week period ending May 29. Redfin’s housing market data goes back through 2012.
Data based on homes listed and/or sold during the period:
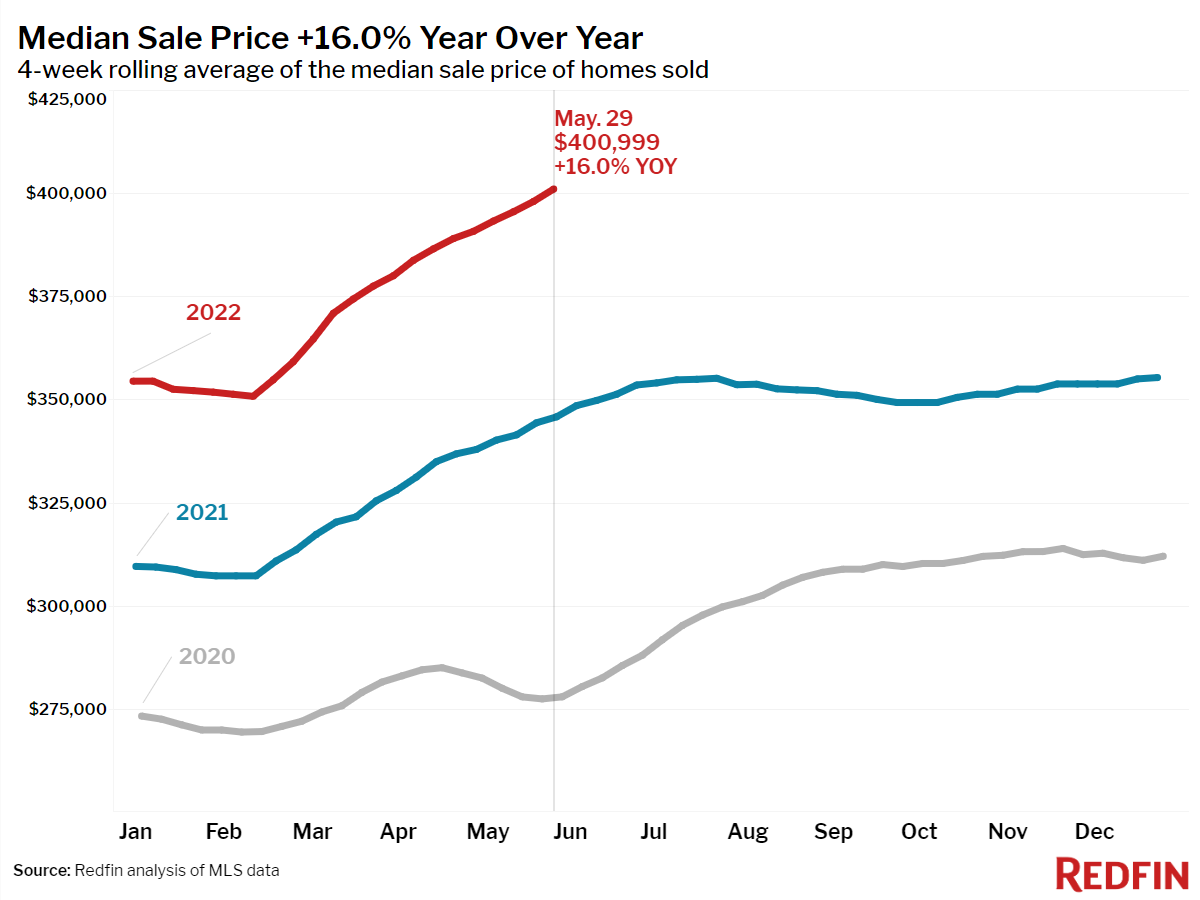
- The median home sale price was up 16% year over year to a record $400,999.
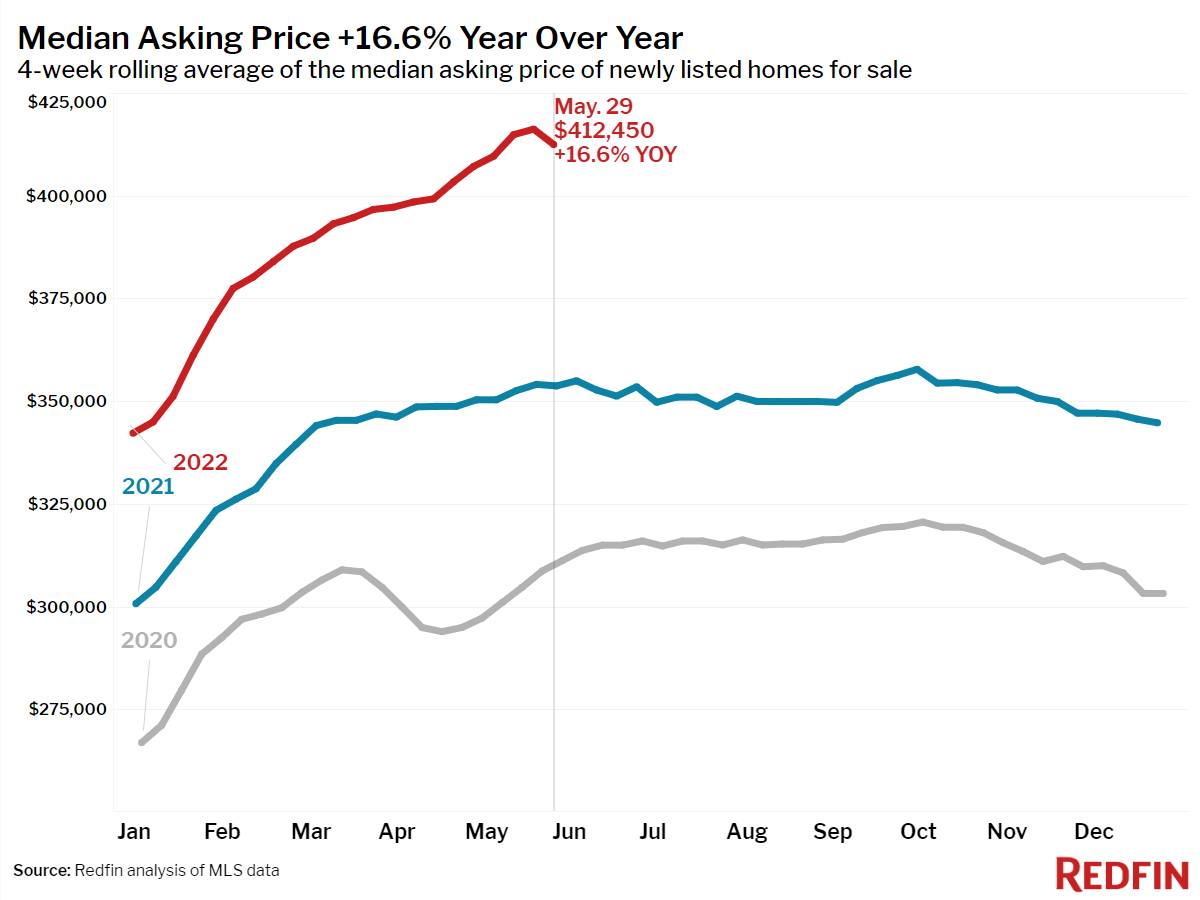
- The median asking price of newly listed homes increased 17% year over year to $412,450.
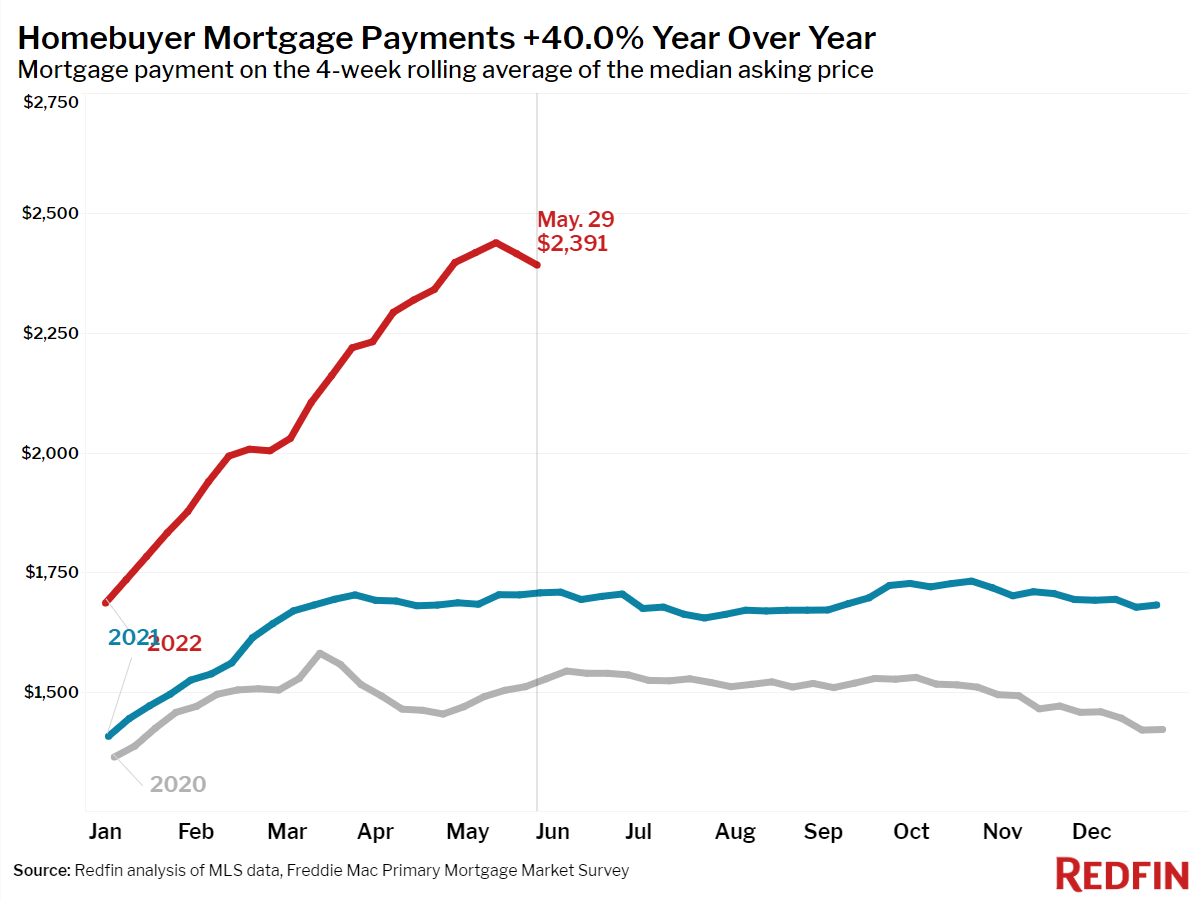
- The monthly mortgage payment on the median asking price home declined slightly to $2,391 at the current 5.09% mortgage rate. This was up 40% from $1,710 a year earlier, when mortgage rates were 2.99%.
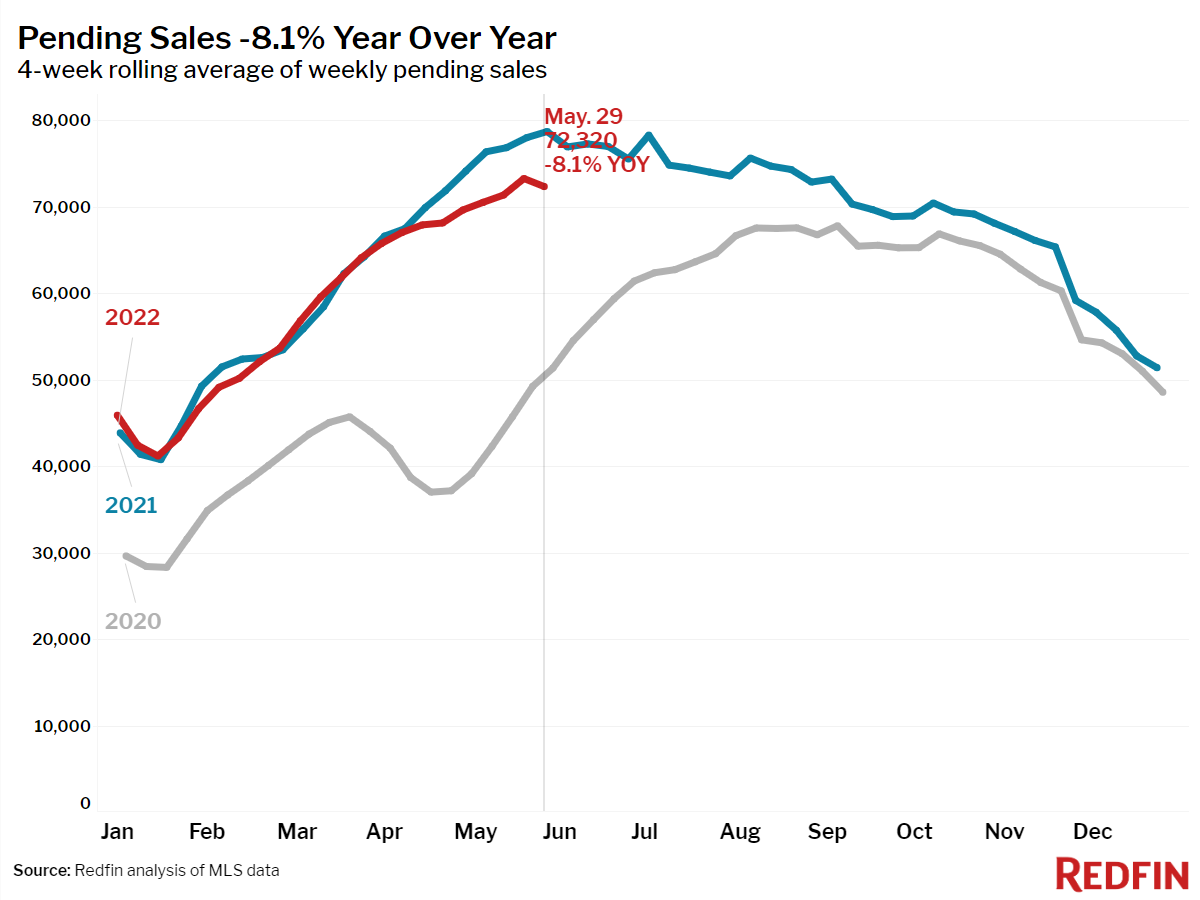
- Pending home sales were down 8% year over year, the largest decrease since May 2020.
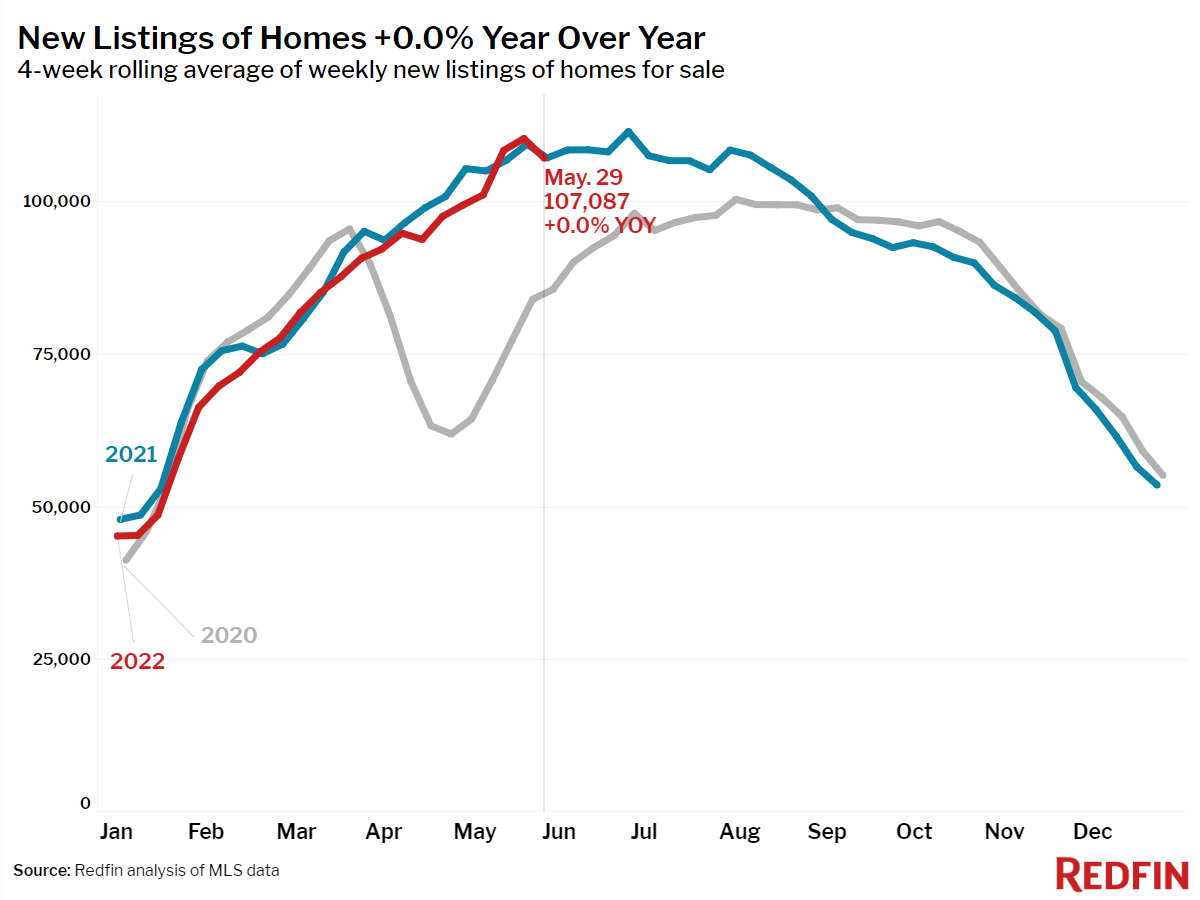
- New listings of homes for sale were flat from a year earlier.
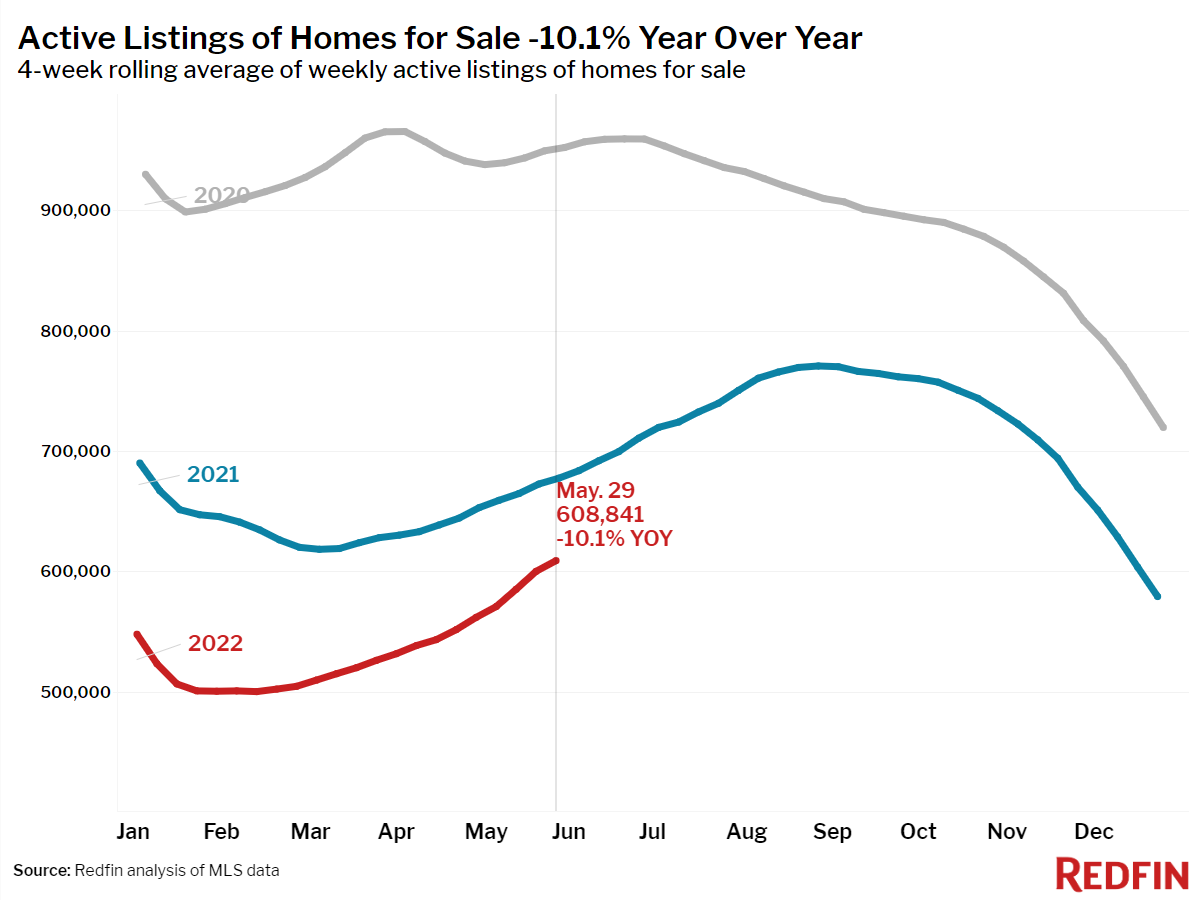
- Active listings (the number of homes listed for sale at any point during the period) fell 10% year over year—the smallest decline since April 2020.
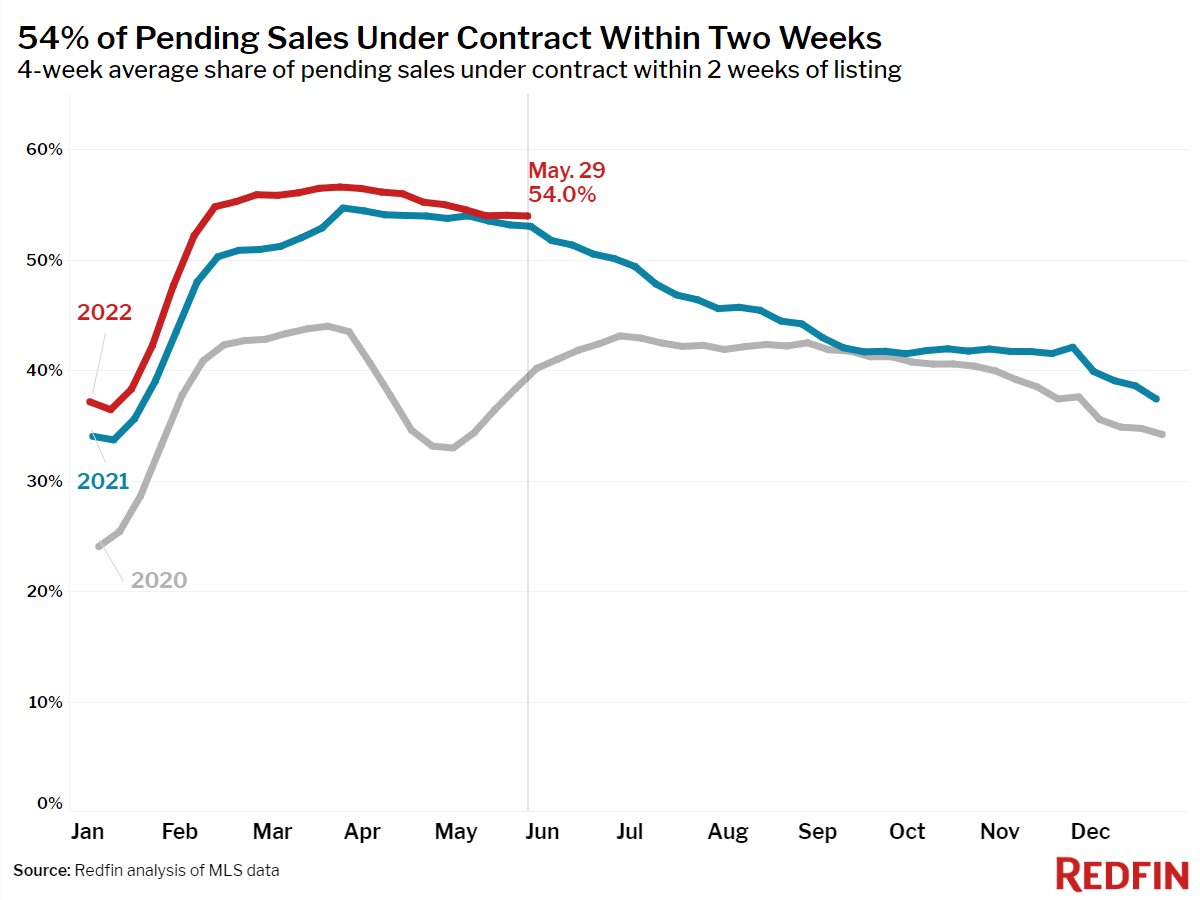
- 54% of homes that went under contract had an accepted offer within the first two weeks on the market, up from 53% a year earlier.
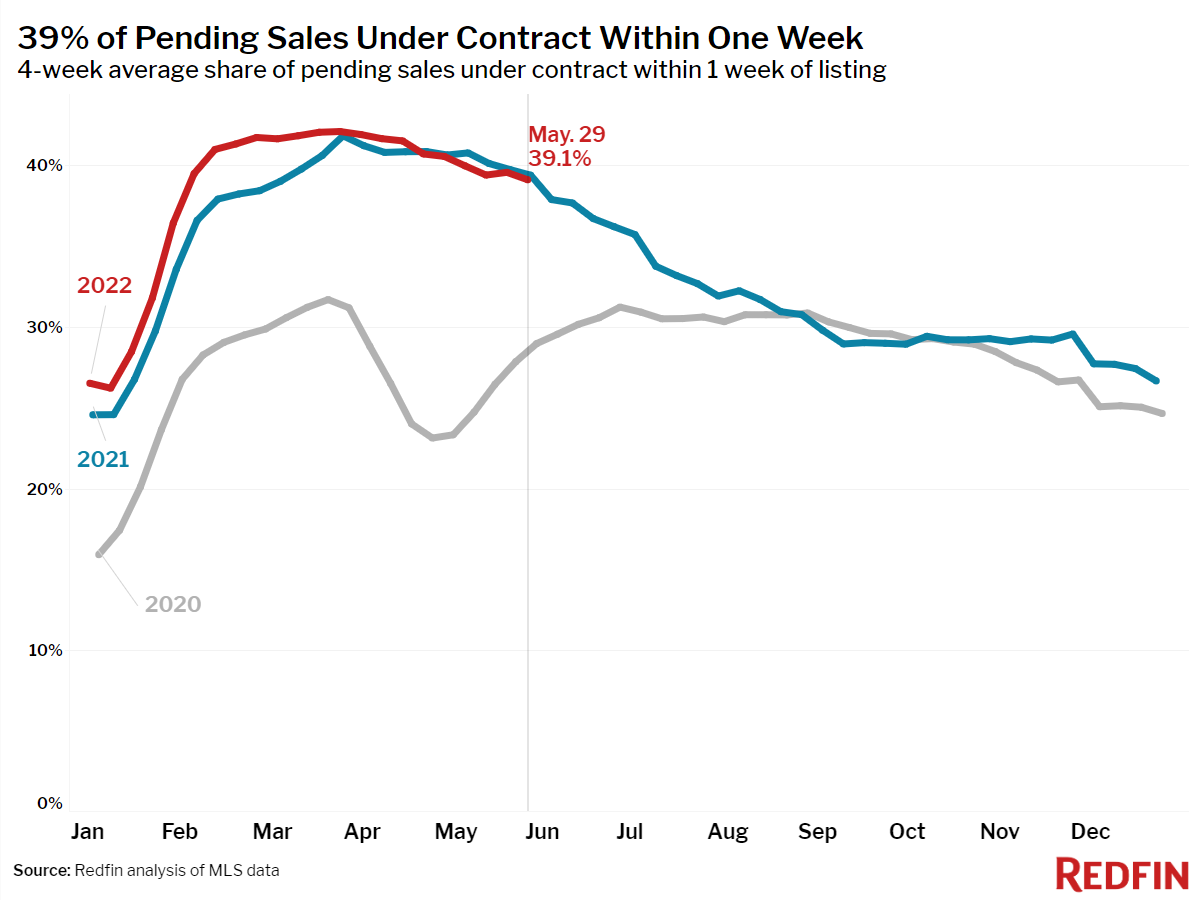
- 39% of homes that went under contract had an accepted offer within one week of hitting the market, flat compared to a year earlier.
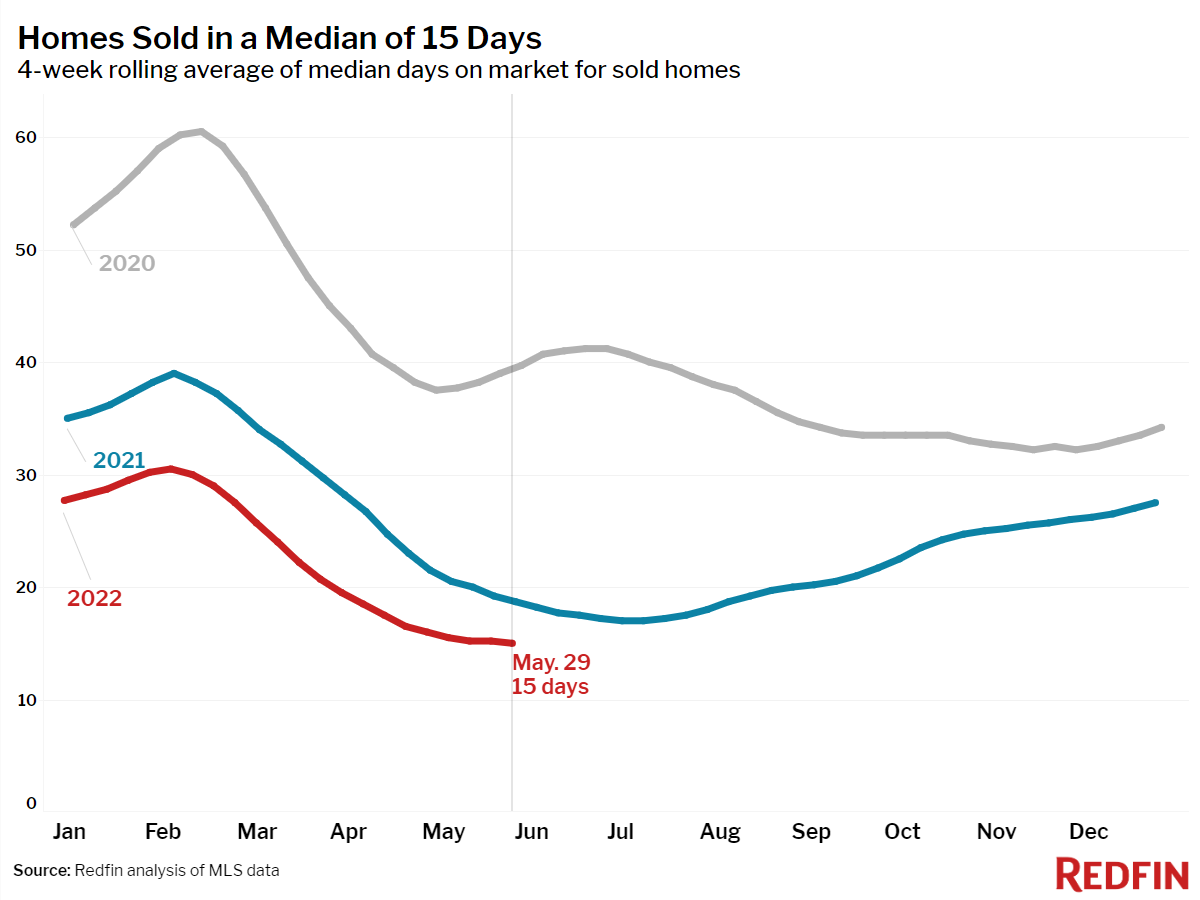
- Homes that sold were on the market for a record-low median of 15 days, down from 19 days a year earlier.
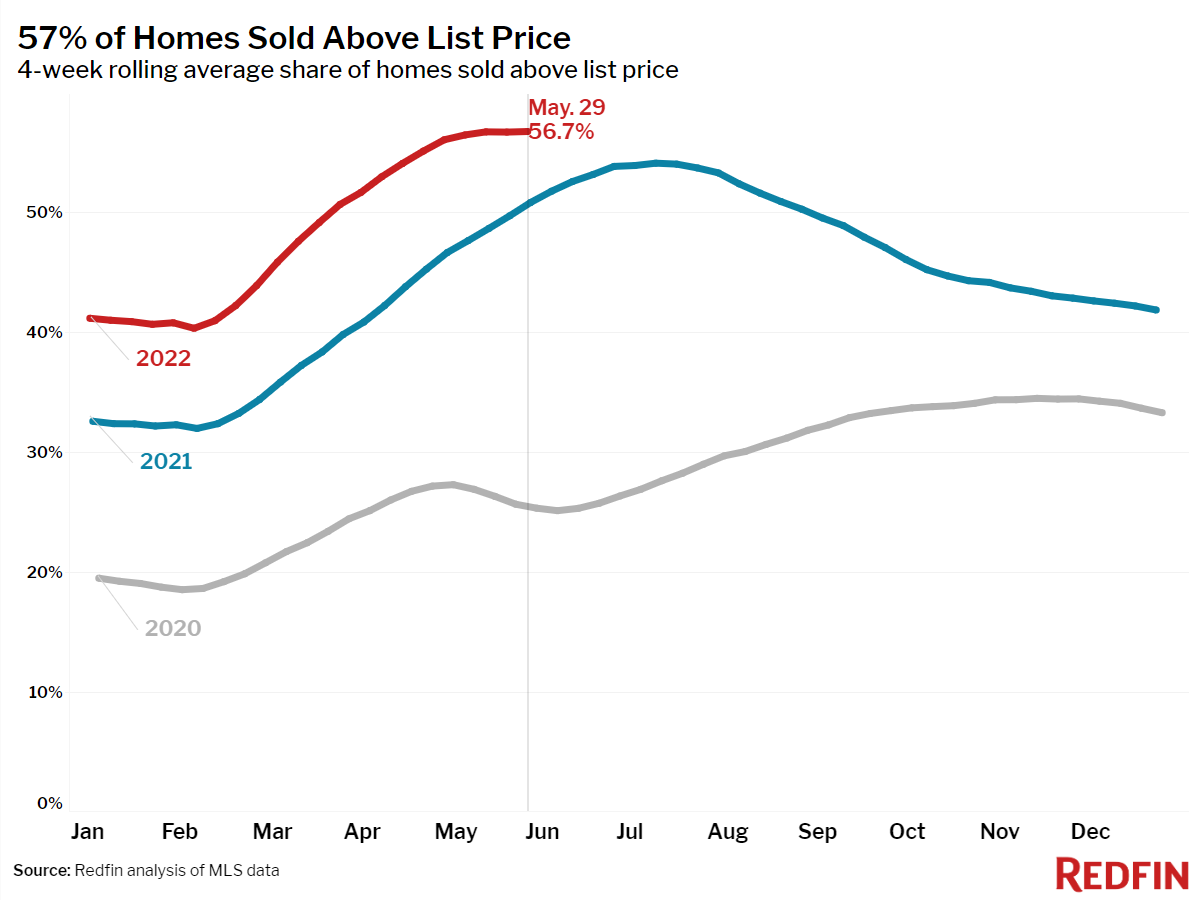
- A record 57% of homes sold above list price, up from 51% a year earlier.
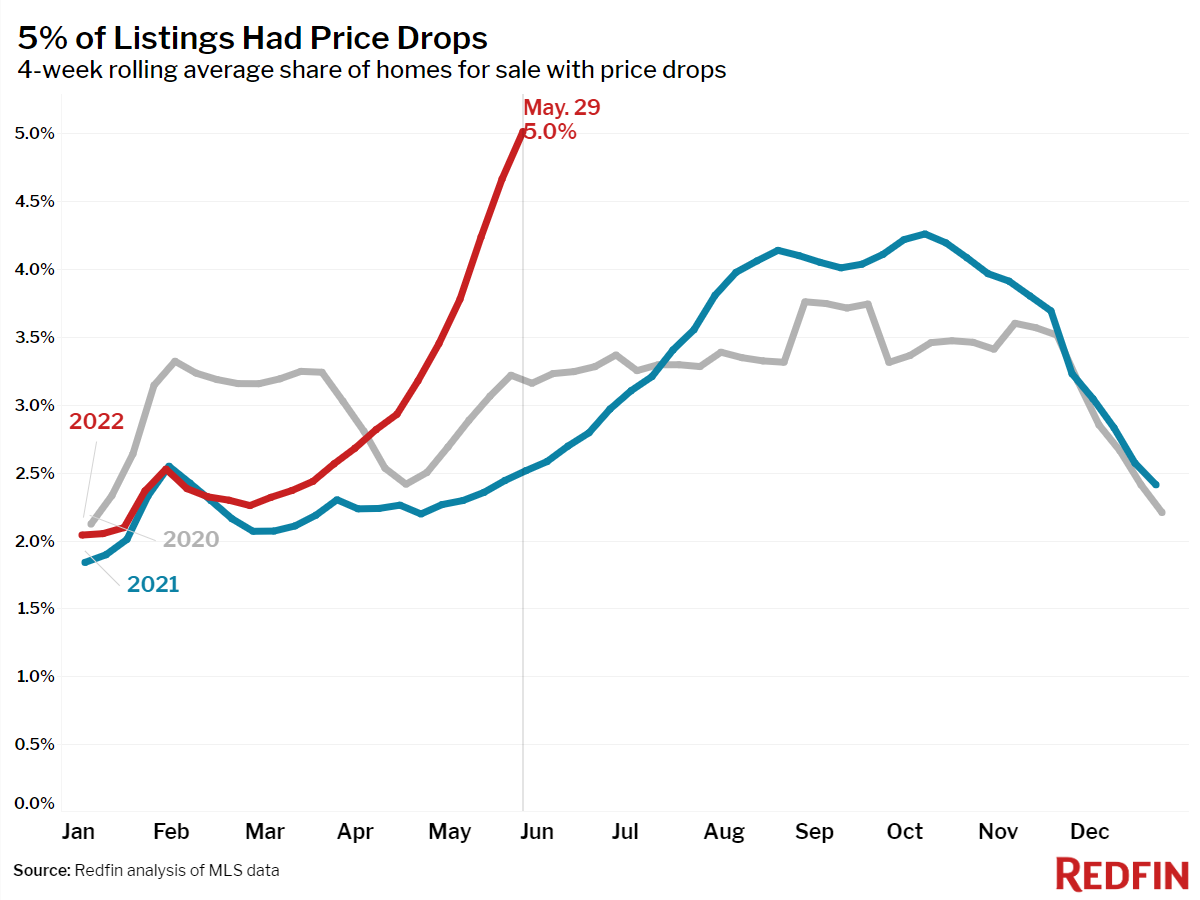
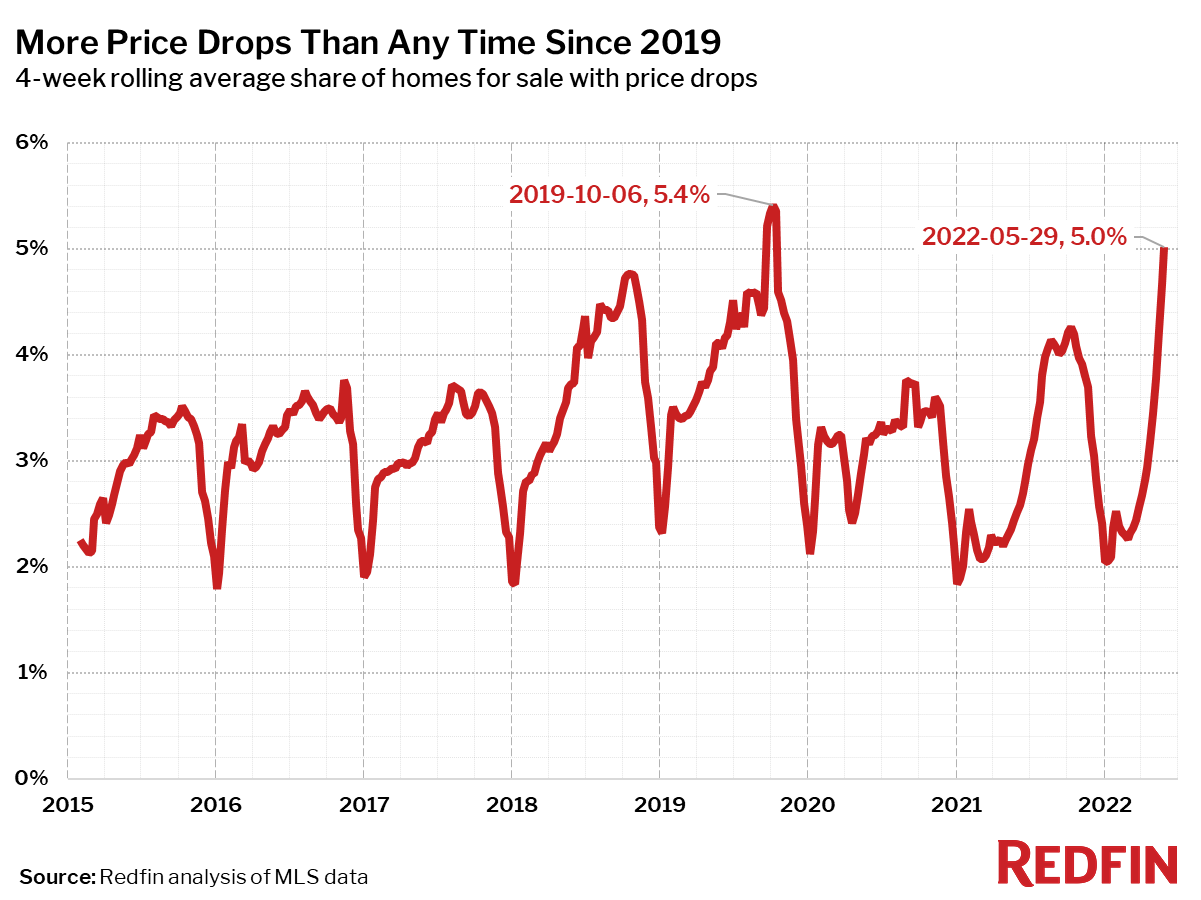
- On average, 5% of homes for sale each week had a price drop. Overall, 20.1% dropped their price in the past four weeks, up from 13.8% a month earlier and 10.1% a year ago. This was the highest share since October 2019.
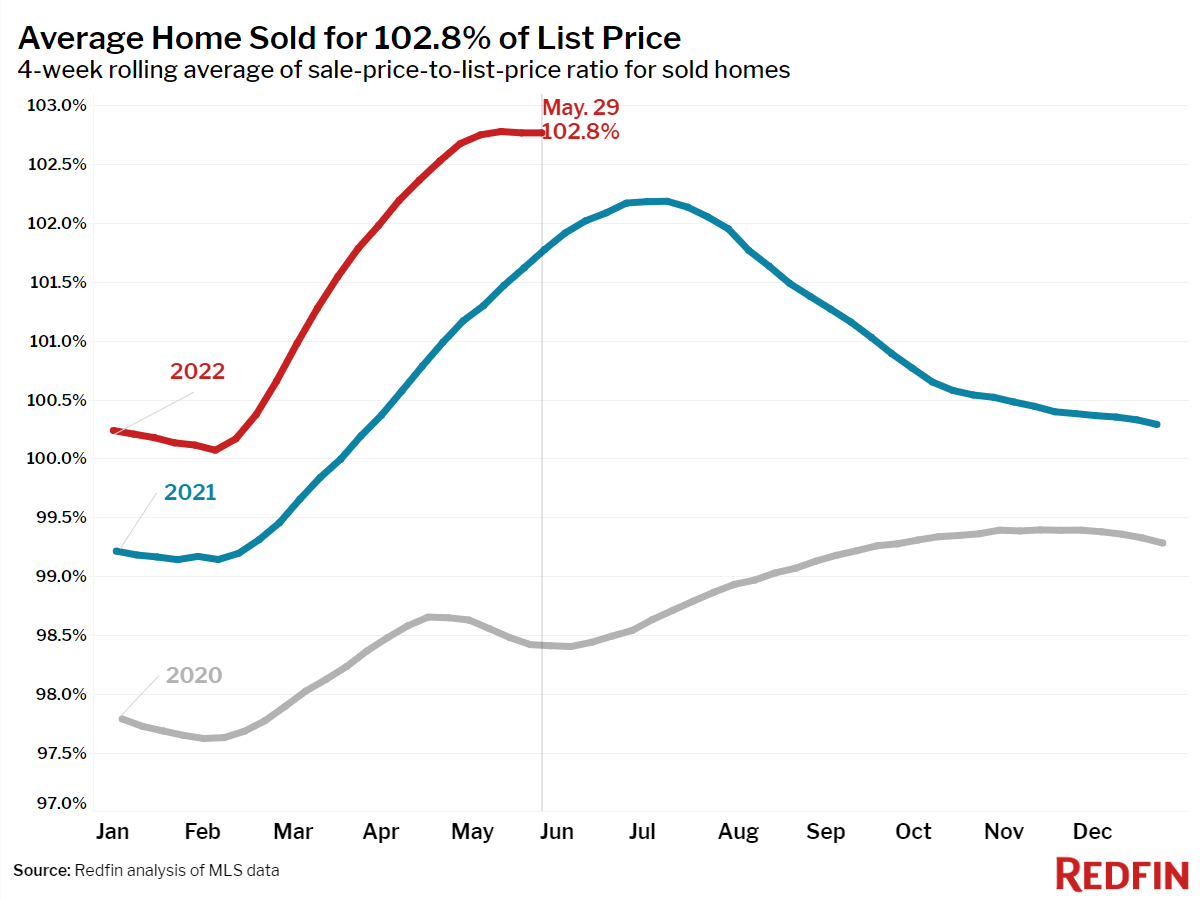
- The average sale-to-list price ratio, which measures how close homes are selling to their asking prices, was flat at an all-time high of 102.8%. In other words, the average home sold for 2.8% above its asking price. This was up from 101.8% a year earlier.
Refer to our metrics definition page for explanations of all the metrics used in this report.