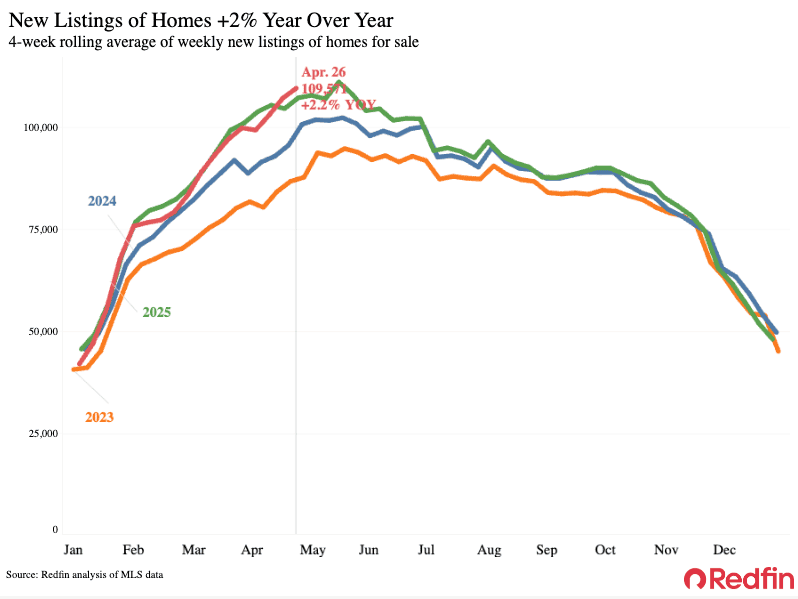
More homeowners are putting their houses on the market, with new listings increasing for the second week in a row after five straight months of declines.
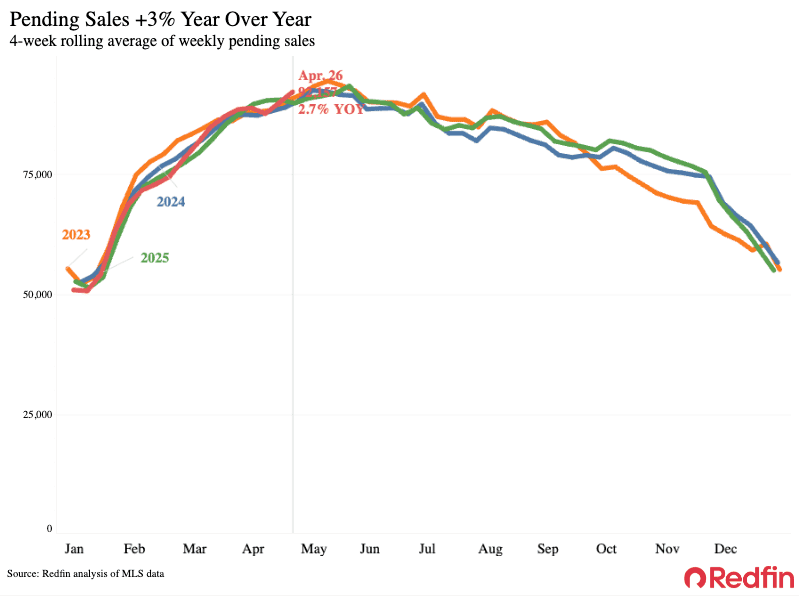
U.S. pending home sales rose 2.7% year over year during the four weeks ending April 26, the biggest increase in six weeks. Mortgage-purchase applications have risen to their highest level in three months.
There are a few reasons more homebuyers are on the hunt:
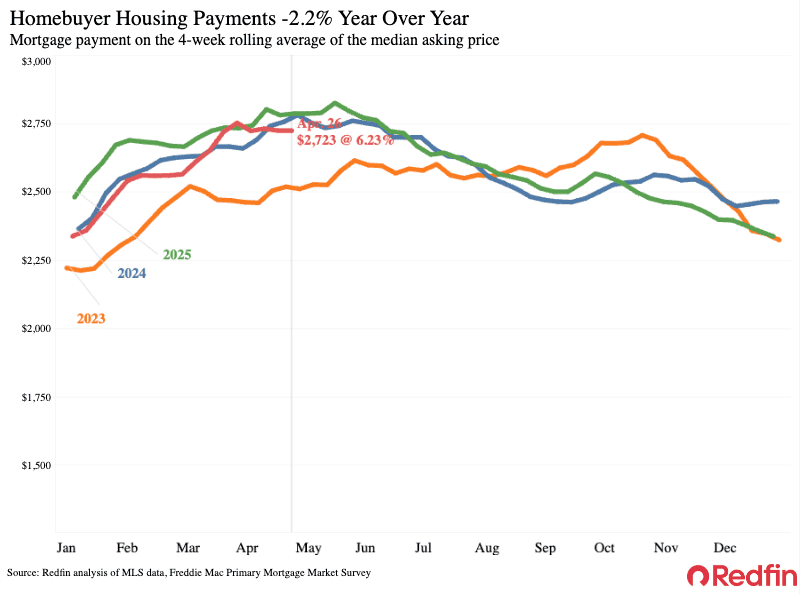
- Affordability is improving. The weekly average mortgage rate has dropped to 6.23% from a seven-month high of 6.46% at the start of April, pushing the median monthly housing payment down 2.2% year over year.
- Markets have started to stabilize. At the same time, some sidelined house hunters are encouraged because markets–and mortgage rates–have steadied as the Iran war fades a bit from the headlines. The timing of Easter is also contributing to the year-over-year uptick in pending sales; Easter didn’t fall into this four-week period, but it was in 2025’s comparable period.
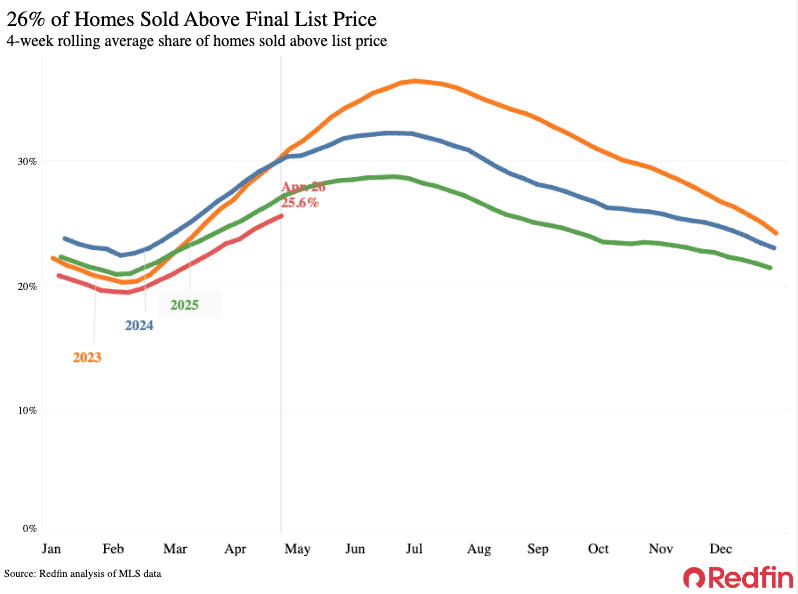
Sellers are coming out of the woodwork as they notice demand from buyers creeping up. New listings rose 2.2% year over year, the second week of increases after five straight months of declines. We are also in the midst of prime home-selling season, when homes are more likely to sell above their asking price, and to sell faster.
“Even though more buyers are coming off the sidelines, some are still wondering if they should wait for mortgage rates to fall more before making a move. I tell them no–if you love a home and you can afford it, make an offer,” said Sue Dhillon, a Redfin Premier agent in Seattle. “It is a buyer’s market, but there is competition for desirable homes in popular neighborhoods. And while prices are lower than they have been over the past few years, they will rise quickly if bidding wars do pick up.”
For Redfin economists’ takes on the housing market, please visit Redfin’s “From Our Economists” page.
Leading indicators
| Indicators of homebuying demand and activity | ||||
| Value (if applicable) | Recent change | Year-over-year change | Source | |
| Daily average 30-year fixed mortgage rate | 6.45% (April 29) | Down from 6.64% about a month earlier | Down from 6.84% | Mortgage News Daily |
| Weekly average 30-year fixed mortgage rate | 6.23% (week ending April 23) | Down from 6-month high three weeks earlier | Down from 6.81% | Freddie Mac |
| Mortgage-purchase applications (seasonally adjusted) | Up 1% from a week earlier (as of week ending April 24) | Up 21% | Mortgage Bankers Association | |
| Google searches of “homes for sale” | Highest level in 9 months (as of April 27) | Up more than 30% | Google Trends | |
| Touring activity | Up 35% from the start of the year (as of April 23) | At this time last year, it was up 29% from the start of 2025 | ShowingTime | |
Key housing-market data
| U.S. highlights: Four weeks ending April 26, 2026
Redfin’s national metrics include data from 400+ U.S. metro areas and are based on homes listed and/or sold during the period. Weekly housing-market data goes back through 2015. Subject to revision. |
|||
| Four weeks ending April 26, 2026 | Year-over-year change | Notes | |
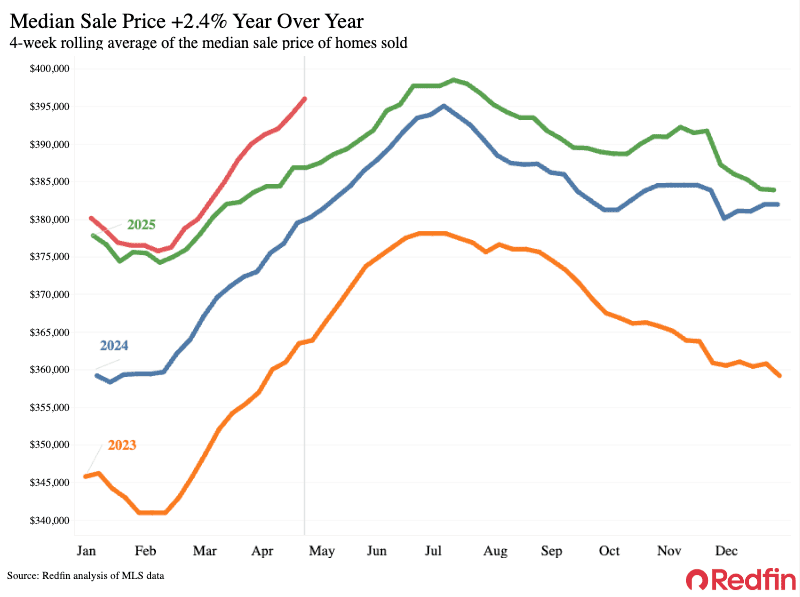
| Median sale price | $396,000 | 2.4% | Biggest increase in over a year |
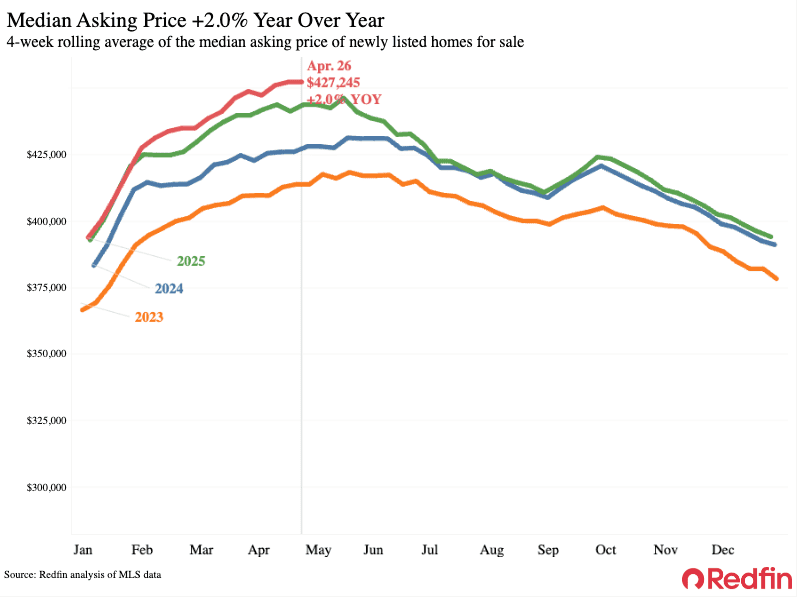
| Median asking price | $427,245 | 2% | |
| Median monthly mortgage payment | $2,723 at a 6.23% mortgage rate | -2.2% | |
| Pending sales | 92,157 | 2.7% | Biggest increase in 6 weeks |
| New listings | 109,571 | 2.2% | |
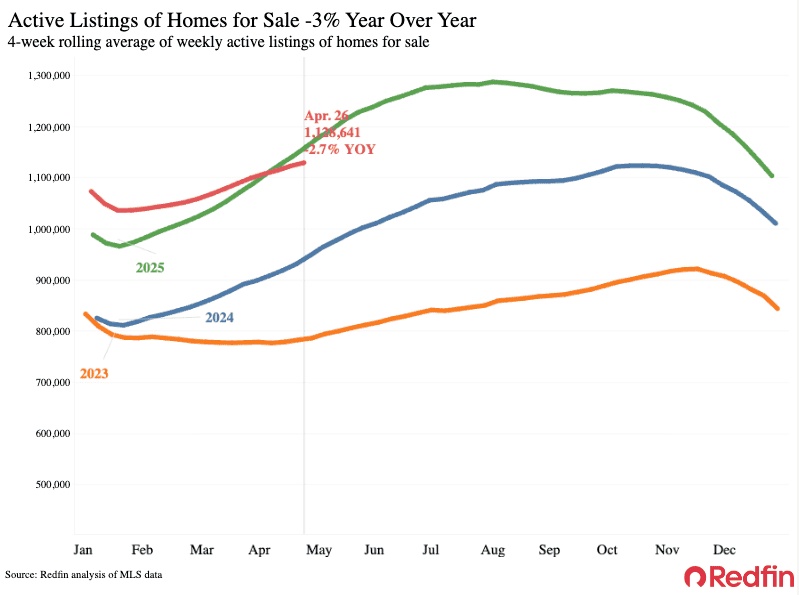
| Active listings | 1,128,641 | -2.7% | Biggest decline since 2023 |
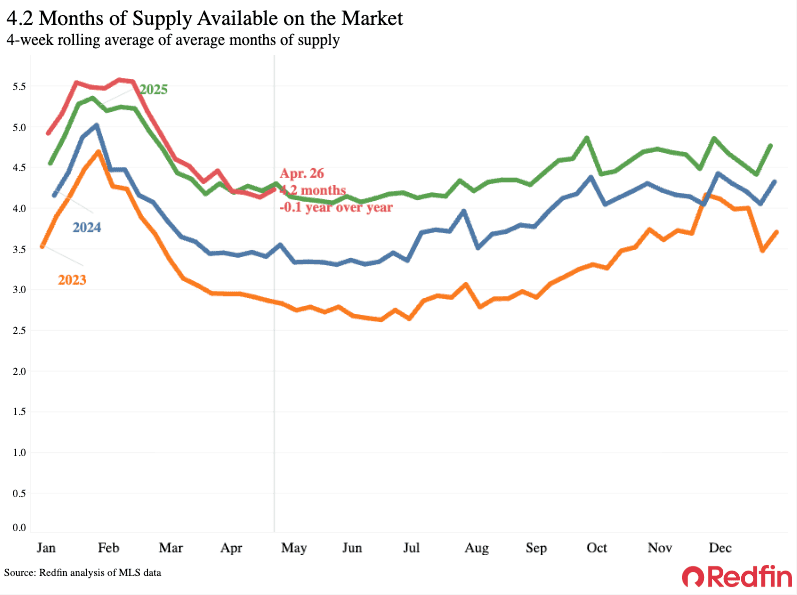
| Months of supply | 4.2 | -0.1 pts. | 4 to 5 months of supply is considered balanced, with a lower number indicating seller’s market conditions |
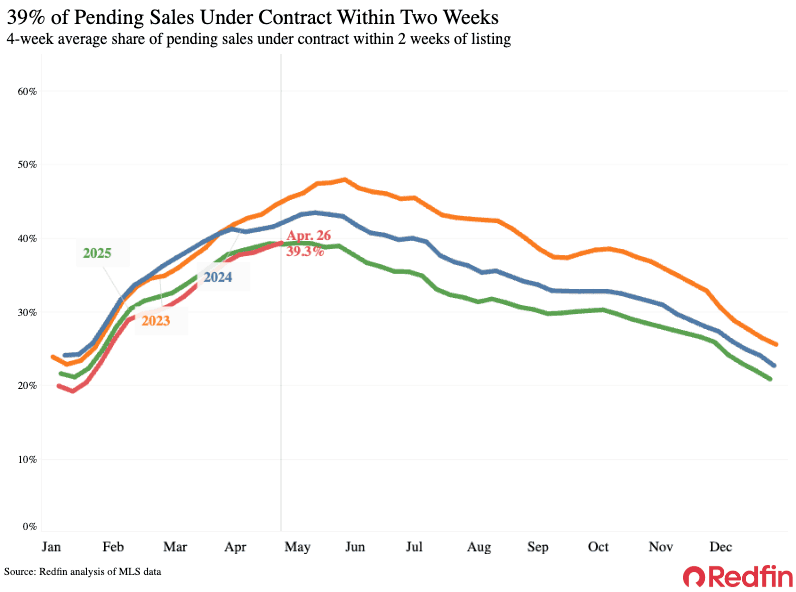
| Share of homes off market in two weeks | 39.3% | Essentially unchanged | |
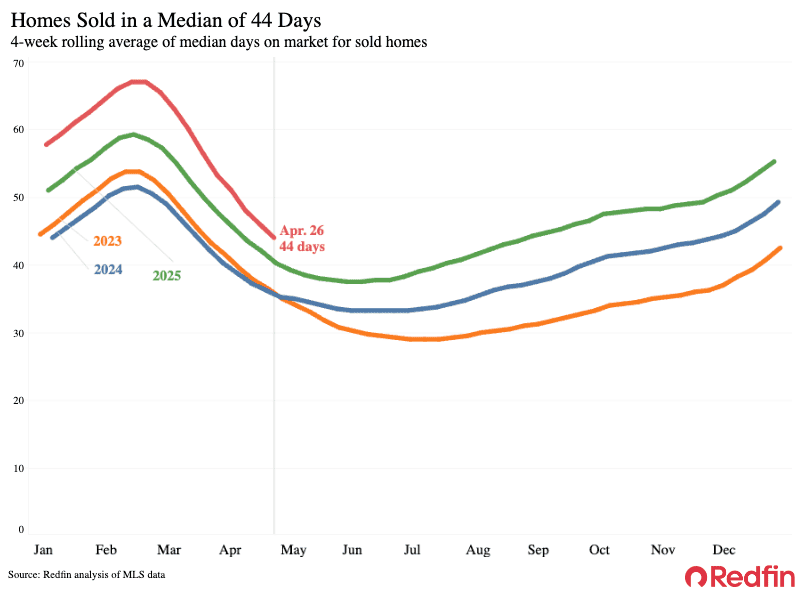
| Median days on market | 44 | +4 days | |
| Share of homes sold above list price | 25.6% | Down from 26% | |
| Average sale-to-list price ratio | 98.7% | Down from 98.8% | |
|
Metro-level highlights: Four weeks ending April 26, 2026 Redfin’s metro-level data includes the 50 most populous U.S. metros. Select metros may be excluded from time to time to ensure data accuracy. |
|||
|---|---|---|---|
| Metros with biggest year-over-year increases | Metros with biggest year-over-year decreases |
Notes |
|
| Median sale price | Cleveland (11.3%)
Detroit (11.3%) Providence, RI (10.6%) Pittsburgh (9.7%) San Francisco (7.7%) |
Seattle (-3.6%)
Dallas (-2.9%) Austin, TX (-2%) Minneapolis (-1.9%) Newark, NJ (-1.9%) |
Declined in 16 metros |
| Pending sales | West Palm Beach, FL (27.2%)
San Francisco (15.1%) Chicago (14.6%) Miami (11.1%) Austin, TX (9.7%) |
Detroit (-9.8%)
Houston (-9.3%) Warren, MI (-9.2%) Seattle (-8.8%) Nassau County, NY (-8.3%) |
|
| New listings | Montgomery County, PA (18.5%)
Milwaukee, WI (17.8%) Pittsburgh (13.9%) Nassau County, NY (11.4%) New Brunswick, NJ (11.3%) |
Riverside, CA (-13.2%)
Las Vegas (-12.4%) San Francisco (-11%) Denver (-10.6%) Tampa, FL (-10.5%) |
|
Refer to our metrics definition page for explanations of all the metrics used in this report.