Mortgage-purchase applications and Redfin’s Homebuyer Demand Index both increased as rates stayed around 6.6%, down sharply from 7% earlier this month, saving the typical buyer over $100 in monthly mortgage payments. Still, supply is piling up–posting a record annual increase–as pending sales fell the most on record.
We are taking a short break from analysis this week, but please see the bullet points and charts below for this week’s housing-market data. We’ll be back with full commentary in next week’s report. Happy Thanksgiving!
Leading indicators of homebuying activity:
- For the week ending November 23, 30-year mortgage rates ticked down to 6.58%.
- Mortgage purchase applications during the week ending November 18 increased 8.7% from a month earlier, seasonally adjusted. Purchase applications were down 41% from a year earlier.
- Fewer people searched for “homes for sale” on Google than this time in 2021. Searches during the week ending November 19 were down about 38% from a year earlier.
- The seasonally adjusted Redfin Homebuyer Demand Index—a measure of requests for home tours and other homebuying services from Redfin agents— was up 1.6% from a month earlier but down 33% from a year earlier during the four weeks ending November 20.
- Touring activity as of November 20 was down 35% from the start of the year, compared to a 3% year-over-year decrease at the same time last year, according to home tour technology company ShowingTime.
Key housing market takeaways for 400+ U.S. metro areas:
Unless otherwise noted, the data in this report covers the four-week period ending November 20. Redfin’s weekly housing market data goes back through 2015.
Data based on homes listed and/or sold during the period:
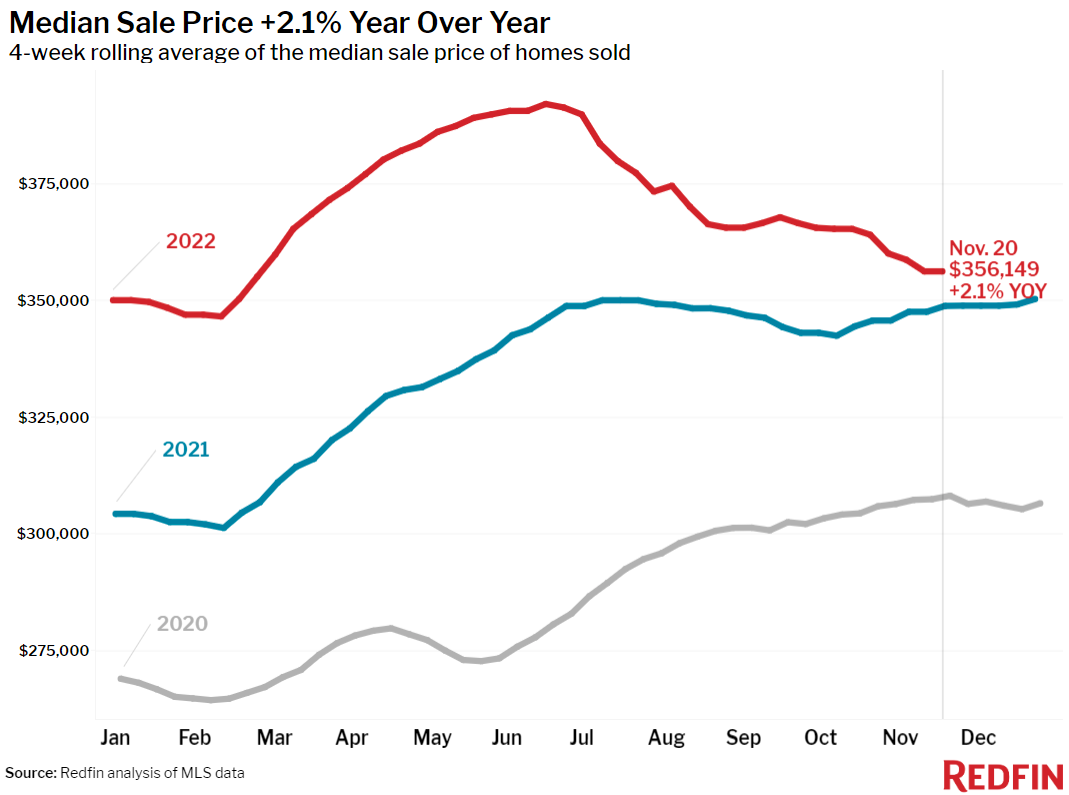
- The median home sale price was $356,149, up 2.1% year over year, the smallest increase since the start of the pandemic.
- Among the 50 most populous U.S. metros, home-sale prices fell from a year earlier in five of them. Prices declined 9.5% year over year in San Francisco, 2.1% in Sacramento, 1.7% in Detroit and less than 1% in San Jose, CA and San Diego.
- Among the 50 most populous U.S. metros, pending sales fell the most from a year earlier in Las Vegas (-64%), Austin (-58.2%), Phoenix (-57%), Jacksonville, FL (-57%) and Sacramento (-54%).
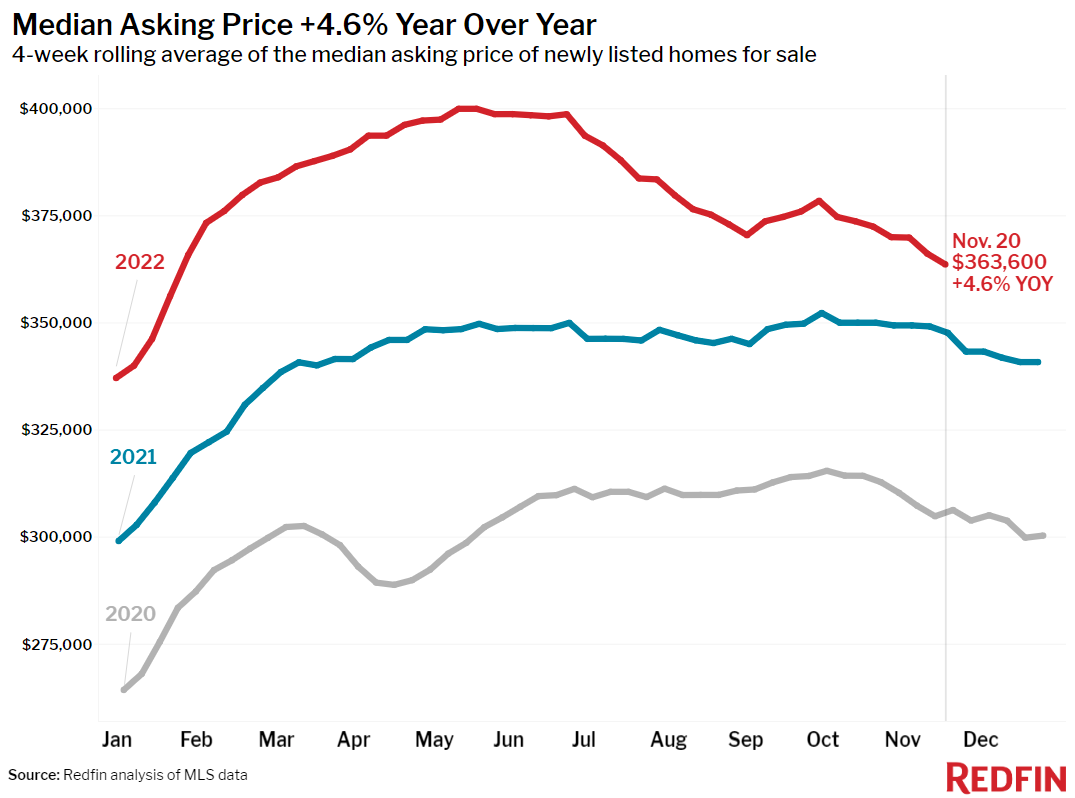
- The median asking price of newly listed homes was $363,600, up 4.6% year over year, the slowest growth rate since the beginning of the pandemic.
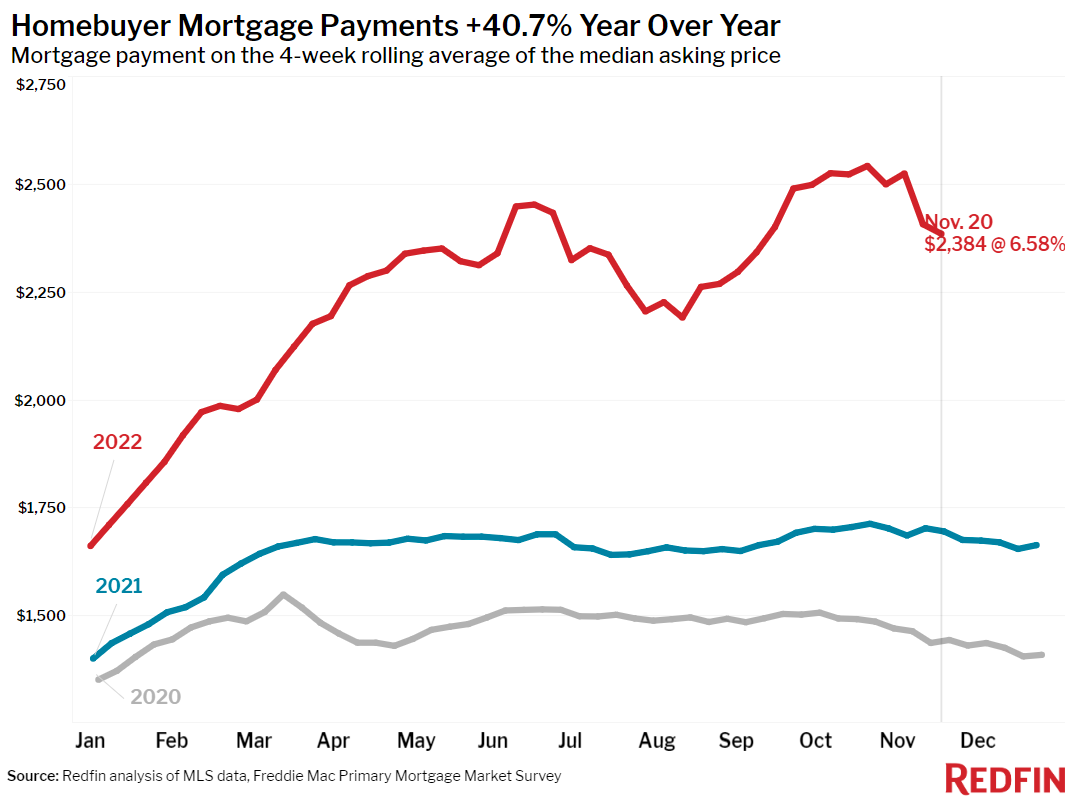
- The monthly mortgage payment on the median-asking-price home was $2,384 at the current 6.58% mortgage rate. That’s down slightly from a week earlier and down 6% from two weeks earlier, when mortgage rates were at 7.08%. That’s equal to $140 in monthly mortgage savings from two weeks ago for the typical buyer. Still, monthly mortgage payments are up 41% from a year ago.
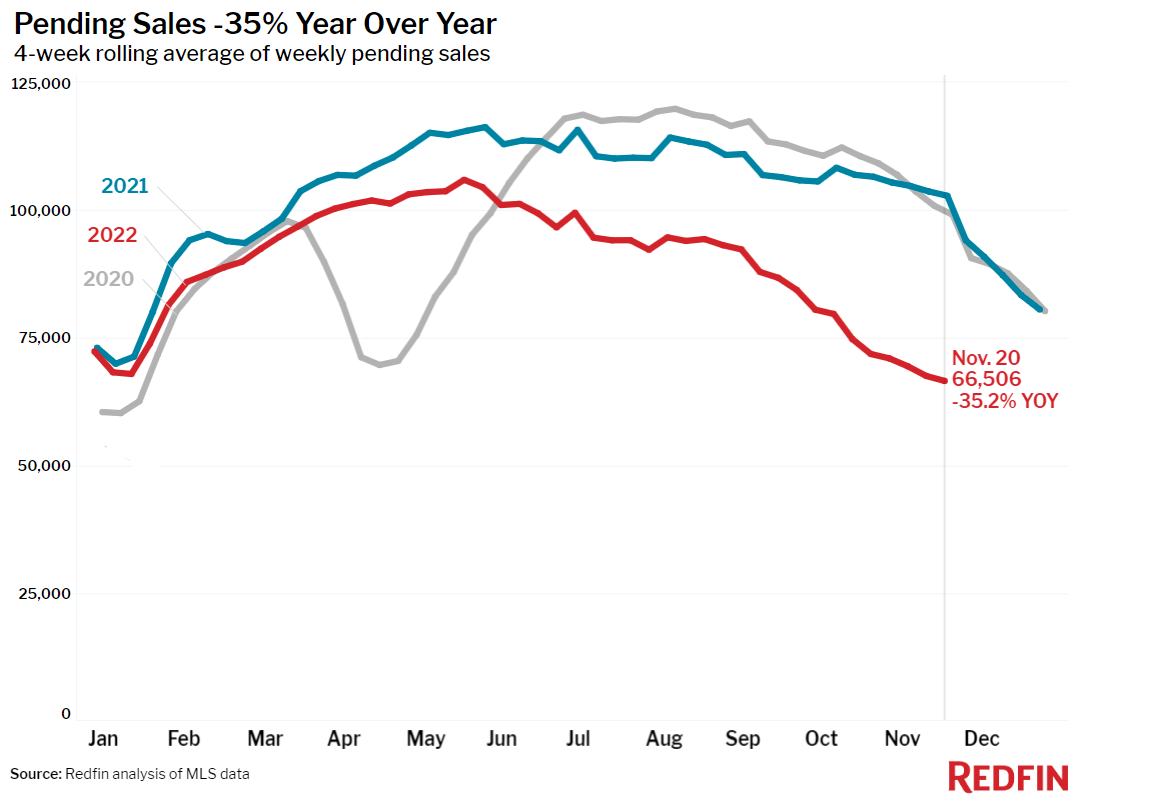
- Pending home sales were down 35.2% year over year, the largest decline since at least January 2015, as far back as this data goes.
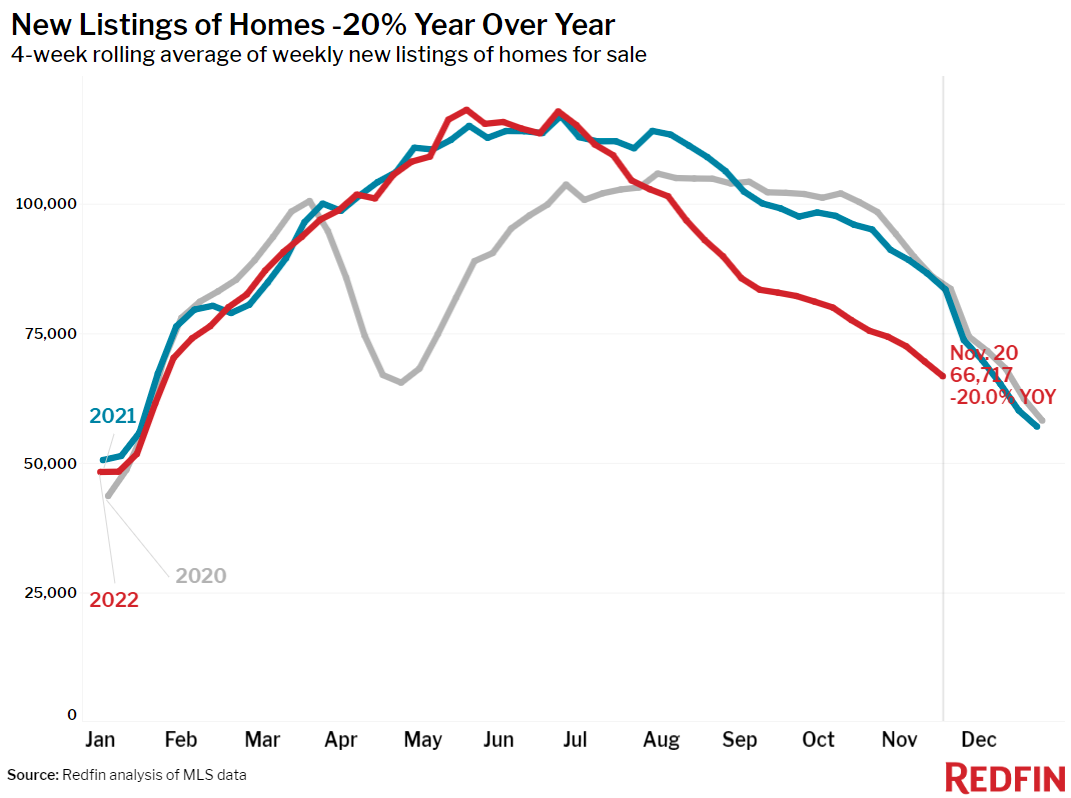
- New listings of homes for sale were down 20% from a year earlier, one of the largest declines since the beginning of the pandemic.
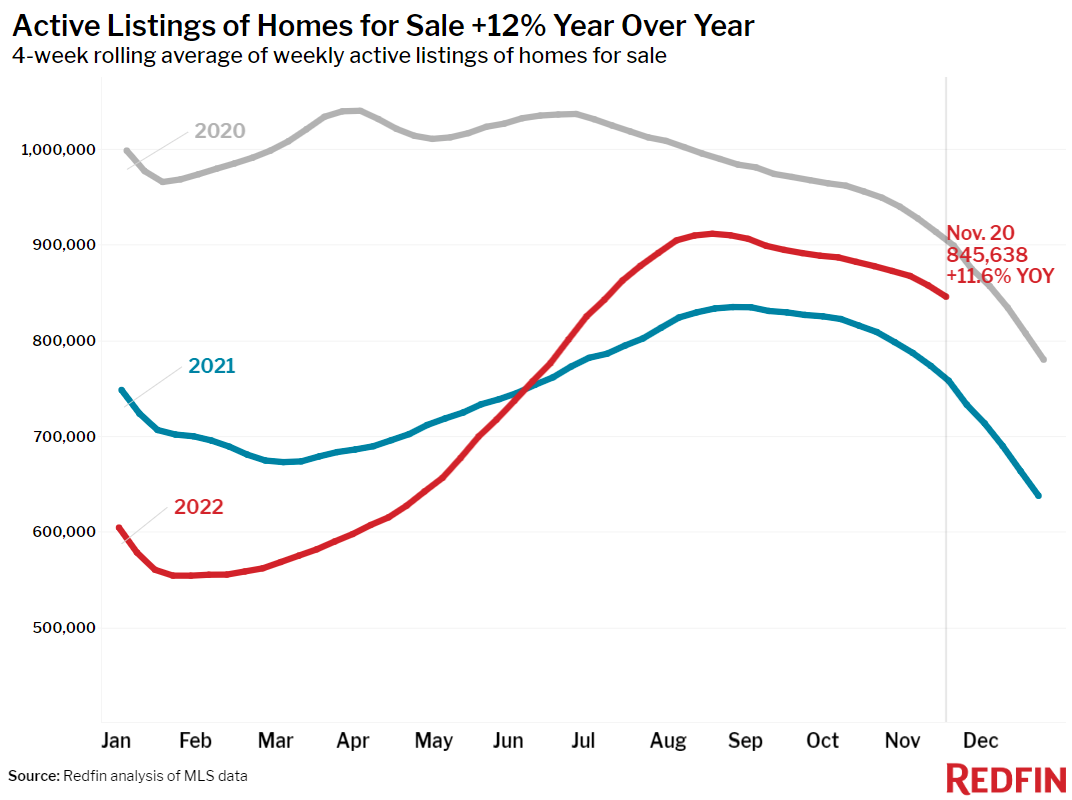
- Active listings (the number of homes listed for sale at any point during the period) were up 11.6% from a year earlier, the biggest annual increase since at least 2015.
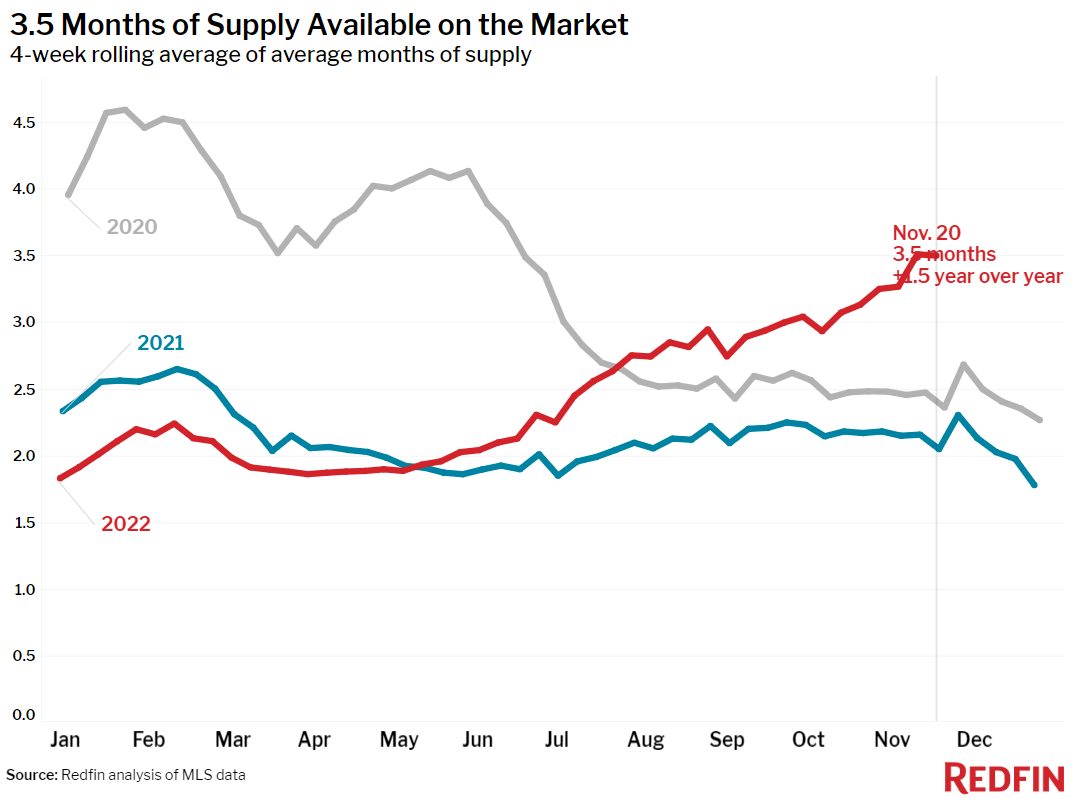
- Months of supply—a measure of the balance between supply and demand, calculated by dividing the number of active listings by closed sales—was 3.5 months, the highest level since June 2020.
- 32% of homes that went under contract had an accepted offer within the first two weeks on the market, little changed from the prior four-week period but down from 40% a year earlier.
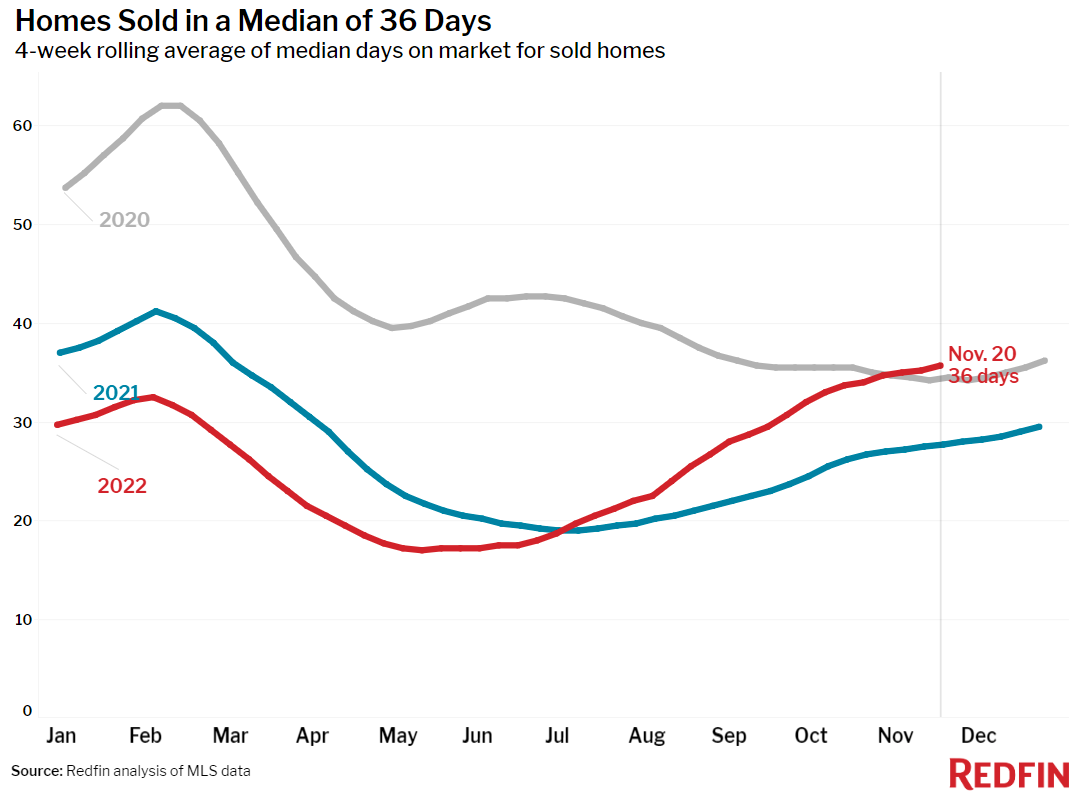
- Homes that sold were on the market for a median of 36 days, up more than a week from 28 days a year earlier and up from the record low of 17 days set in May and early June.
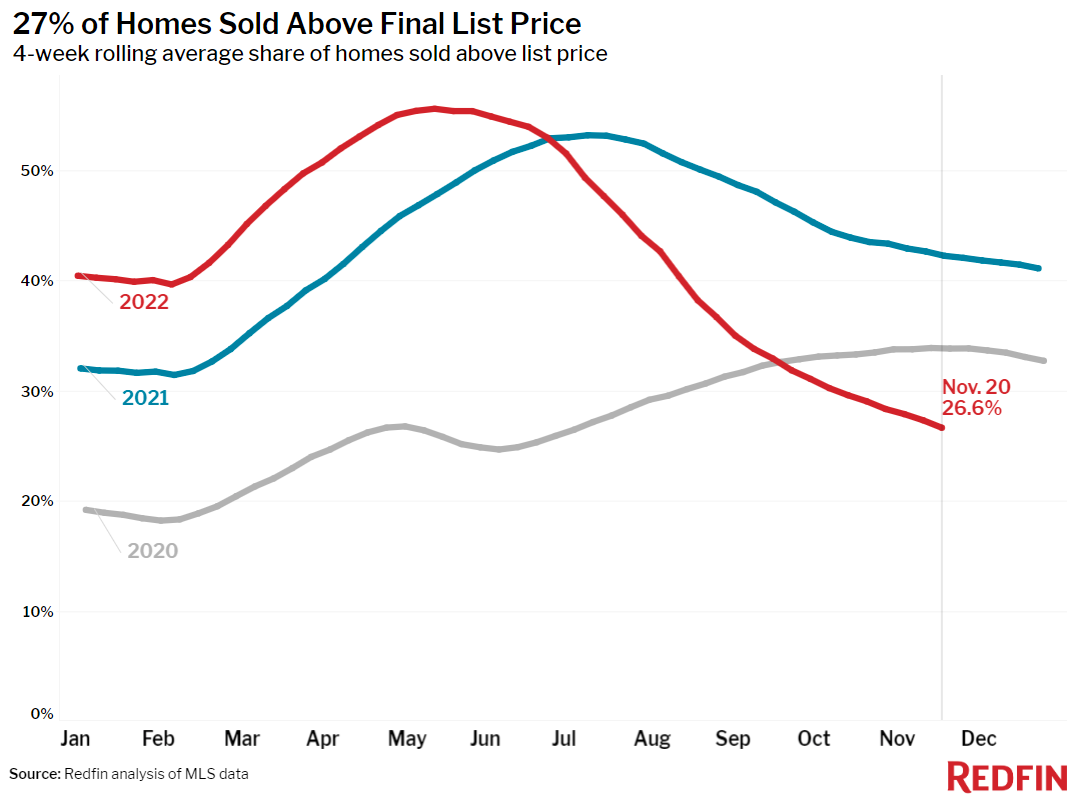
- 27% of homes sold above their final list price, down from 42% a year earlier and the lowest level since July 2020.
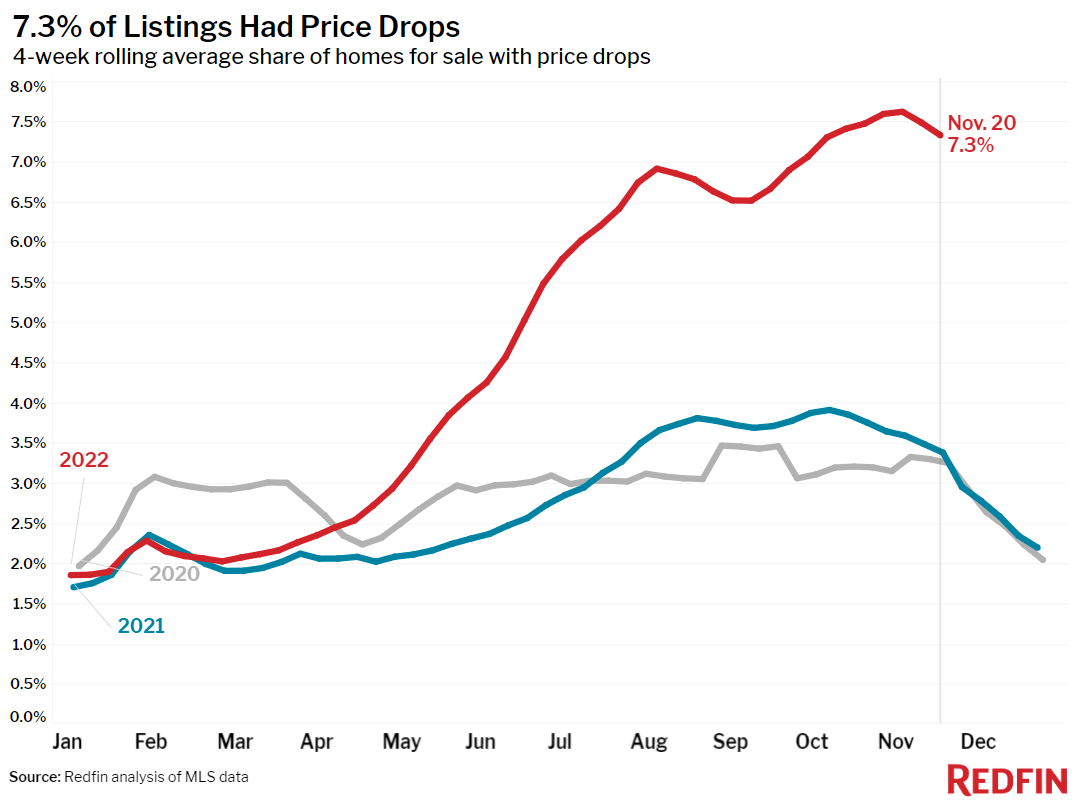
- On average, 7.3% of homes for sale each week had a price drop, up from 3.4% a year earlier but down slightly from the previous two weeks.
- The average sale-to-list price ratio, which measures how close homes are selling to their final asking prices, fell to 98.5% from 100.4% a year earlier. That’s the lowest level since June 2020.
Refer to our metrics definition page for explanations of all the metrics used in this report.


 United States
 Canada