New listings posted their biggest year-over-year increase since 2021 during the four weeks ending November 19. The median monthly mortgage payment has fallen more than $100 over the last month as rates dropped from 8% to 7.3%. Buyers are acting on the good news: Mortgage-purchase applications increased 4% this week to their highest level in six weeks.
We’re taking a break from analysis this week, but please see the bullet points and charts below for this week’s housing-market data. We’ll be back with full commentary in next week’s report. Happy Thanksgiving!
Leading indicators
| Indicators of homebuying demand and activity | ||||
| Value (if applicable) | Recent change | Year-over-year change | Source | |
| Daily average 30-year fixed mortgage rate | 7.32% (Nov. 22) | Down from 7.58% a week earlier; lowest level since mid-September | Up from 6.64% | Mortgage News Daily |
| Weekly average 30-year fixed mortgage rate | 7.29% (week ending Nov. 22) | Down from two-decade high of 7.79% a month earlier; fourth straight week of declines | Up from 6.61% | Freddie Mac |
| Mortgage-purchase applications (seasonally adjusted) | Up 4% from a week earlier (as of week ending Nov. 17) | Down 20% | Mortgage Bankers Association | |
| Redfin Homebuyer Demand Index (seasonally adjusted) | Down 3% from a month earlier (as of the week ending Nov. 19) | Down 7% | Redfin Homebuyer Demand Index, a measure of requests for tours and other homebuying services from Redfin agents | |
| Google searches for “home for sale” | Down 11% from a month earlier (as of Nov. 18) | Down 7% | Google Trends | |
| Touring activity | Down 23% from the start of the year (as of Nov. 20) | At this time last year, it was also down 35% from the start of 2022 | ShowingTime, a home touring technology company | |
Key housing-market data
| U.S. highlights: Four weeks ending November 19, 2023
Redfin’s national metrics include data from 400+ U.S. metro areas, and is based on homes listed and/or sold during the period. Weekly housing-market data goes back through 2015. Subject to revision. |
|||
| Four weeks ending November 19, 2023 | Year-over-year change | Notes | |
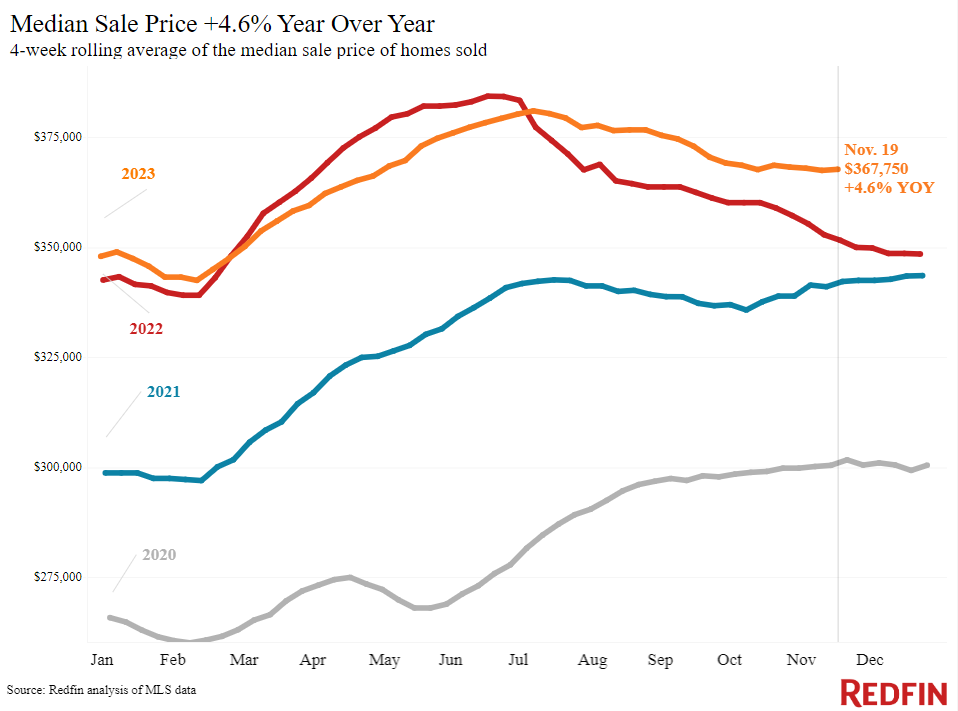
| Median sale price | $367,750 | 4.6% | Biggest increase in over a year. Prices are up partly because elevated mortgage rates were hampering prices during this time last year |
| Median asking price | $377,099 | 6.3% | Biggest increase in over a year |
| Median monthly mortgage payment | $2,616 at a 7.29% mortgage rate | 13% | Down $124 from all-time high set a month earlier |
| Pending sales | 66,456 | -8% | |
| New listings | 73,891 | 5.2% | Biggest uptick in over two years. The increase is partly because new listings were falling at this time last year. |
| Active listings | 871,492 | -7.3% | Smallest decline since June. Near highest level since the start of 2023. |
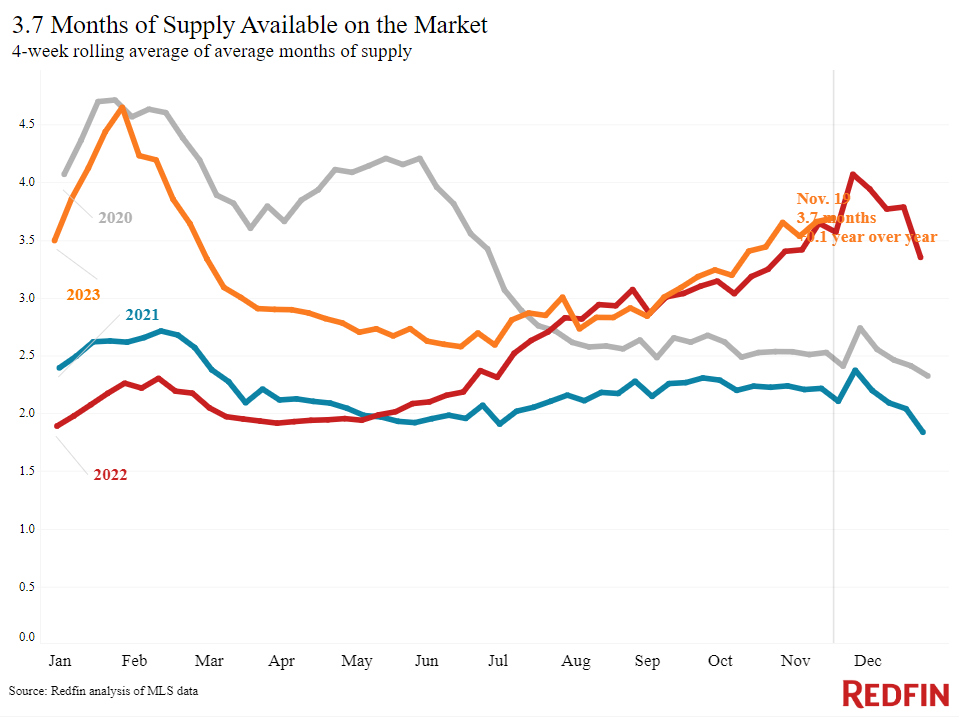
| Months of supply | 3.7 months | +0.1 pt. | 4 to 5 months of supply is considered balanced, with a lower number indicating seller’s market conditions. |
| Share of homes off market in two weeks | 34.8% | Up from 31% | |
| Median days on market | 34 | -3 days | |
| Share of homes sold above list price | 27.9% | Up from 26% | |
| Share of homes with a price drop | 6.5% | +0.2 pts. | |
| Average sale-to-list price ratio | 98.9% | +0.4 pts. | Lowest level since April |
| Metro-level highlights: Four weeks ending November 19, 2023
Redfin’s metro-level data includes the 50 most populous U.S. metros. Select metros may be excluded from time to time to ensure data accuracy. |
|||
| Metros with biggest year-over-year increases | Metros with biggest year-over-year decreases | Notes | |
| Median sale price | Anaheim, CA (17.4%)
Cincinnati, OH (12.6%) San Diego, CA (12.6%) Baltimore, MD (10.2%) West Palm Beach, FL (9.9%) |
Austin, TX (-9.3%)
San Antonio, TX (-3.4%) Portland, OR (-1.9%) Fort Worth, TX (-1.2%) |
Declined in 4 metros |
| Pending sales | San Jose, CA (14.2%)
Columbus, OH (4.2%) Las Vegas (1.2%) |
Cincinnati, OH (-22.3%)
New York (-19.1%) Portland, OR (-18.4%) Providence, RI (-17%) New Brunswick, NJ (-15.1%) |
Increased in 3 metros |
| New listings | San Jose, CA (25.6%)
Phoenix (20.8%) West Palm Beach, FL (18.5%) Orlando, FL (16.5%) Pittsburgh, PA (13.2%) |
Atlanta (-16.1%)
San Francisco (-10.3%) Seattle (-10.3%) Newark, NJ (-8.8%) Providence, RI (-5.5%) |
Declined in 16 metros |
Refer to our metrics definition page for explanations of all the metrics used in this report.